


Government, Report Design, Report Server, Reporting, Automated Reporting
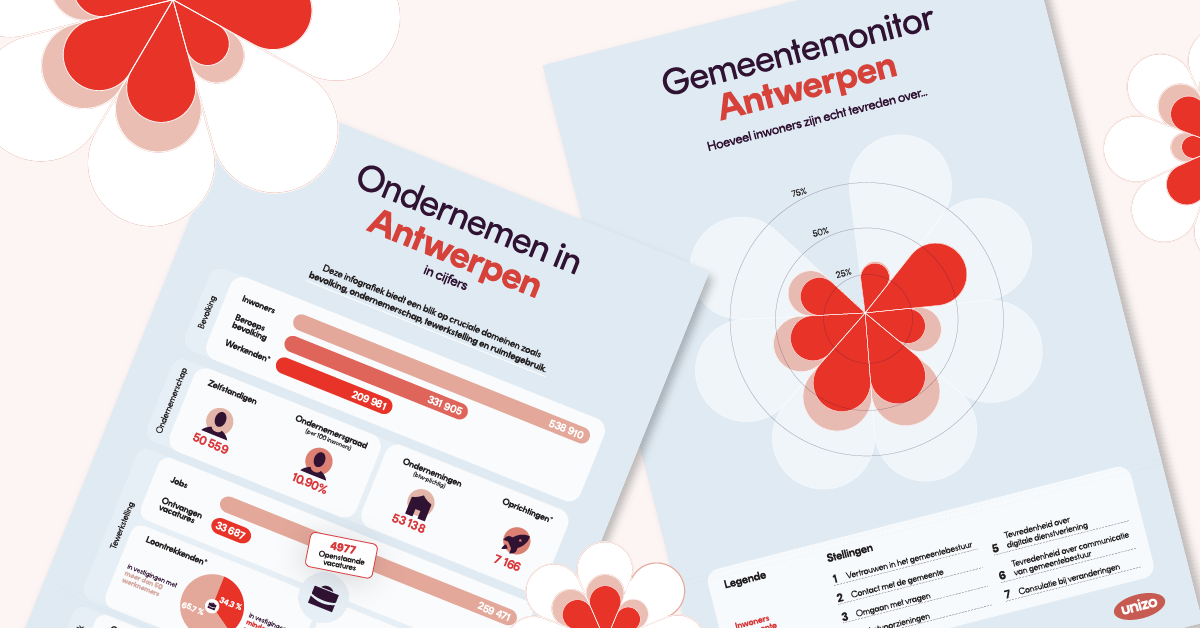
Targeted Reports to Empower Municipalities
Unizo is the largest Flemish employers’ organization in Belgium, representing over 80,000 small and...
Government, Report Server, Reporting, Automated Reporting
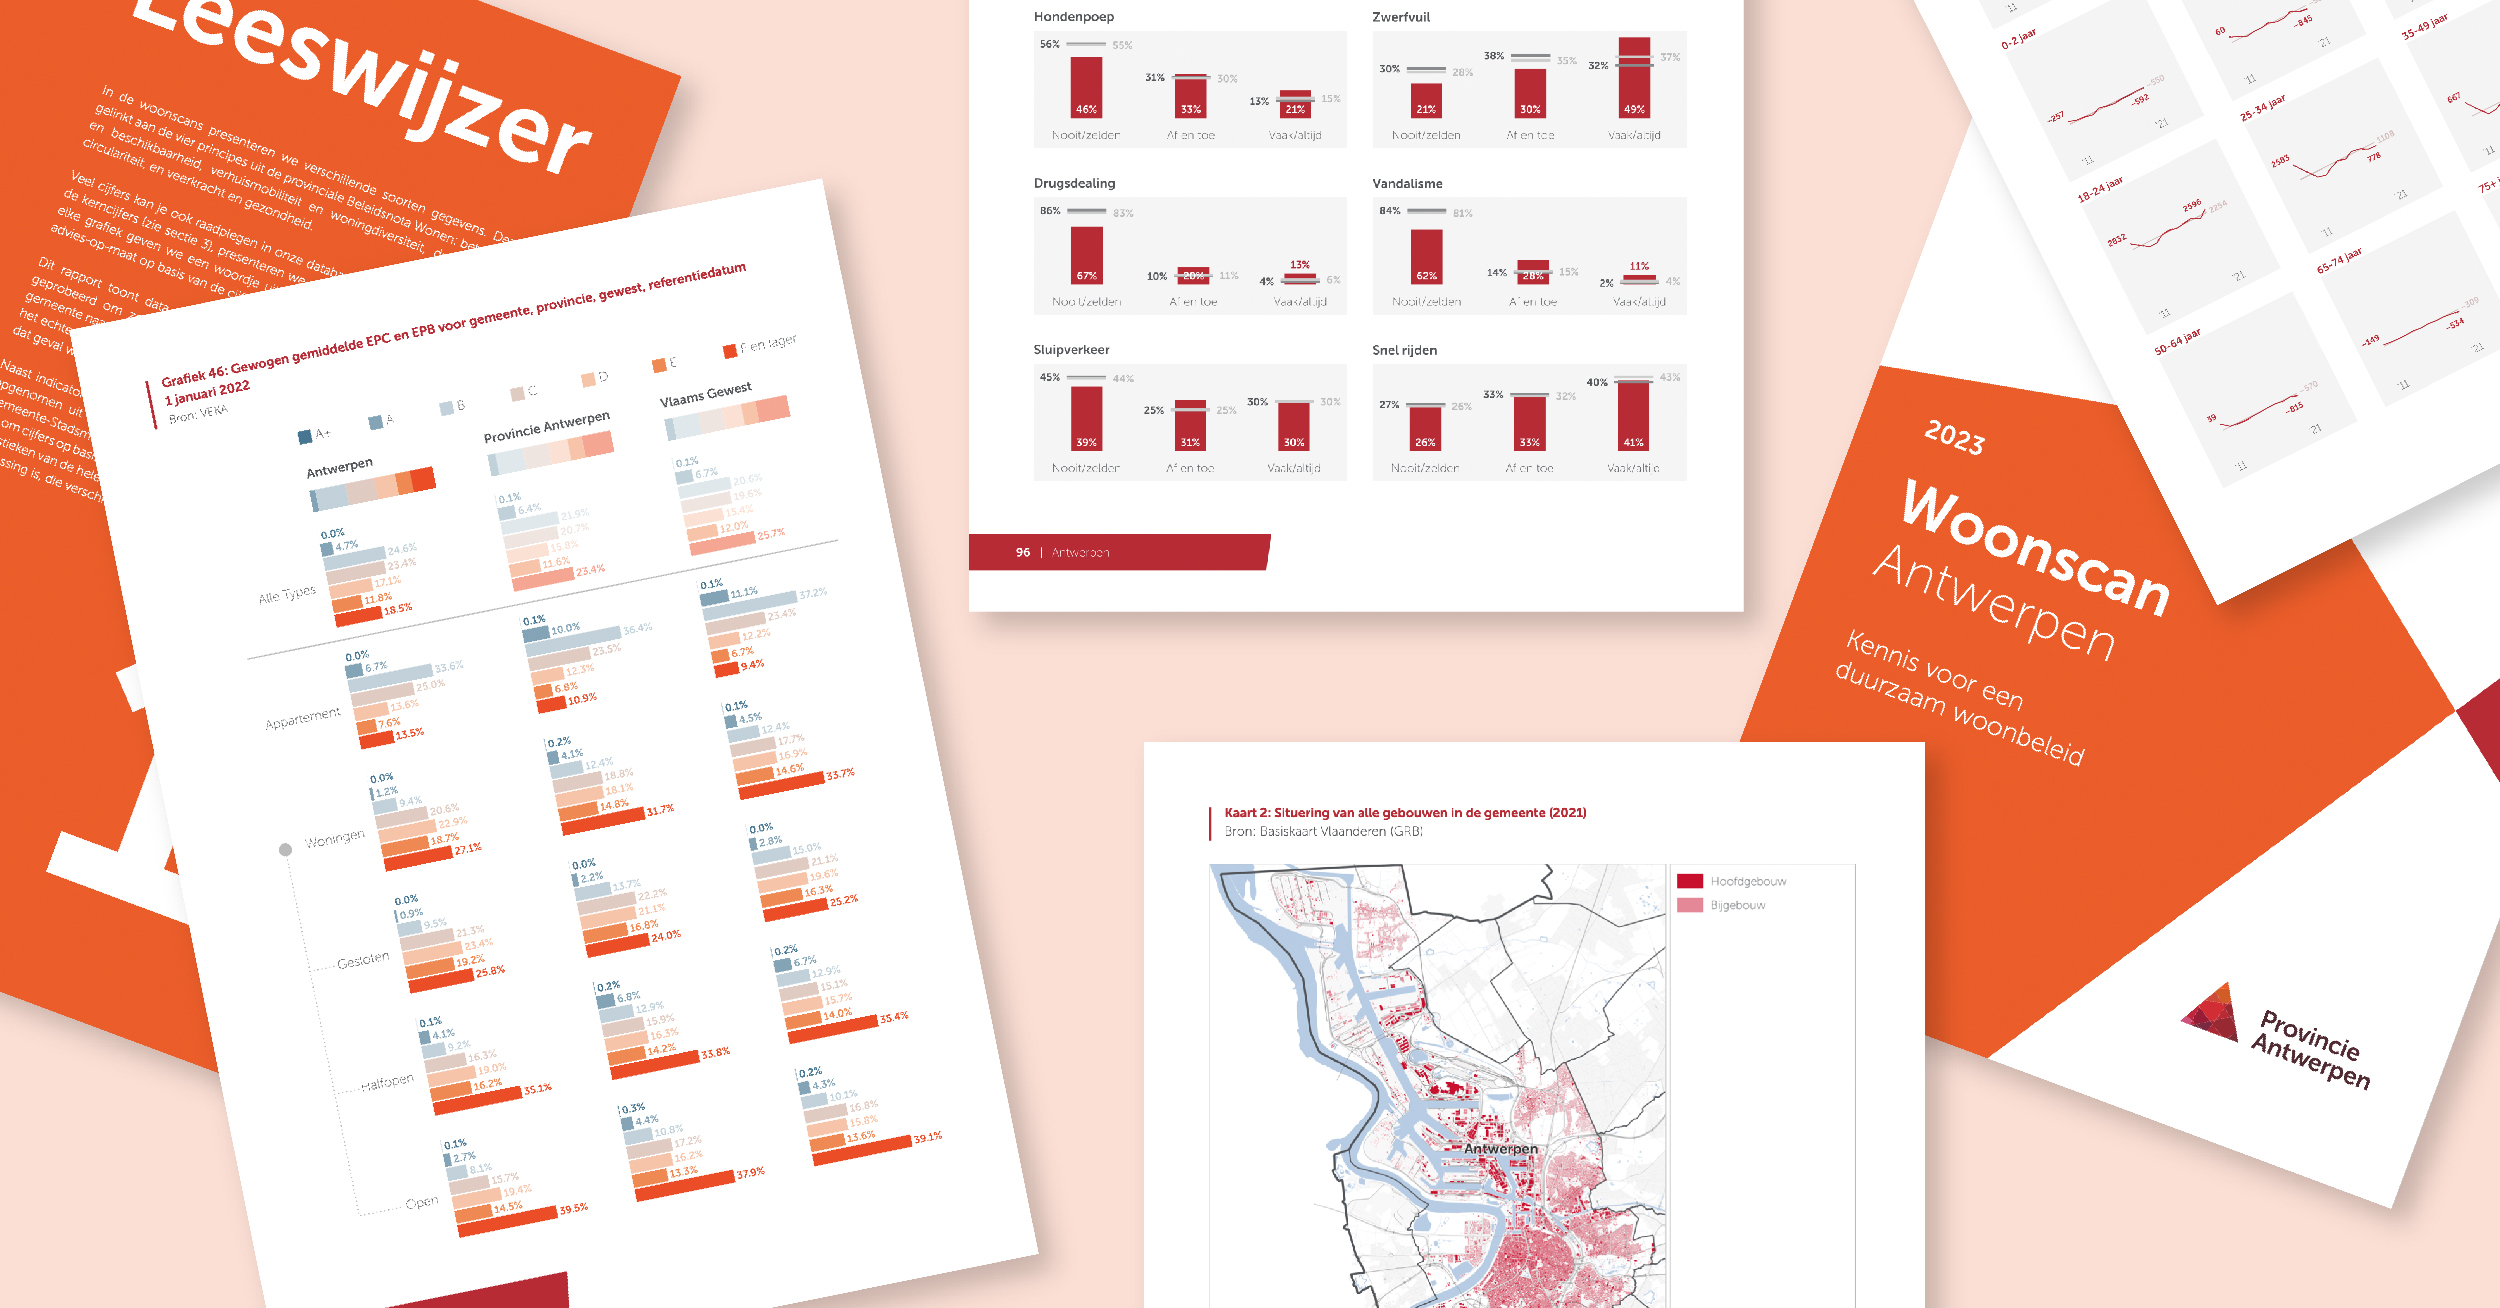
Empowering the Province of Antwerp: Datylon's Automated Reporting Solution
The Province of Antwerp, a regional government in Belgium, sought a partner to produce reports for...
Design Agency, Report Design, Report Server, Automated Reporting
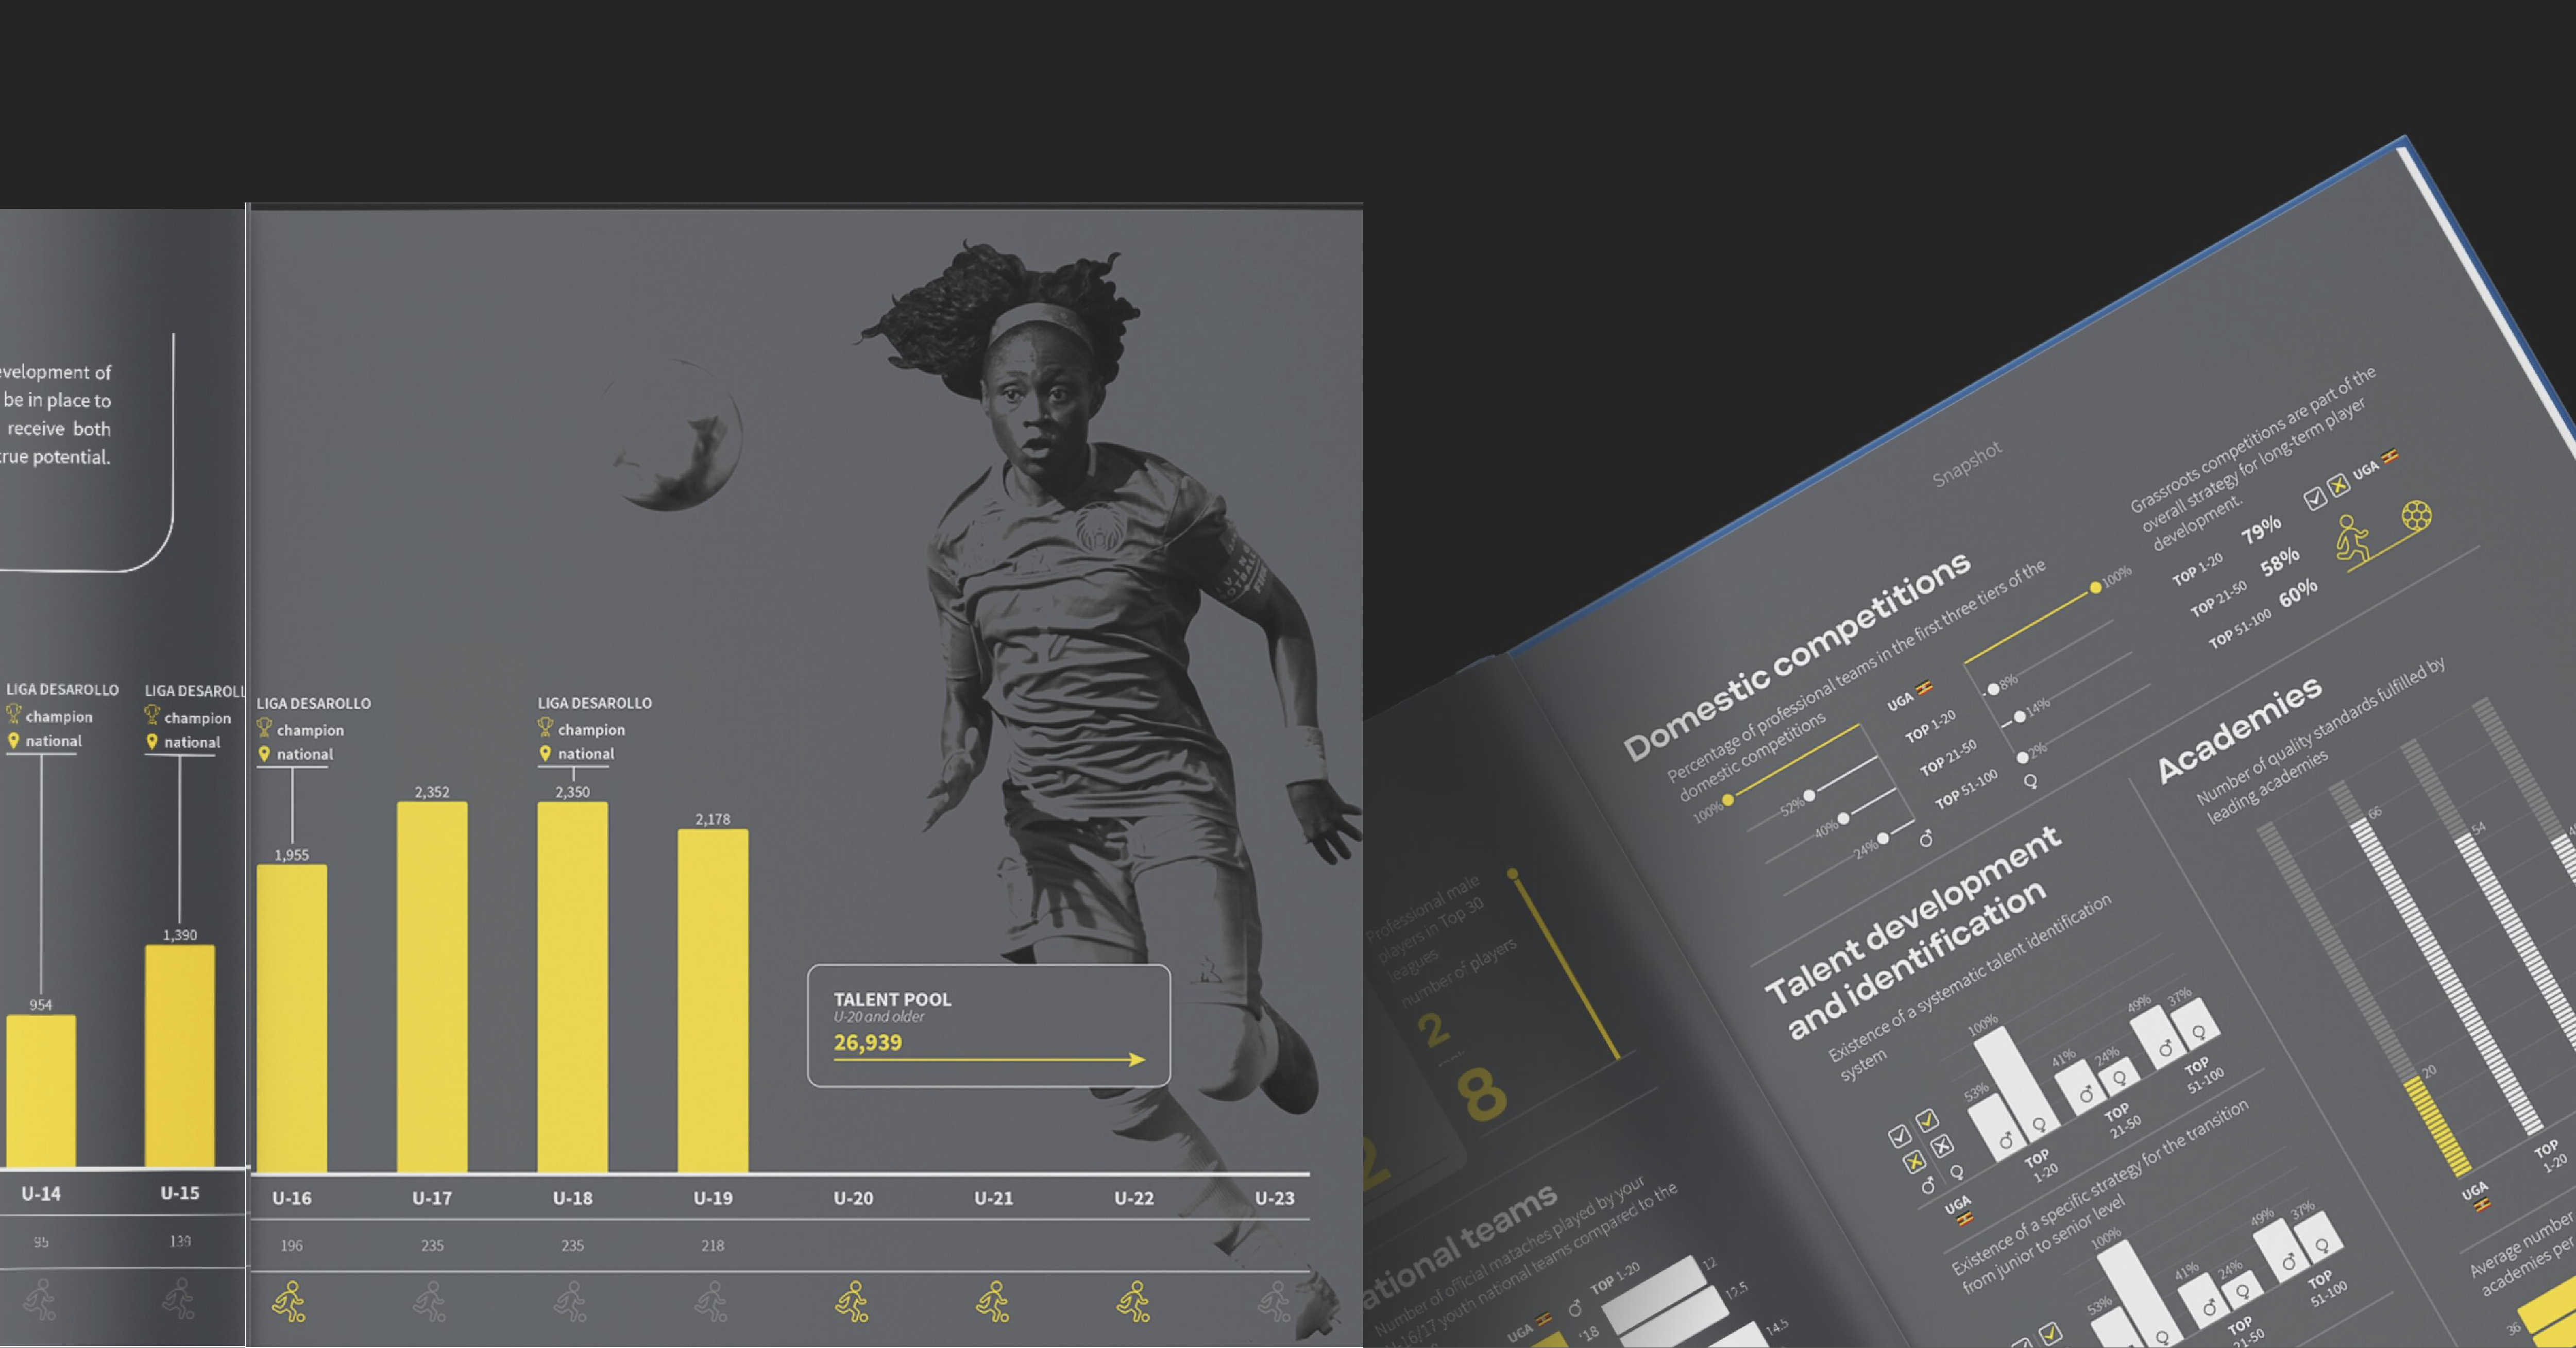
Jaaf Information Design Unleashing the Power of Clarity
Nestled in the Netherlands with its vibrant design scene, Jaaf Information Design stands out as a...