In the fast-paced landscape of financial technology, Belgian fin-tech scale-up POM was on a mission to revolutionize how they delivered monthly customer reports. They aimed to enhance their payment services reporting with visually engaging, on-brand data visualization, and streamline the entire process. POM's objective was clear: deliver insightful reports while saving precious time and resources.
Challenge: the need for elevated reporting
POM simplifies paying invoices using mobile technologies. Its payment solutions help billers to reduce costs, get paid faster, and boost e-invoicing while significantly improving the ease of payment for their end-users. Customers from various sectors, such as utility companies, schools, hospitals, and social & governmental service providers, already use their services.
Eventually, POM was faced with a challenge that resonates across industries: the quest for compelling and customizable reporting.
While they simplified invoice payments through innovative mobile technologies, creating monthly customer reports remained an uphill battle. Their existing approach involved handling raw data formats, needing more finesse and visual appeal their brand stood for. The manual effort invested in this process was time-consuming and presented scalability hurdles.
The manual reporting process is always a resource-intensive endeavor, draining valuable time and prone to human error.
Solution
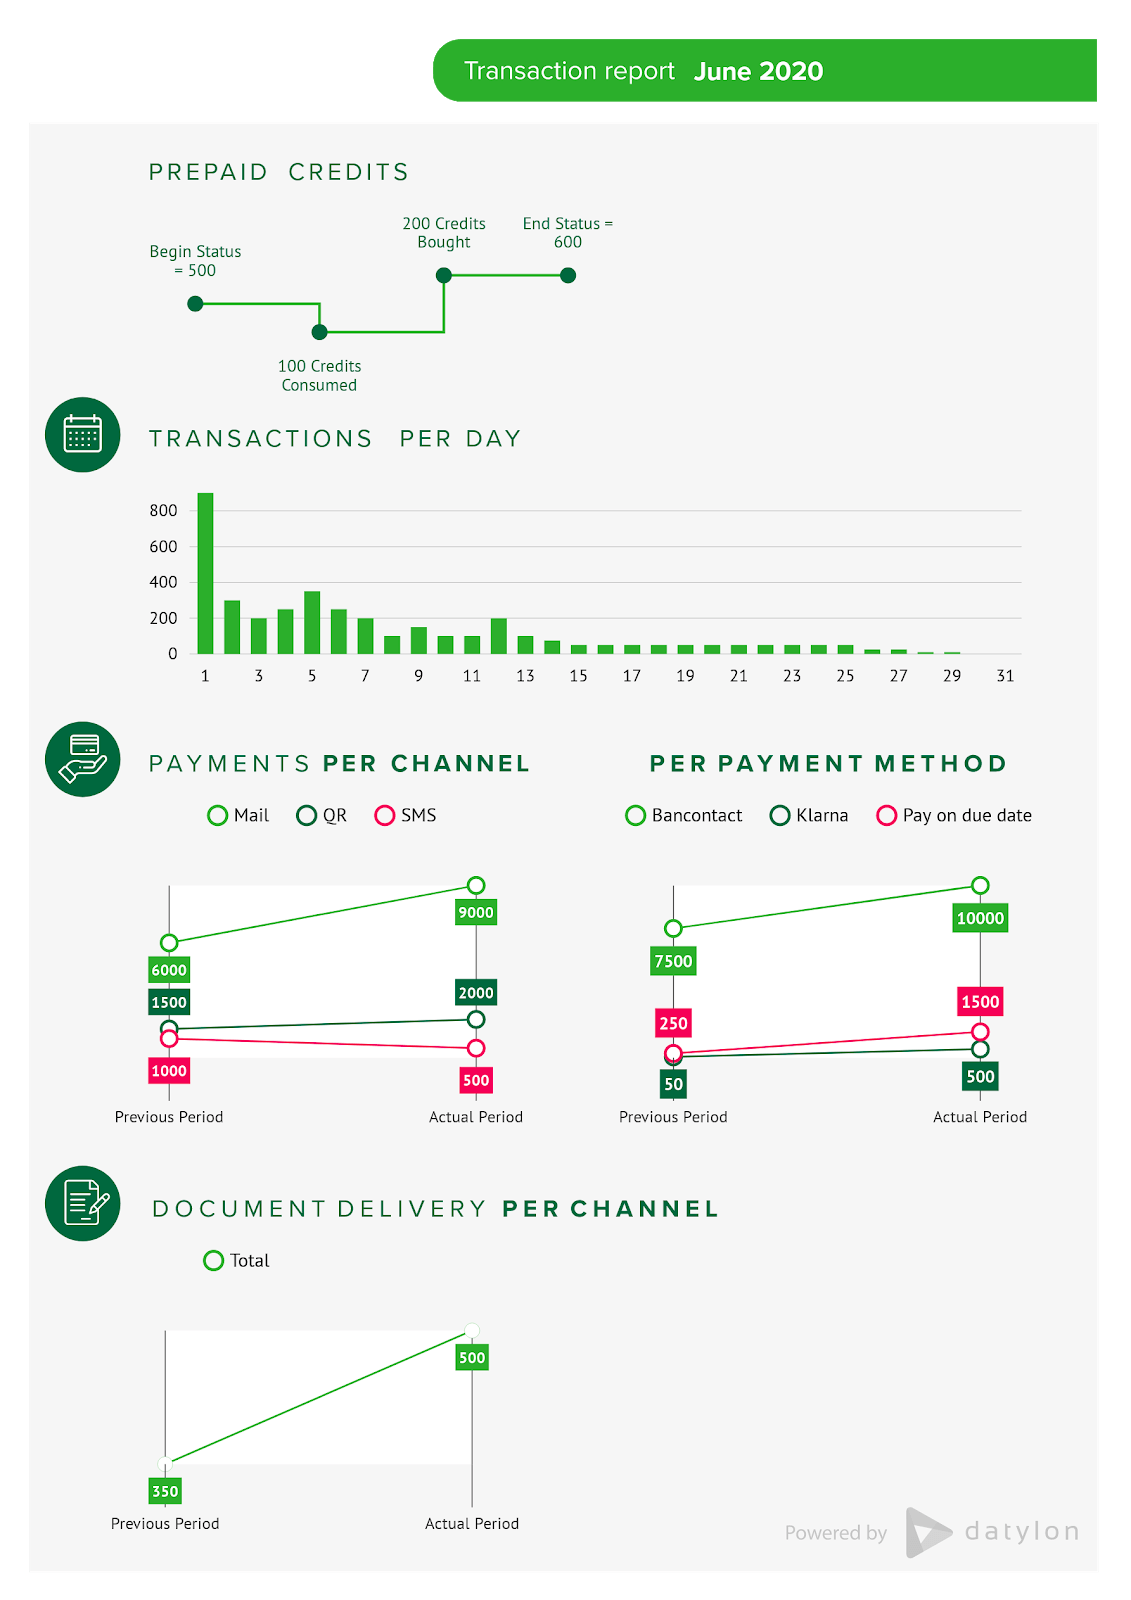
As part of the POM service, each customer who sends POM-enabled invoices receives a monthly personalized one-pager with KPIs and the evolution of these KPIs compared to the previous month. The main KPIs are:
- The daily evolution of the number of successful payment transactions (processed by POM).
- Split view of these payments by channel (QR, email, SMS, …) and by payment method (Bancontact, Payconiq, Visa, Mastercard, etc).
- If payment requests are also delivered via POM (e.g. via email with a payment button): the evolution of the number of documents provided per channel.
- Evolution of the usage of prepaid credits (POM uses a pre-paid system of credits where future transactions are to be bought in advance).
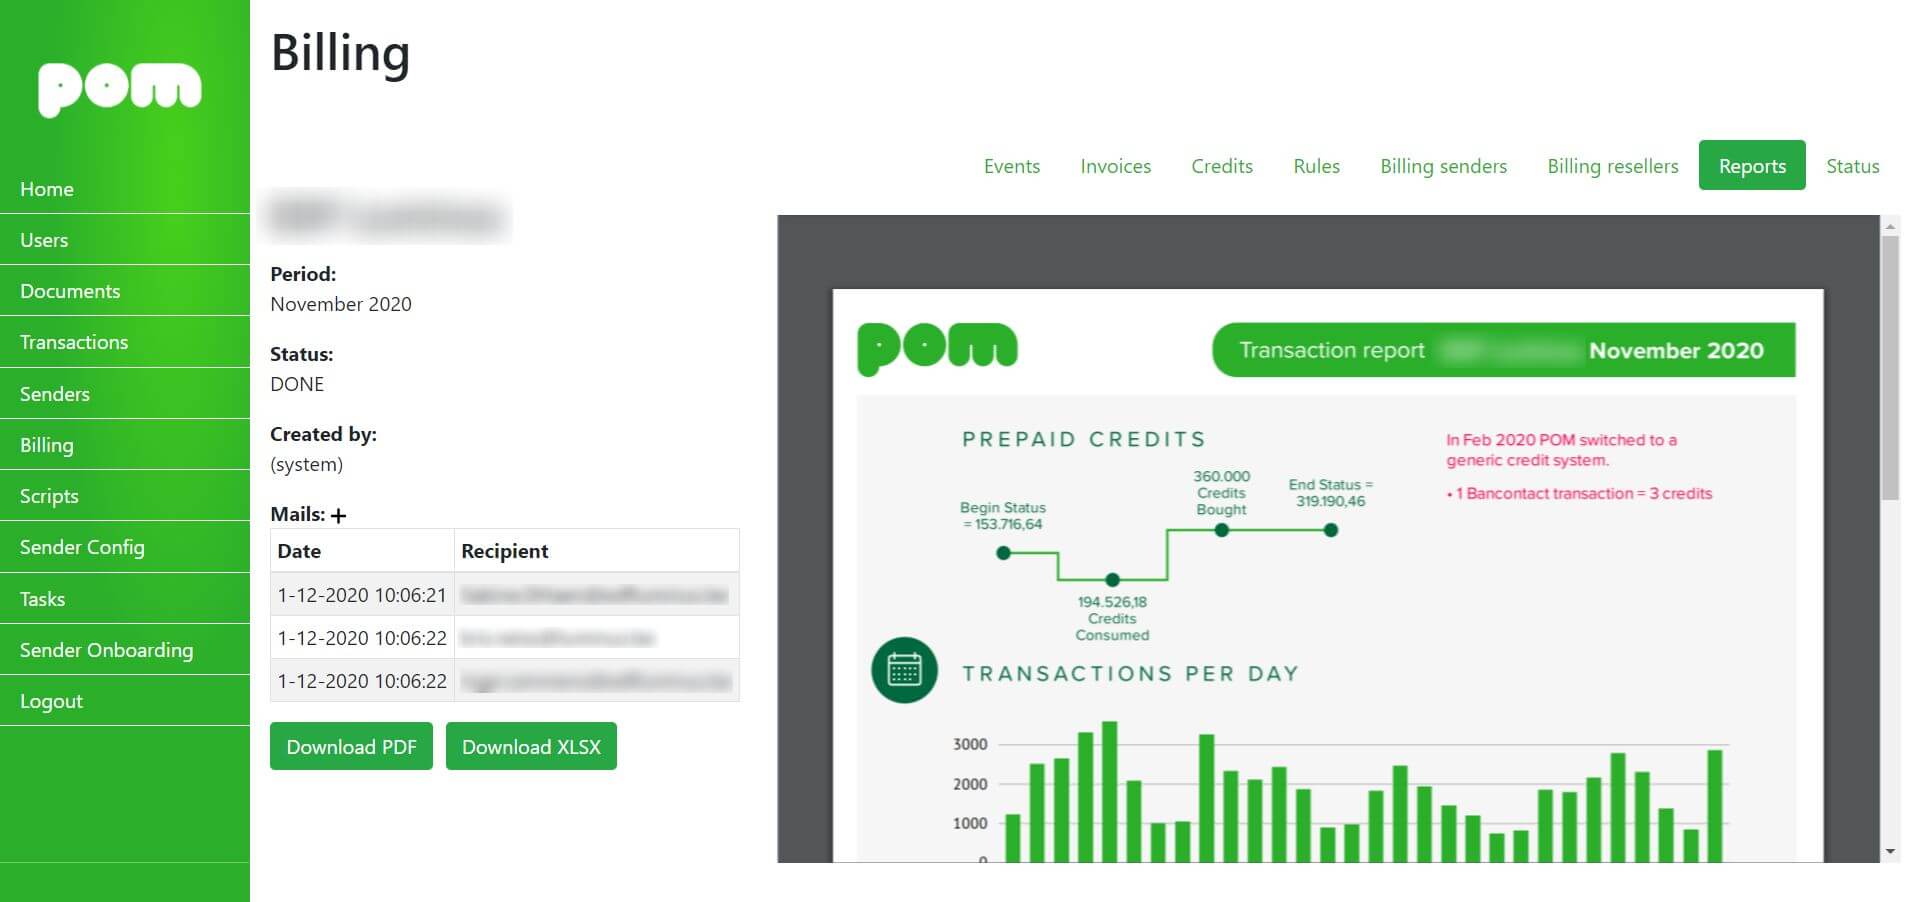
The turning point arrived with Datylon Report Server, POM's chosen solution for embedded reporting within their SaaS application. The transformative power of Datylon Report Server lies in its ability to offer sophisticated automated reporting with unparalleled ease.
The first step in the process was applying Datylon's dataviz expertise to improve the overall design of the report. The report was re-designed using Adobe Illustrator and the Datylon plug-in for Illustrator.
The new report design template was then exported to the Datylon Report Studio to facilitate automation. Each month, a POM batch process collects the raw KPI data per customer and passes the workbook to the Datylon Report Server via the API requesting a PDF version of the re-rendered template. The resulting PDF is mailed automatically to the customer.
For each customer, POM determines the appropriate report template (several versions are available for several customer groups). Such a specific report template applies, for example, to the free payment services that POM offers to schools in Belgium. The transaction fees are covered by advertising partnerships with Payconiq and Luminus. Therefore, the reporting template for schools includes banner ads for these partners.
Via POM’s back-end configuration tool, the recipients can be defined and one or multiple recipients can be added.
Cost- and time-effectiveness
By choosing Datylon's solution, POM sidestepped the need to invest in in-house development and design efforts. This translated to substantial cost savings and, even more crucially, remarkable time savings. POM's resources were no longer tied up in laborious report creation; instead, they were redirected toward activities that truly mattered.
Seamless integration
The effectiveness of Datylon Report Server lies in its ability to seamlessly integrate through APIs.
For POM, this ensured a seamless connection with their existing systems. This integration merged the power of Datylon's reporting capabilities with POM's operations, effortlessly enhancing their service's functionality.
Elevating data storytelling
The Datylon-powered solution brought forth a myriad of benefits that amplified POM's customer reporting service:
- Effortless data communication: POM's data, once confined to spreadsheets, blossomed into comprehensive visual narratives. The visualized reports facilitated data storytelling, enabling customers to intuitively understand their payment service usage.
- On-brand data visualization: Datylon Report Server allowed POM to create visually stunning reports, aligning them perfectly with their brand guidelines and establishing visual consistency.
- Enhanced customer experience: With automated, visually captivating reports, POM's customers were treated to an unparalleled experience. Insights that once demanded effort to decipher were now presented at a glance, empowering customers with actionable insights.
Transformative partnership
Johannes Vermeire, CEO and co-founder of POM is very happy with the automated reporting solution provided by Datylon:
"Thanks to the cooperation with Datylon, we are now sending visually appealing and insightful reports to our customers in a fully automated way. This is a big step forward in the way we provide data insights to our customers about their usage of POM’s services."
As POM's journey illustrates, companies like yours can leverage Datylon's embedded reporting solution to not only elevate their application's value but also enhance data communication.
Contact us for a free demo and discover how Datylon can elevate your premium reporting needs, just like it did for POM. Your journey towards streamlined, insightful reporting starts here.