CHARTS & GRAPHS > LINE GRAPHS

Line graph maker

Create and share your own line graph and customize it to your liking with our free online line graph maker.

Free online line graph maker - Create and share your own line graph (line chart) - no coding skills needed!

Free online line graph maker, no credit card needed.

Make a fully customizable and reusable line graph.

Keep your line graph design private or public.

Unlimited designs and no limit of online views.

Trusted by companies worldwide

Datylon Line Graph Maker is used and trusted by many organizations, such as Port of Antwerp
Datylon Line Graph Maker is used and trusted by many organizations, such as POM
Datylon Line Graph Maker is used and trusted by many organizations, such as Survey Anyplace
Datylon Line Graph Maker is used and trusted by many organizations, such as Proximus
Datylon Line Graph Maker is used and trusted by many organizations, such as CMC
Datylon Line Graph Maker is used and trusted by many organizations, such as NATO
Fully customize your line chart design with our line graph maker
STYLING PROPERTIES

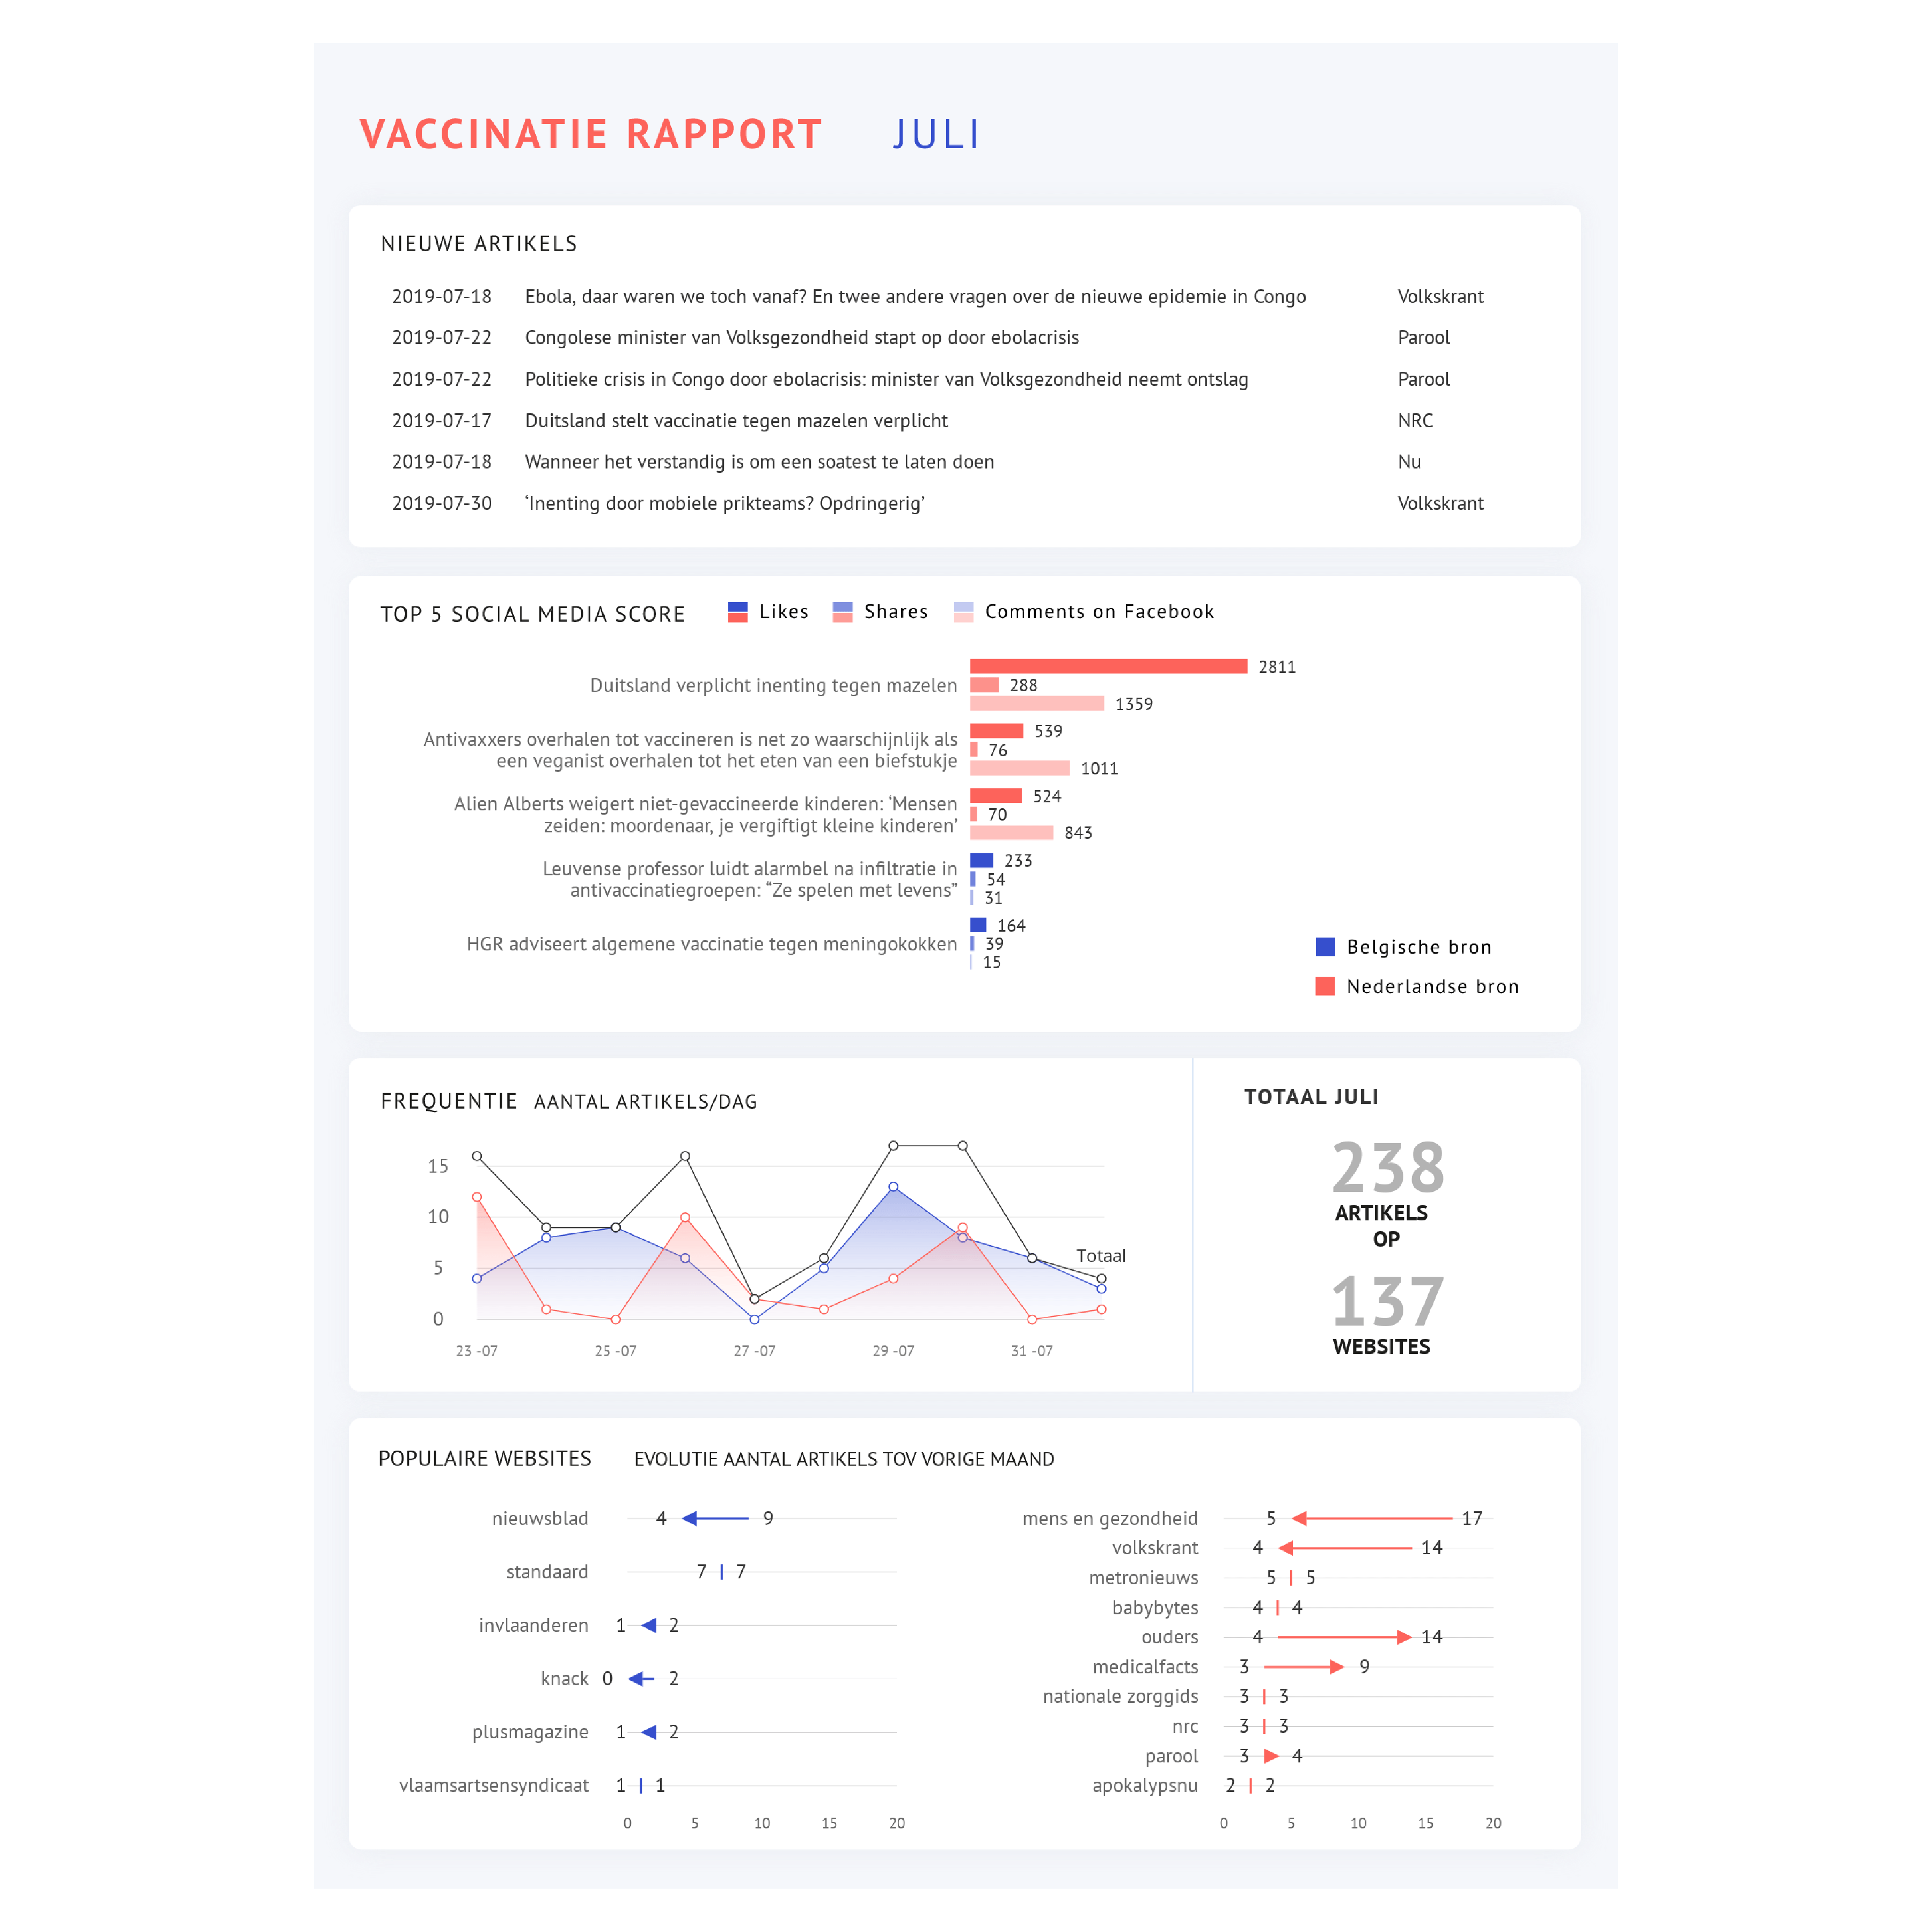
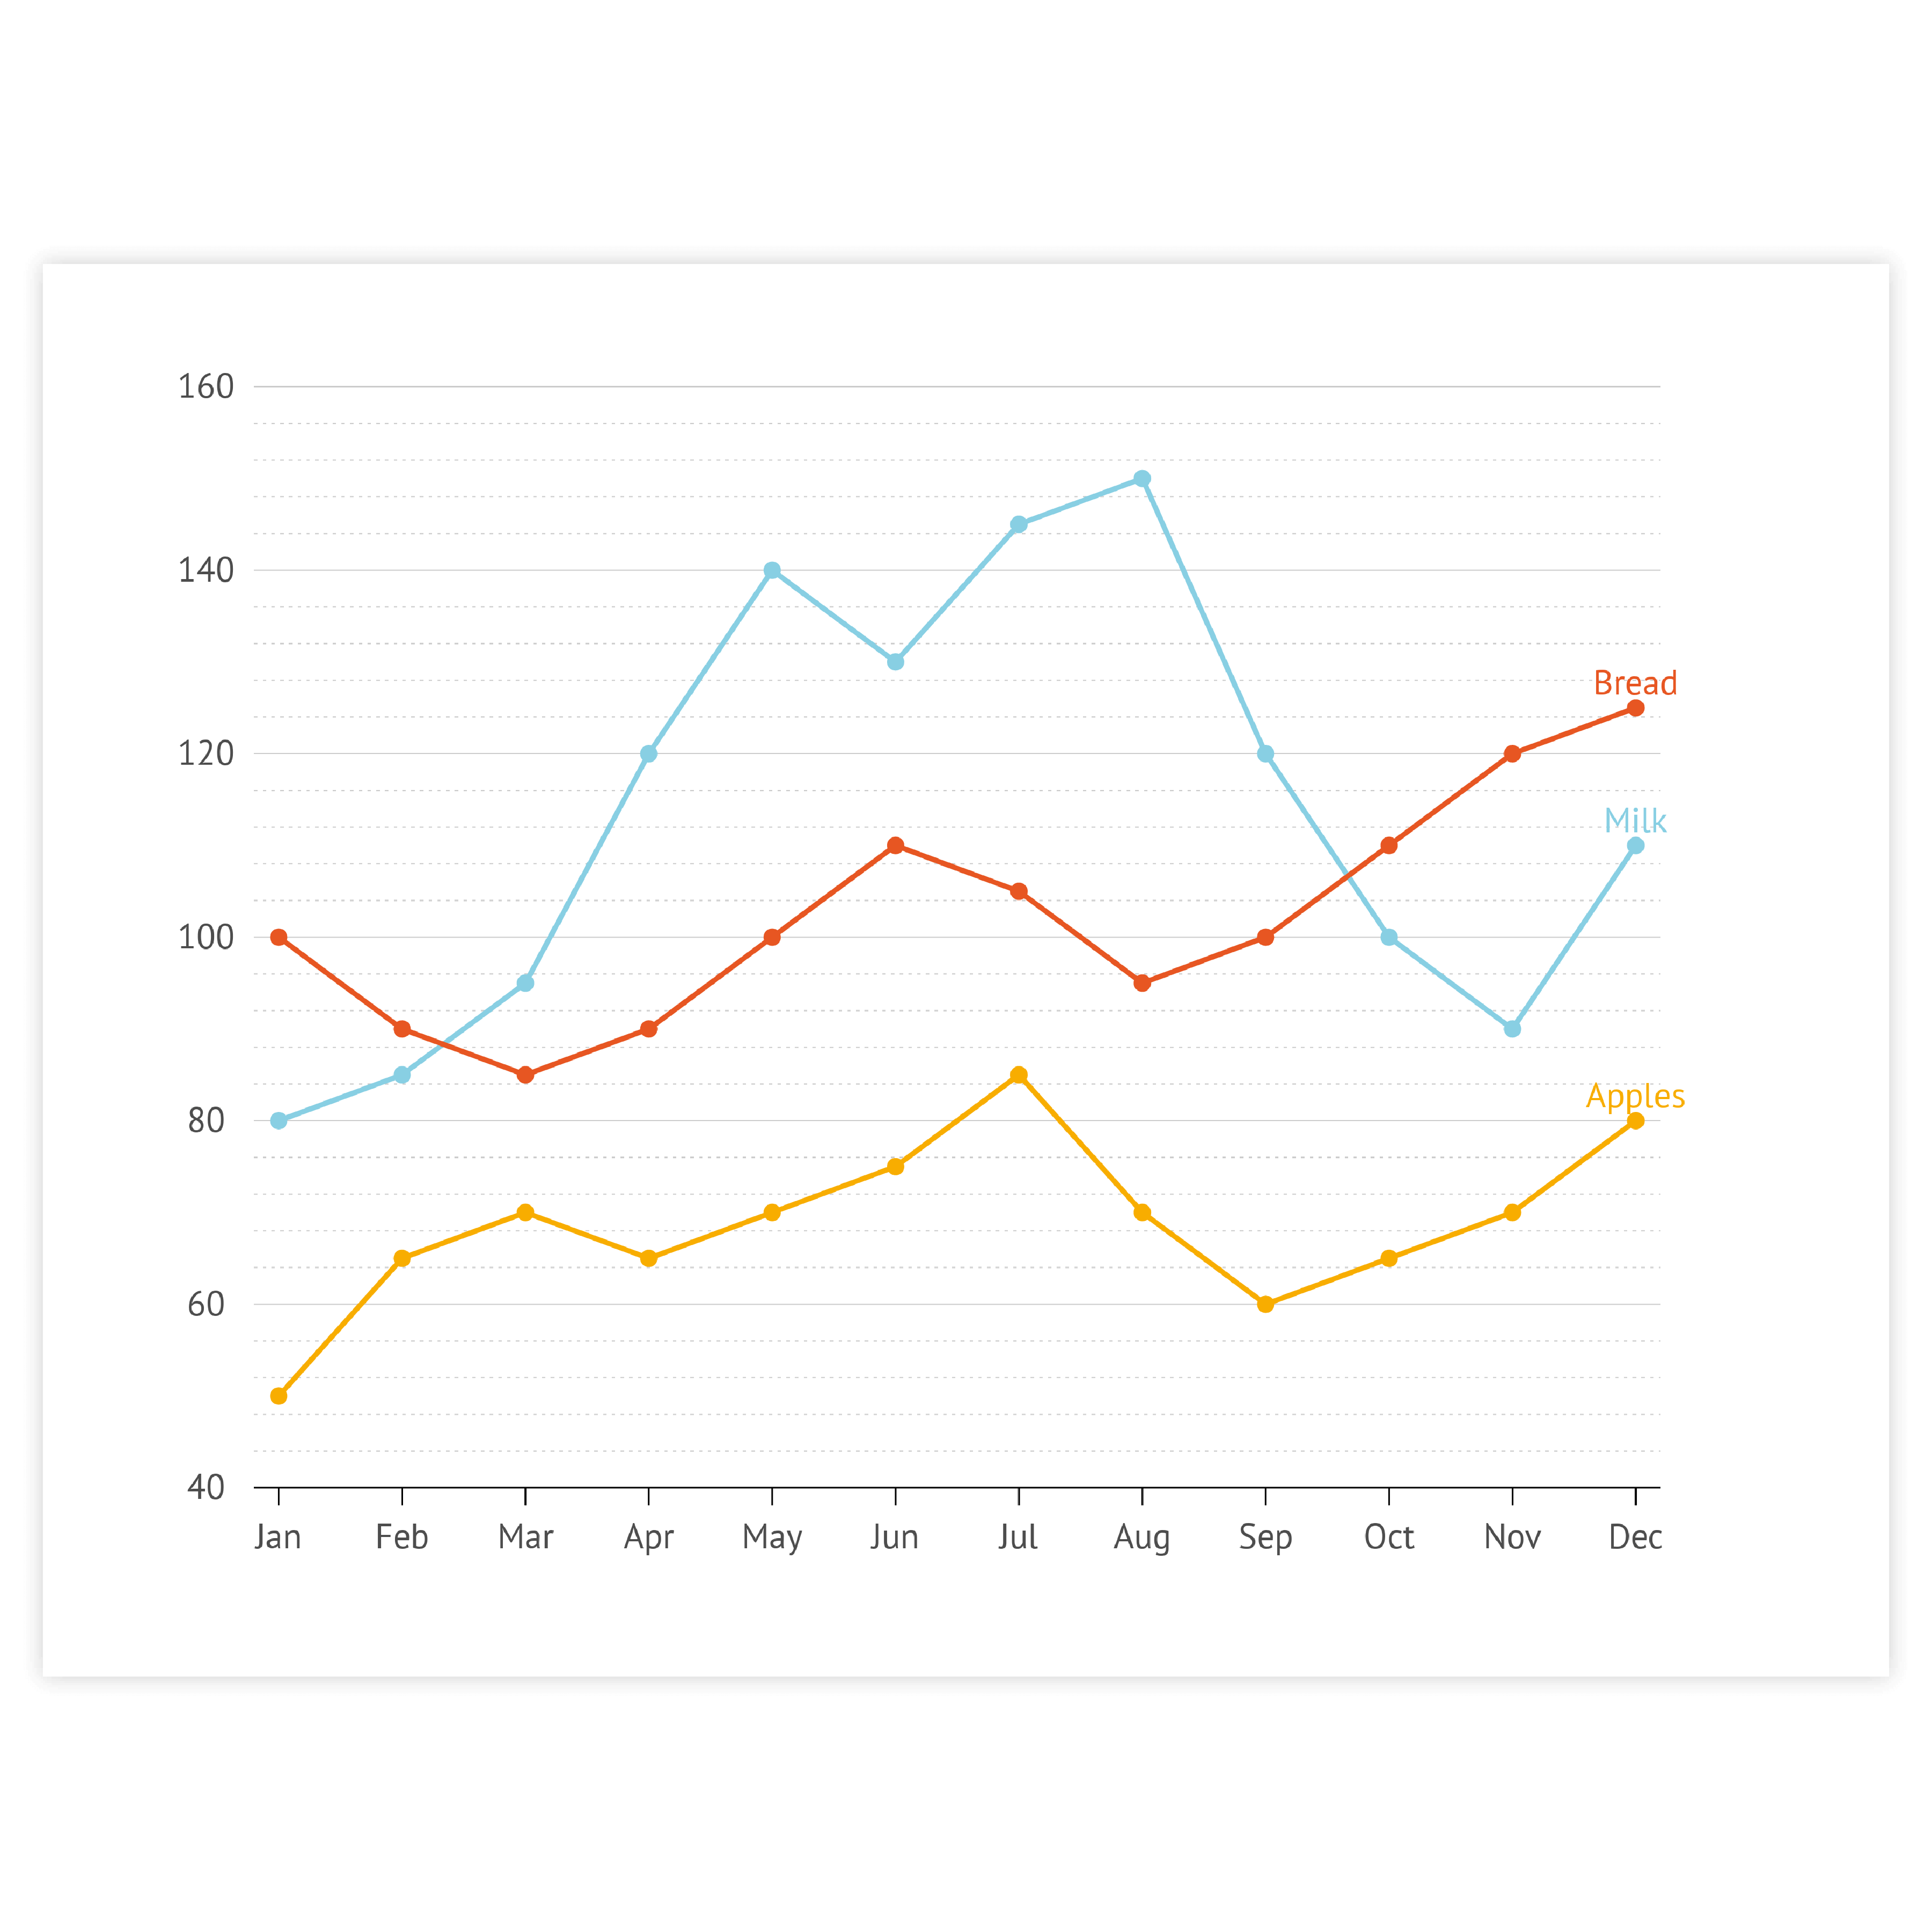
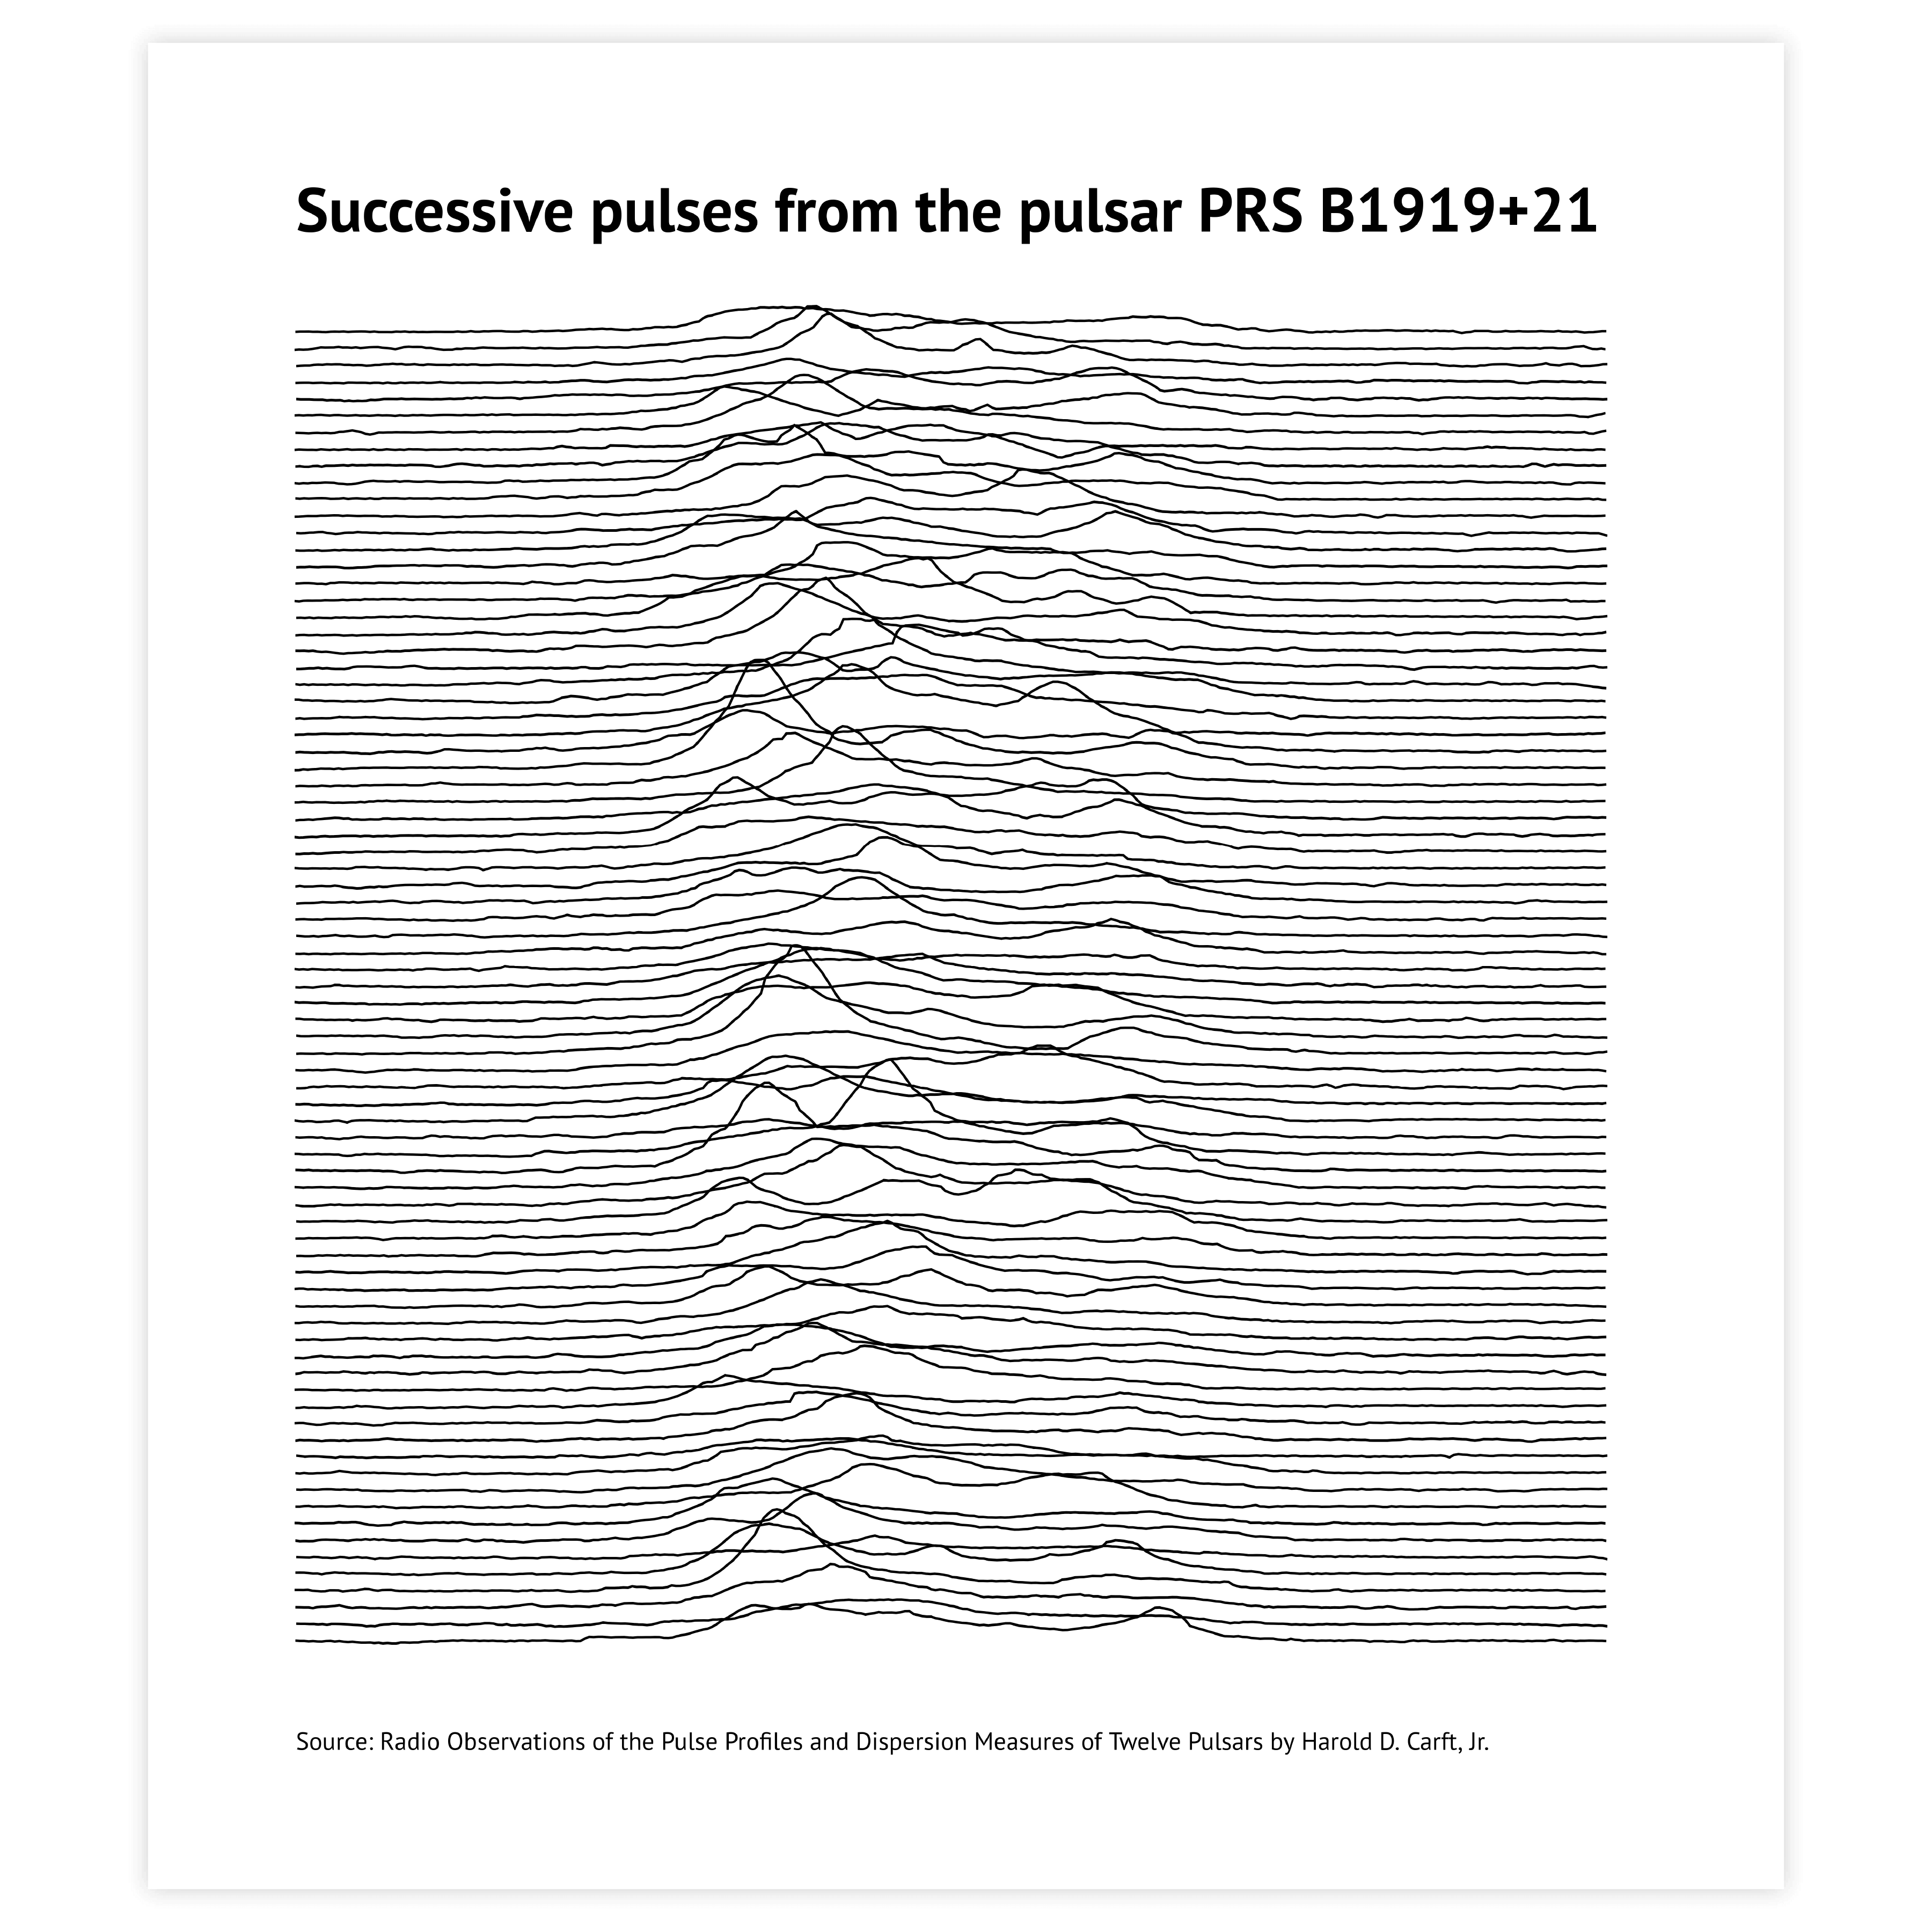
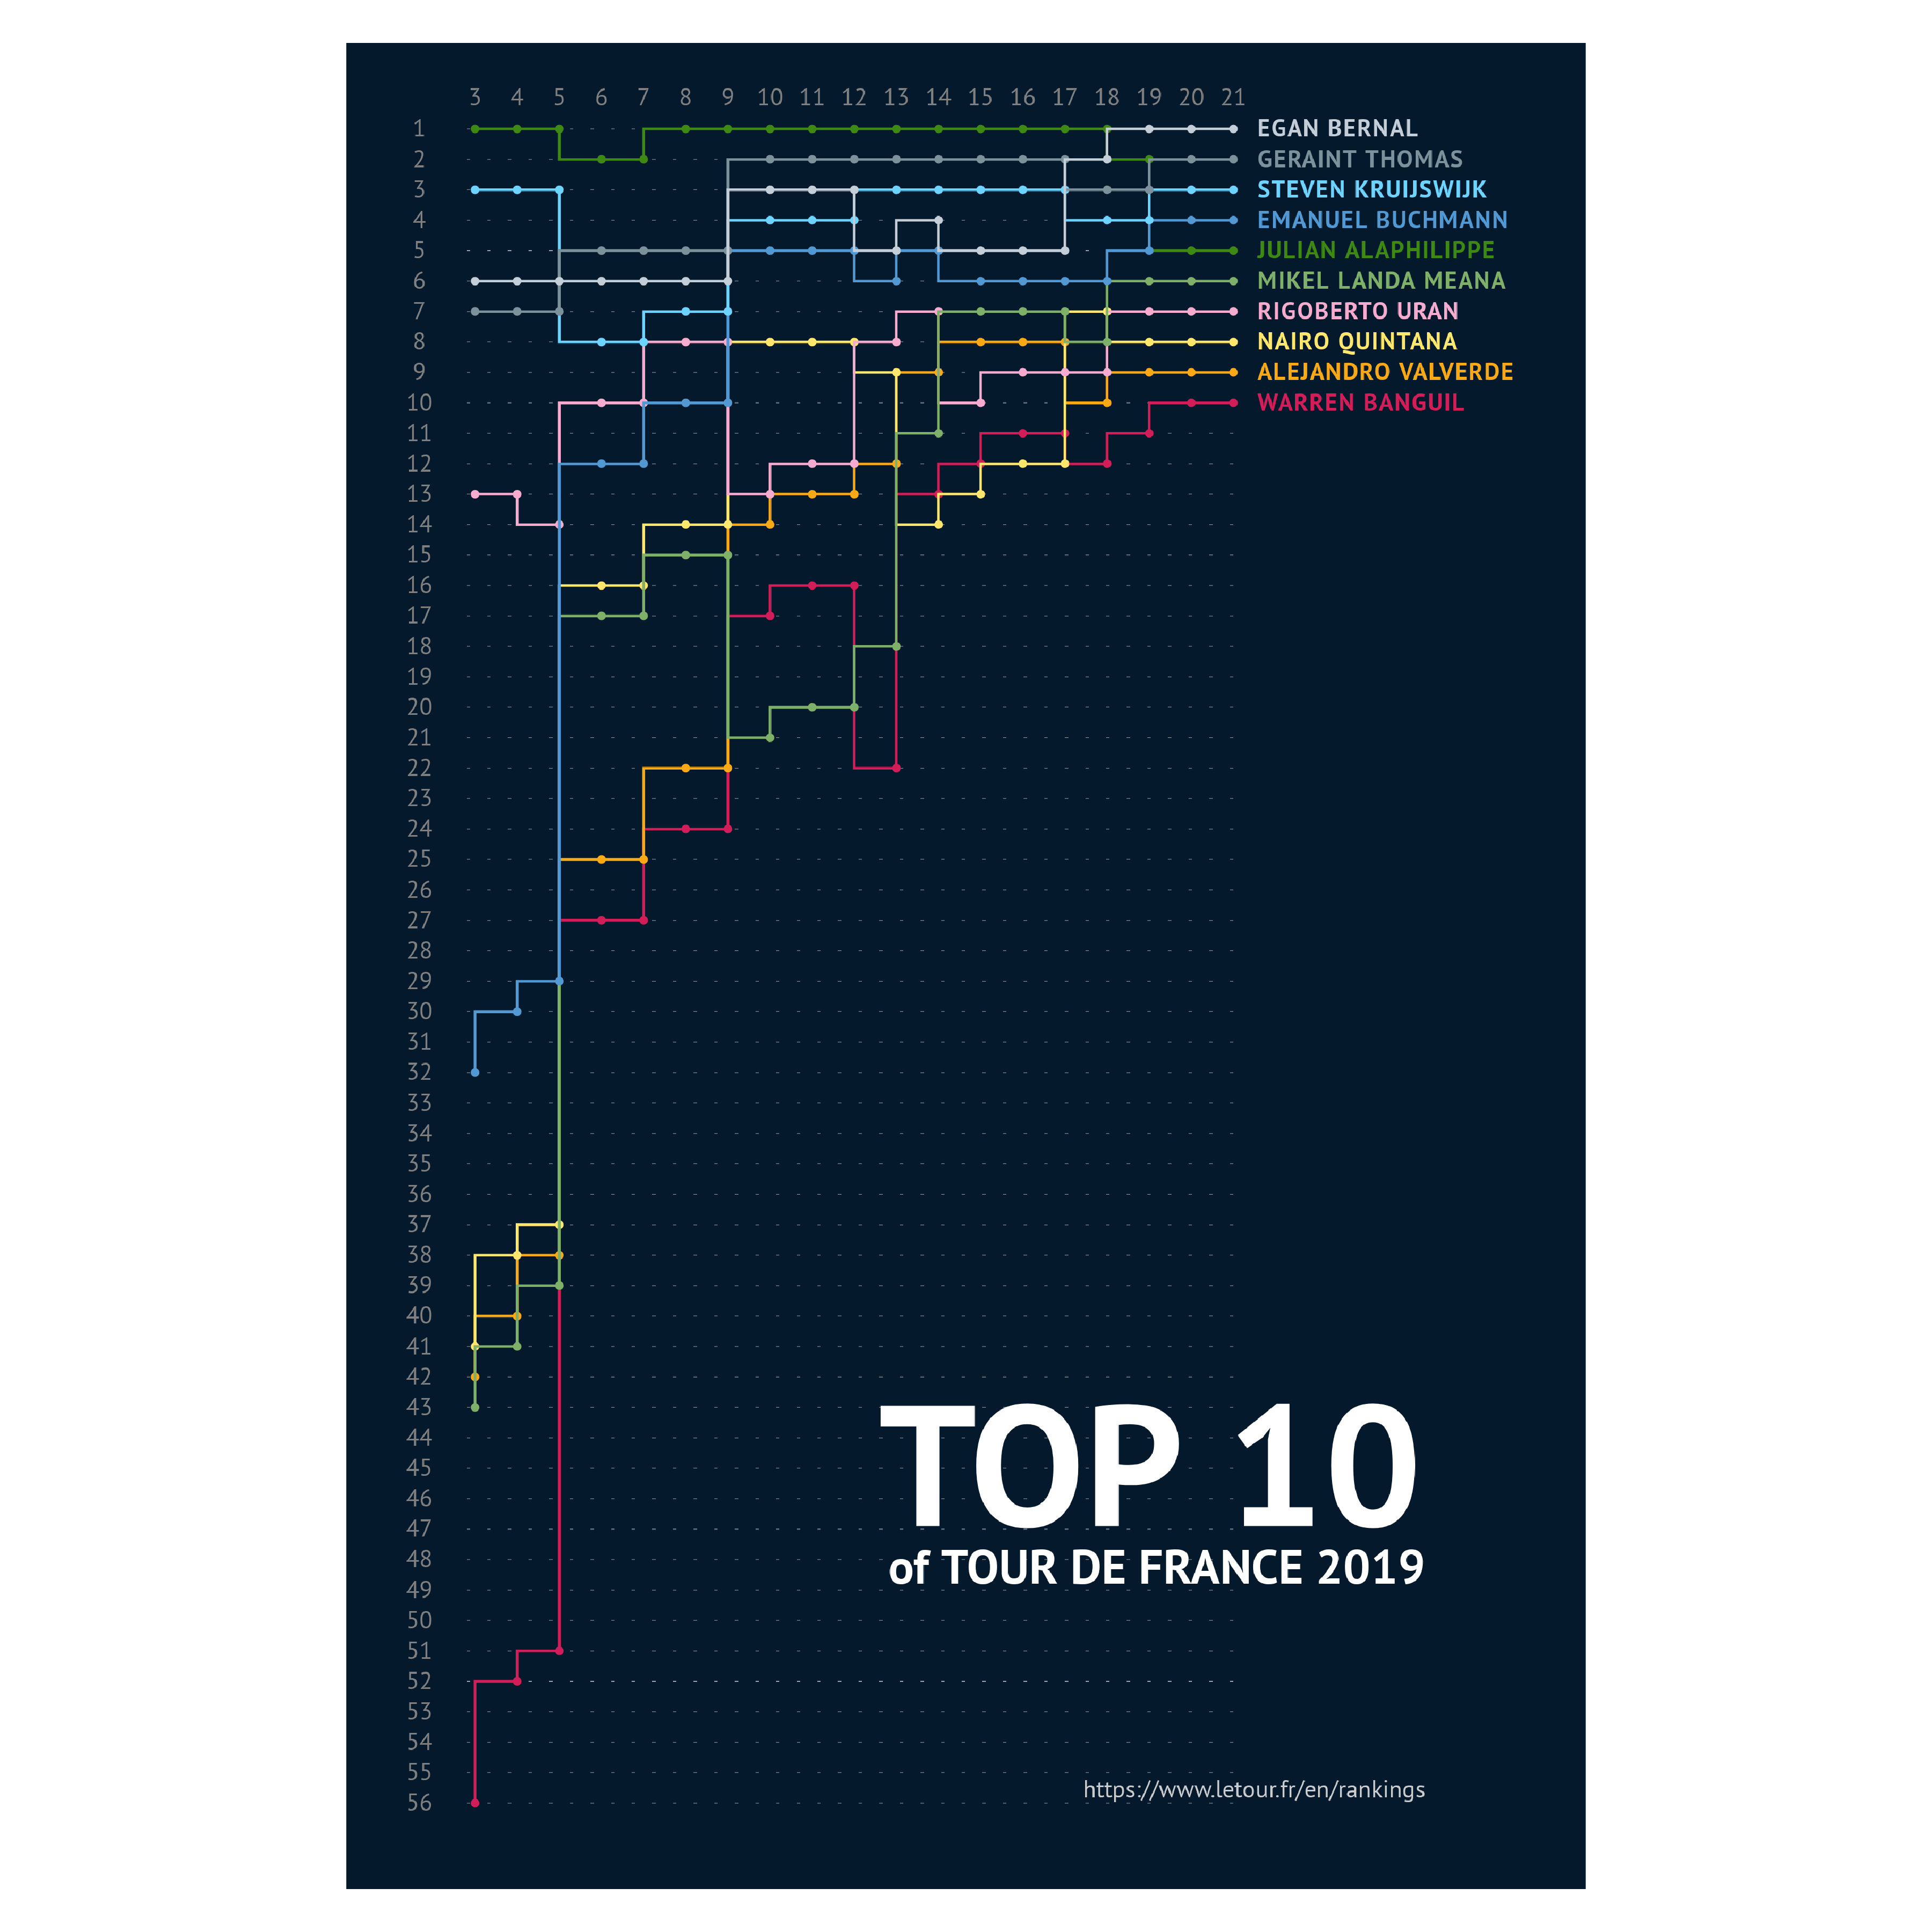
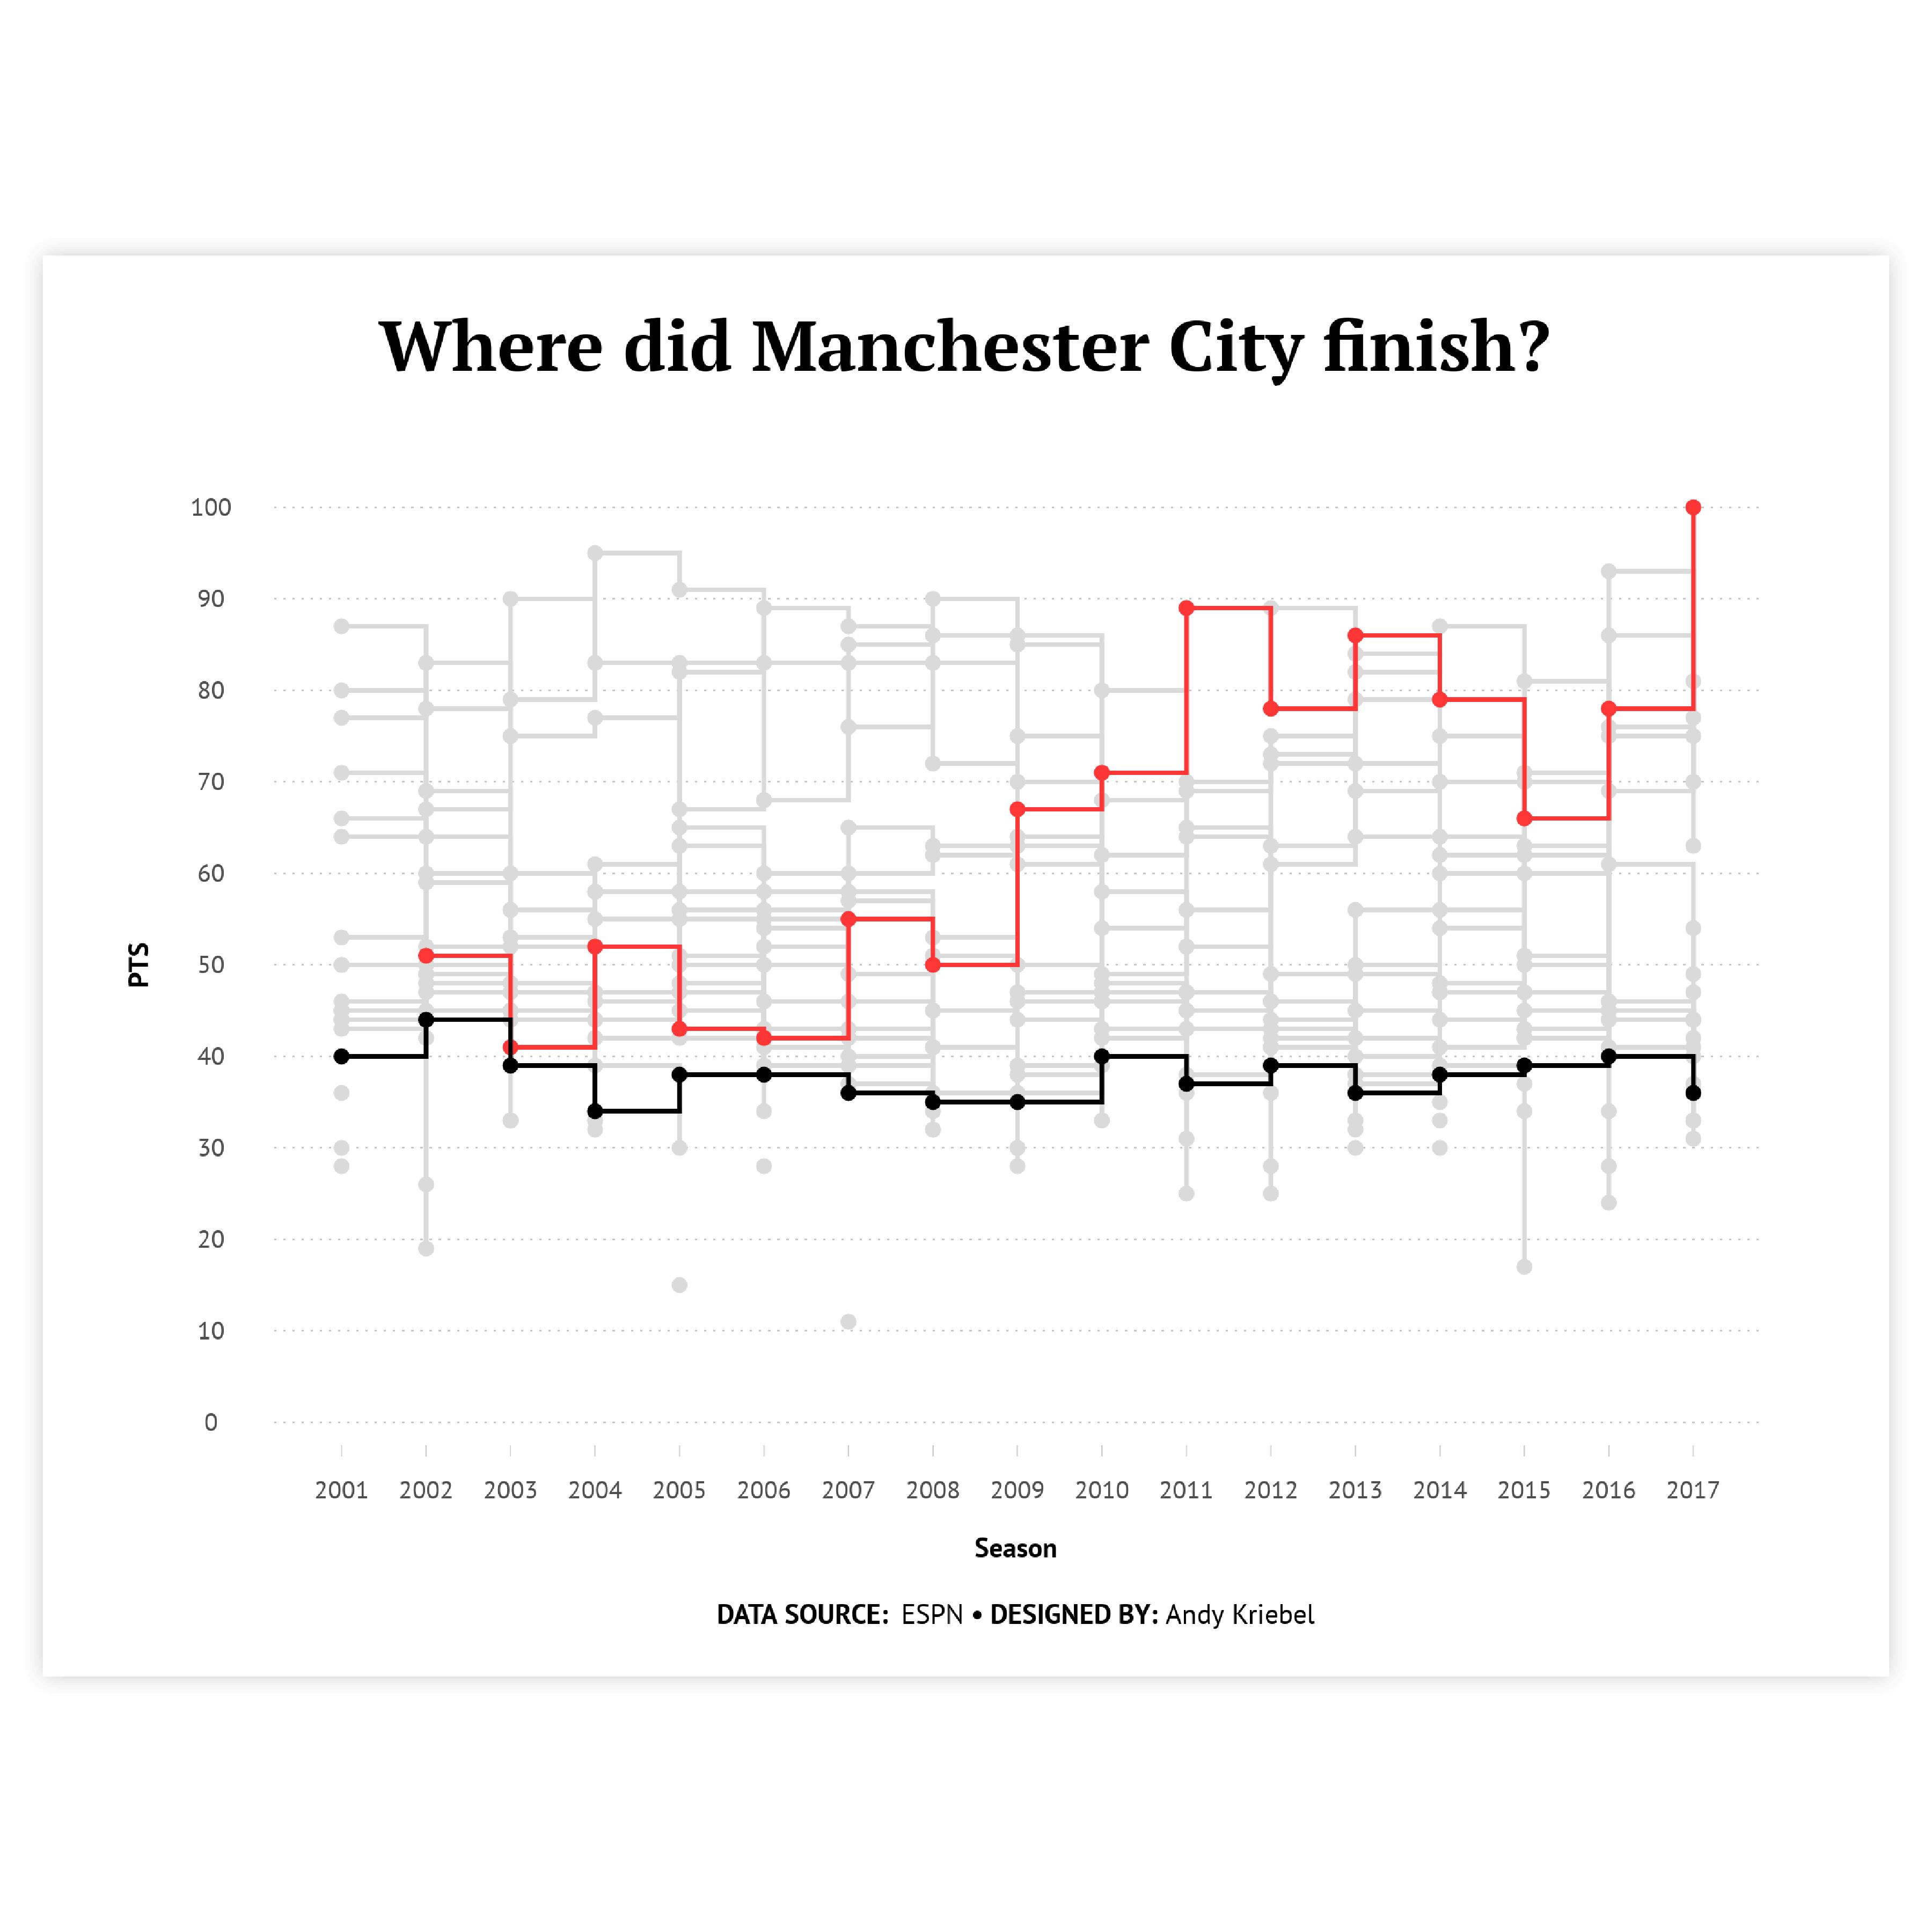
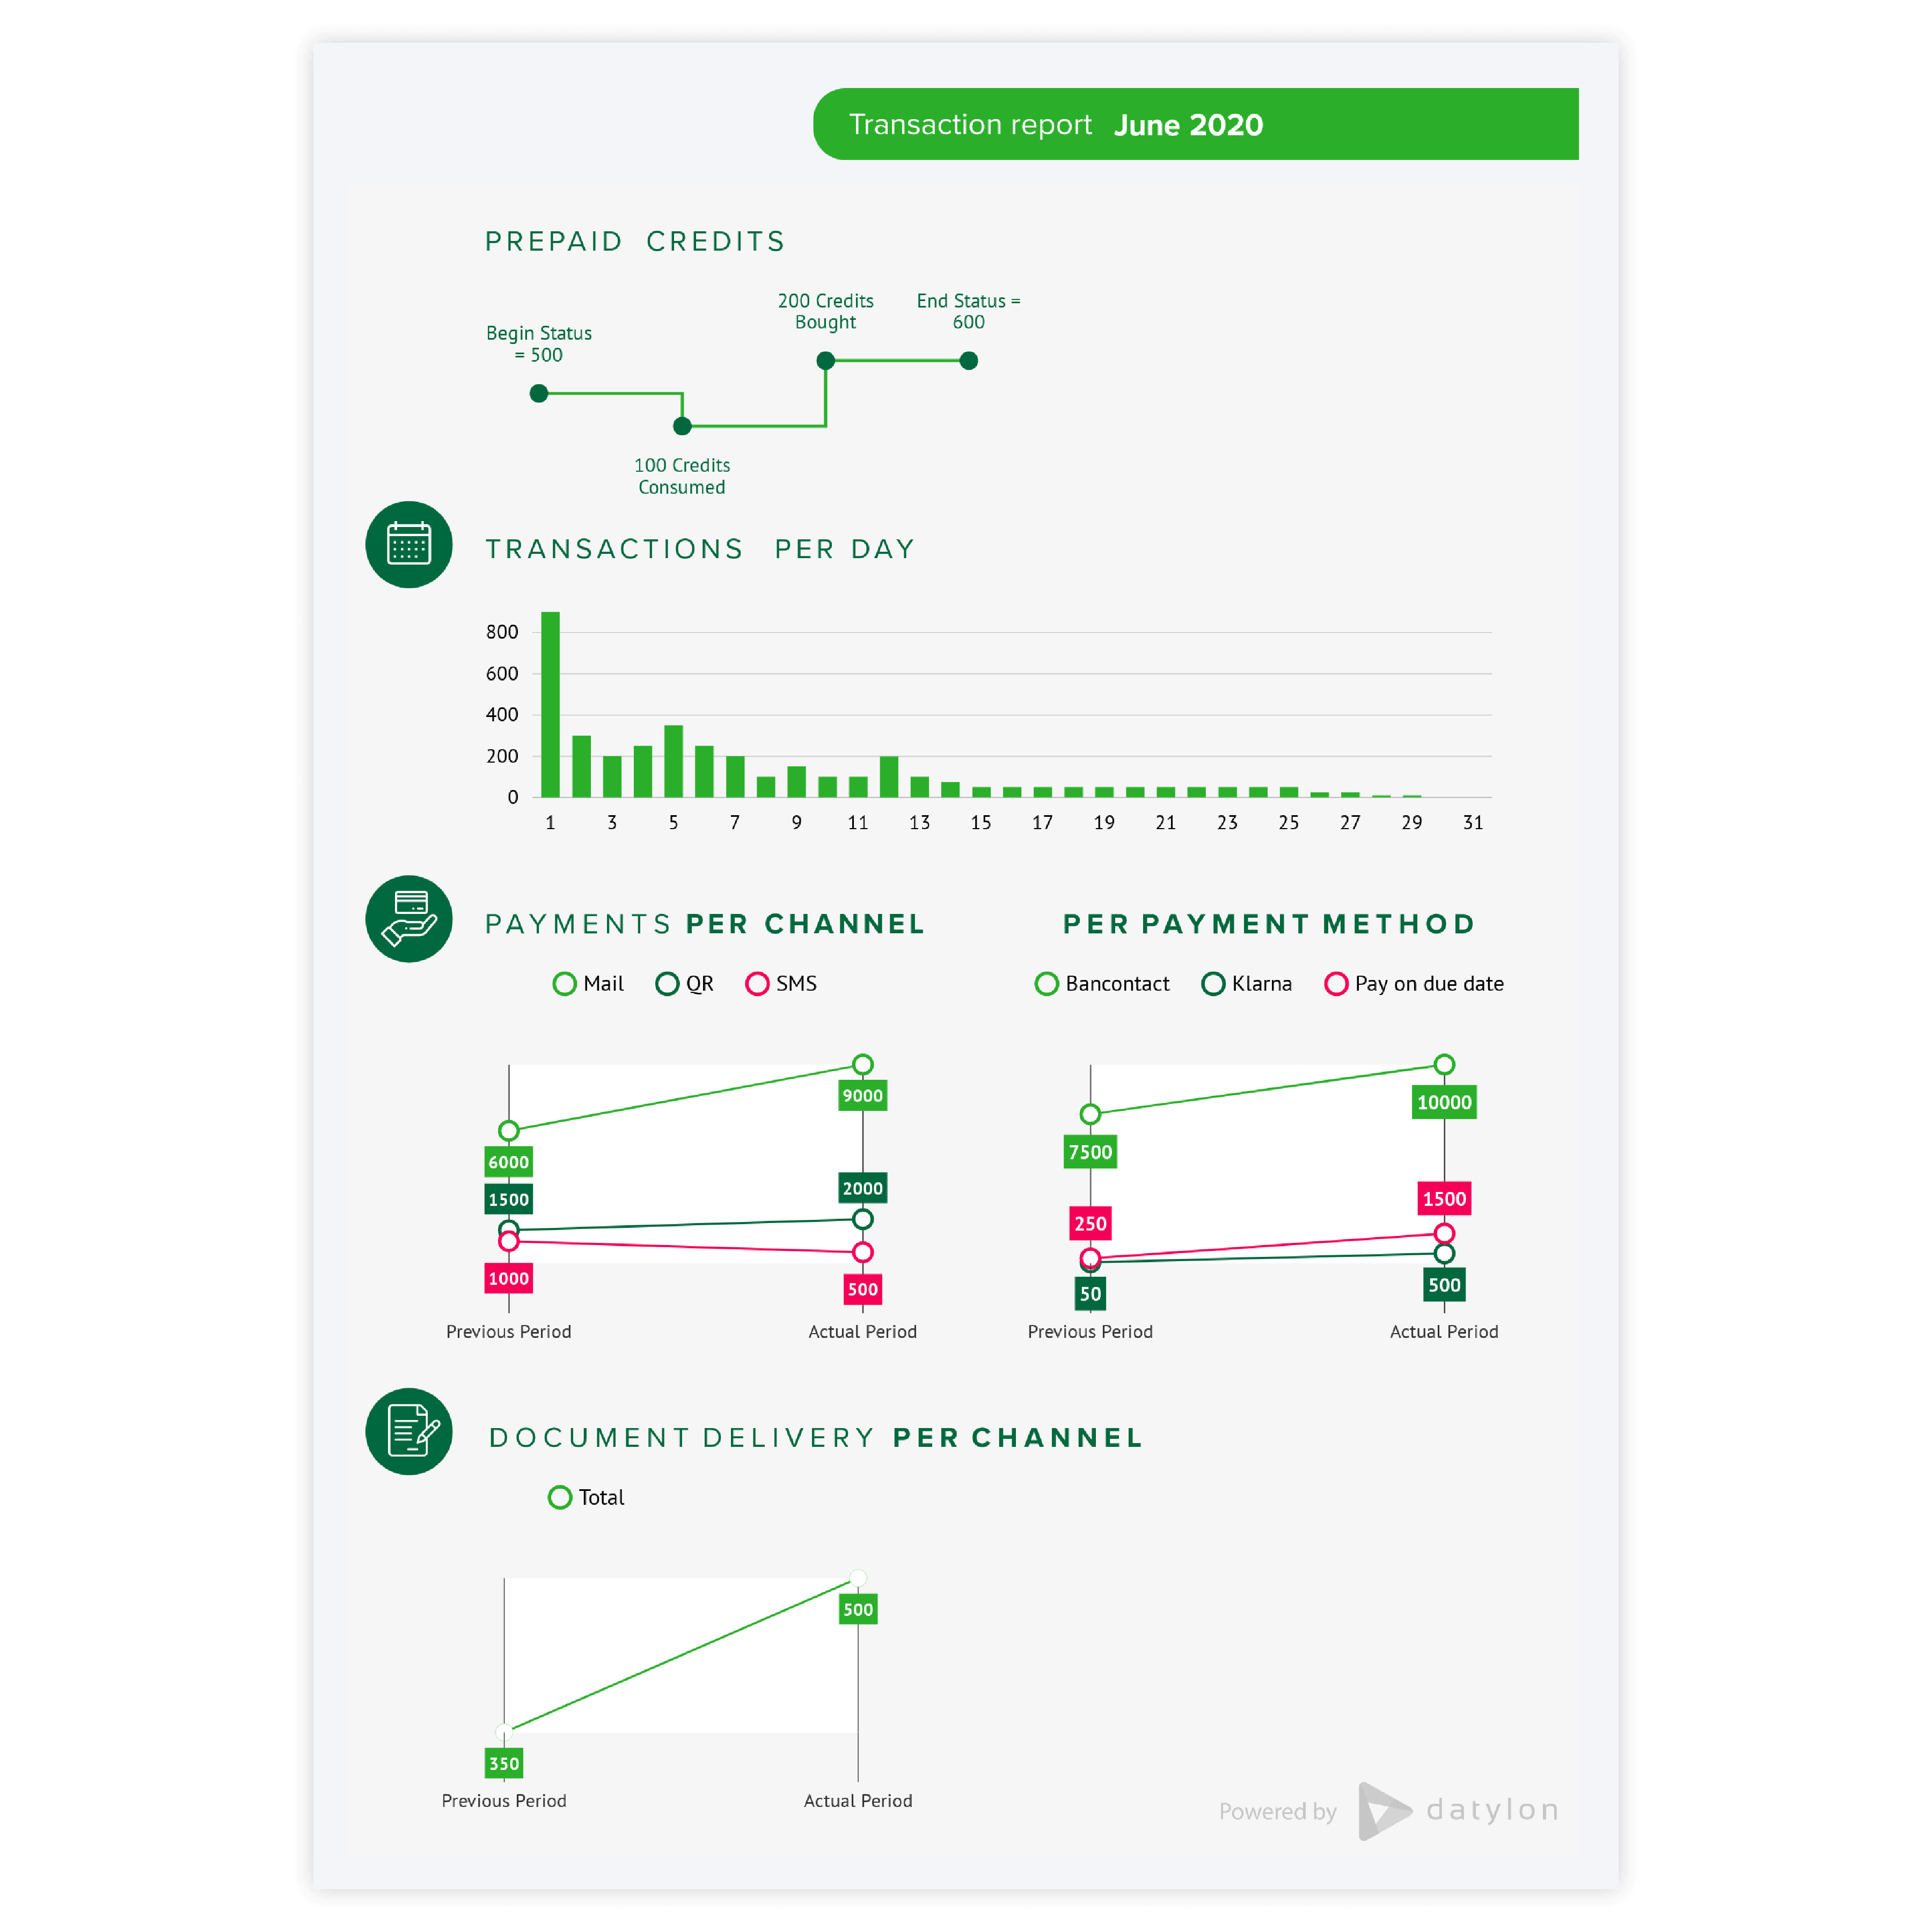
Fully customizable line graph

All elements in your line graph such as labels, data marks, and axes can be styled to the smallest graphic detail matching the most demanding design requirements. Background, rounded corner, stroke width, position, alignment: all tools are at hand to unleash your creativity and get the message of the line graph across.

Make your own custom line graph
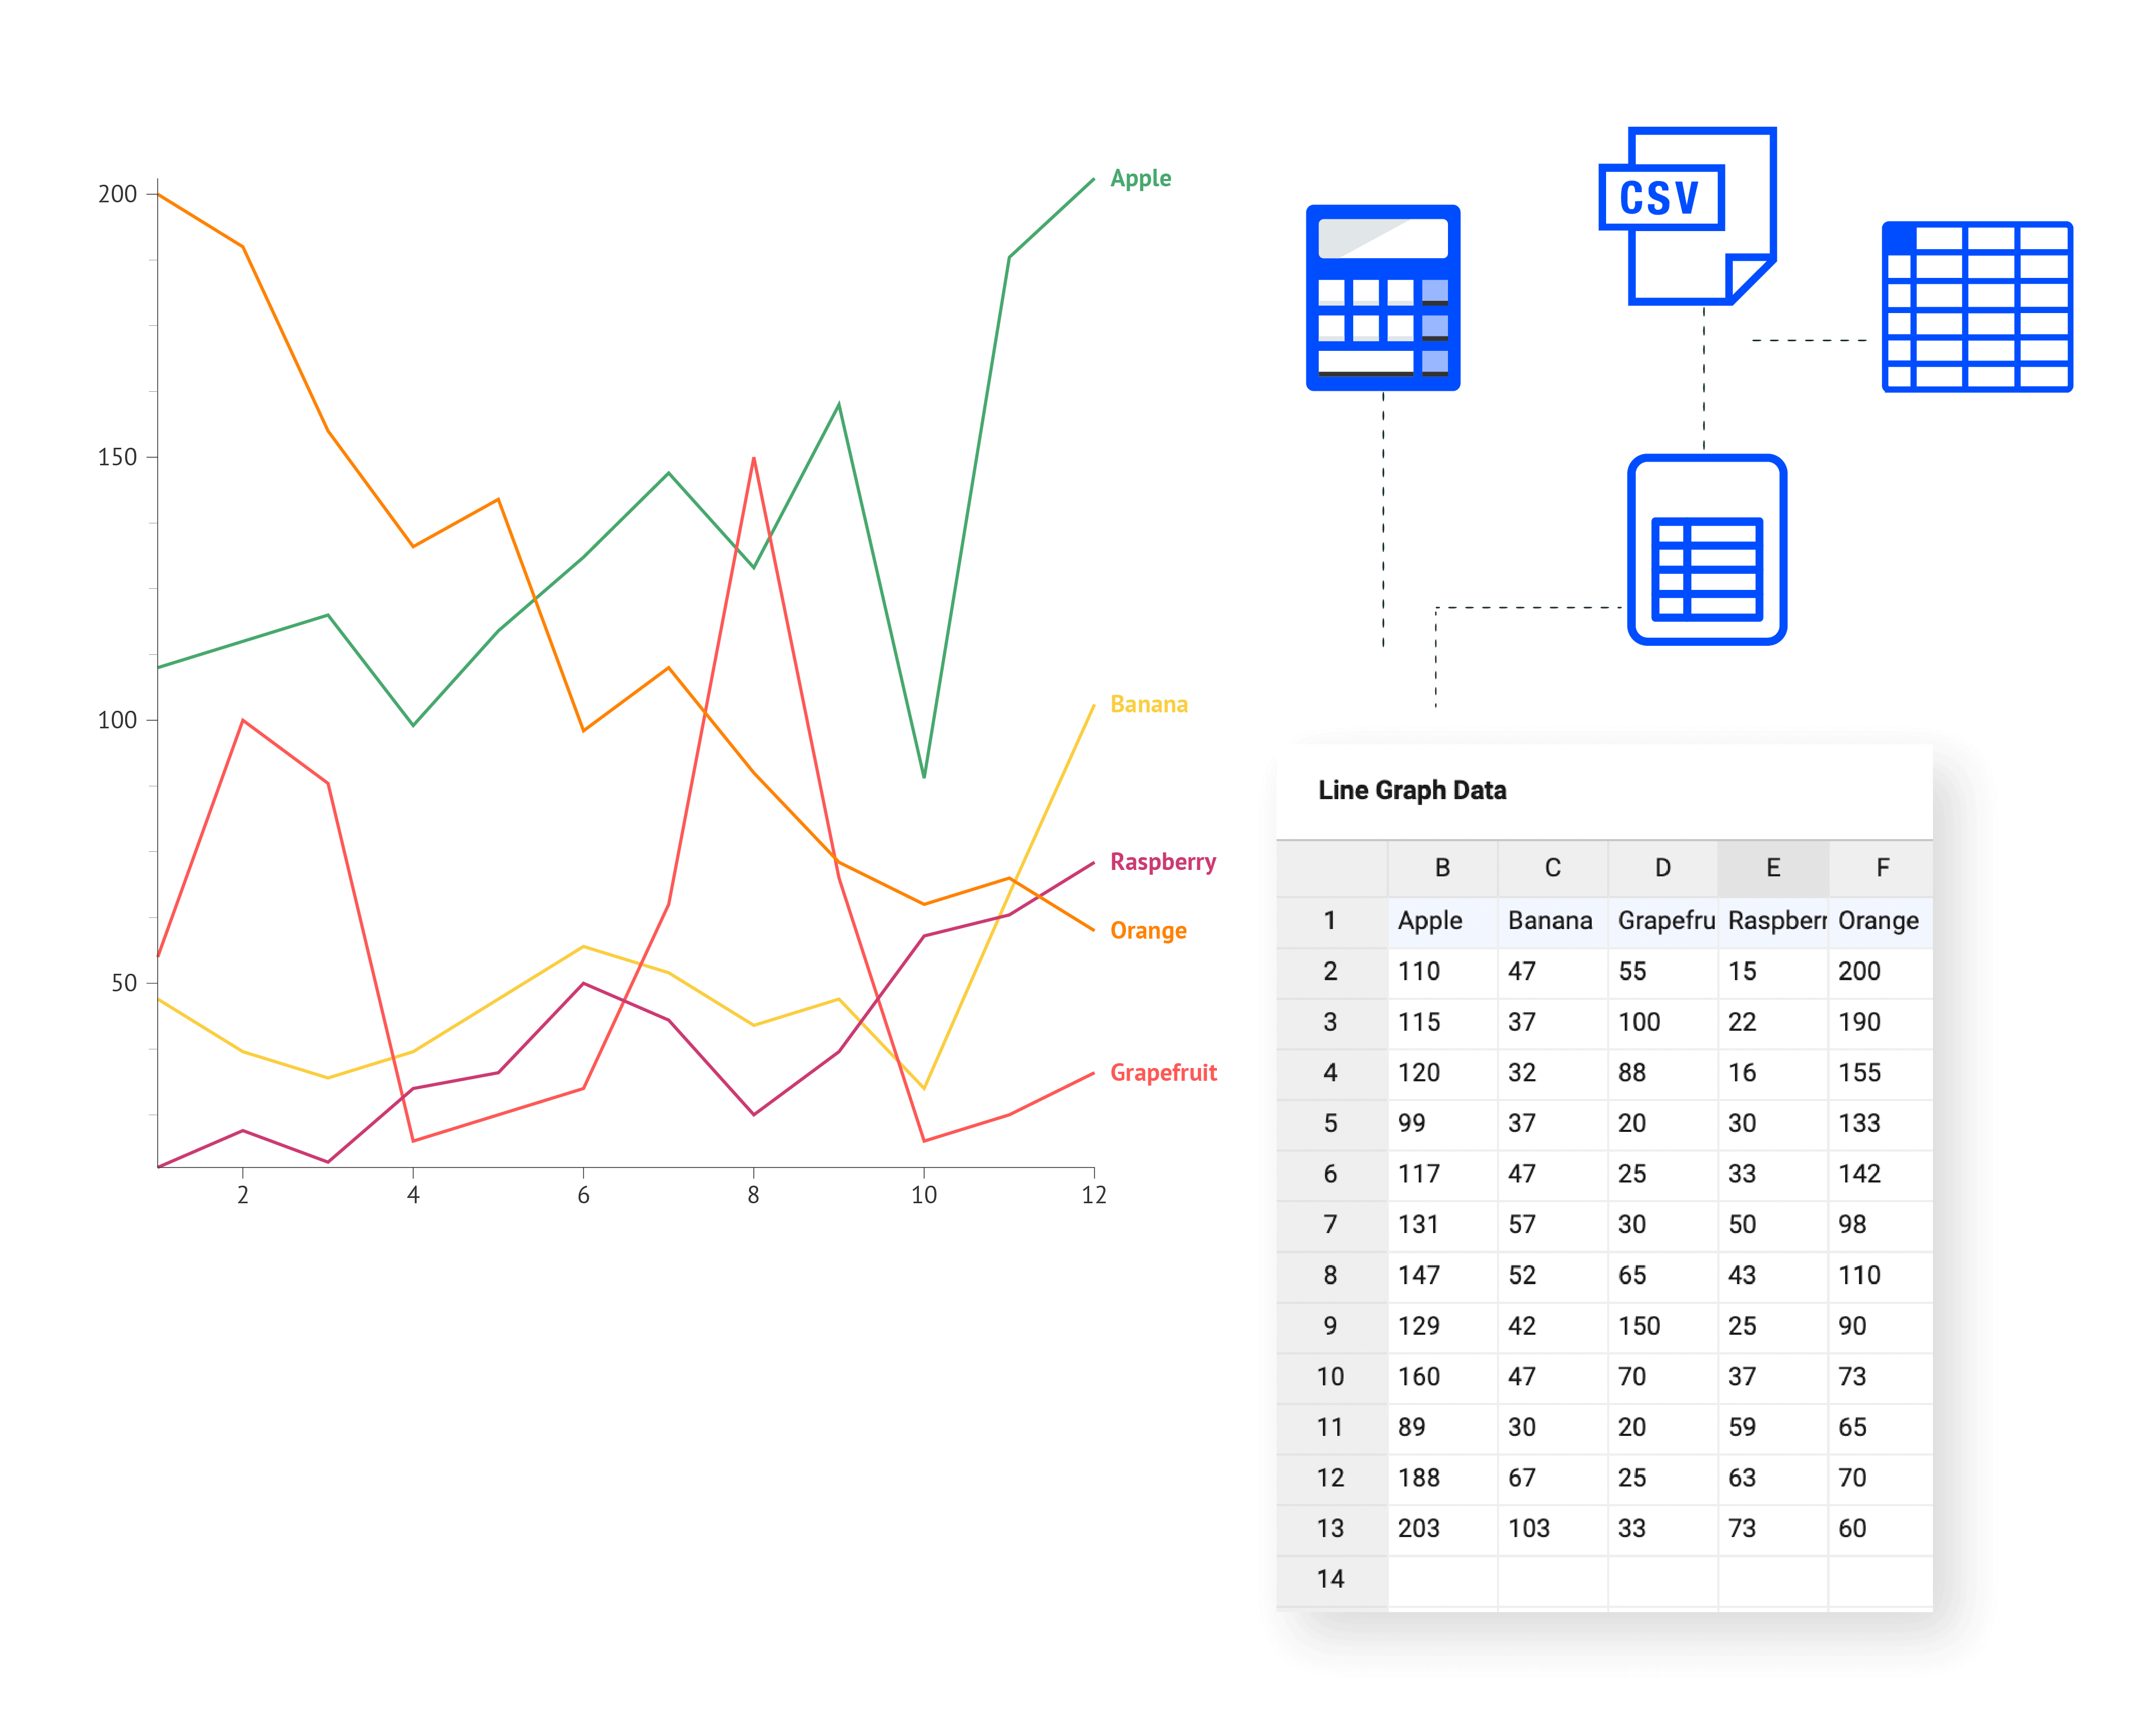
Easily organize your data by loading and storing it in the line graph maker
DATA SHEET MANAGER

Organize your data

Load and store your xls, xlsx or csv data into the line graph maker and link it with one or more charts in your designs. Manage your data sheets in workbooks and keep everything nicely organized.

Start making your online line graph
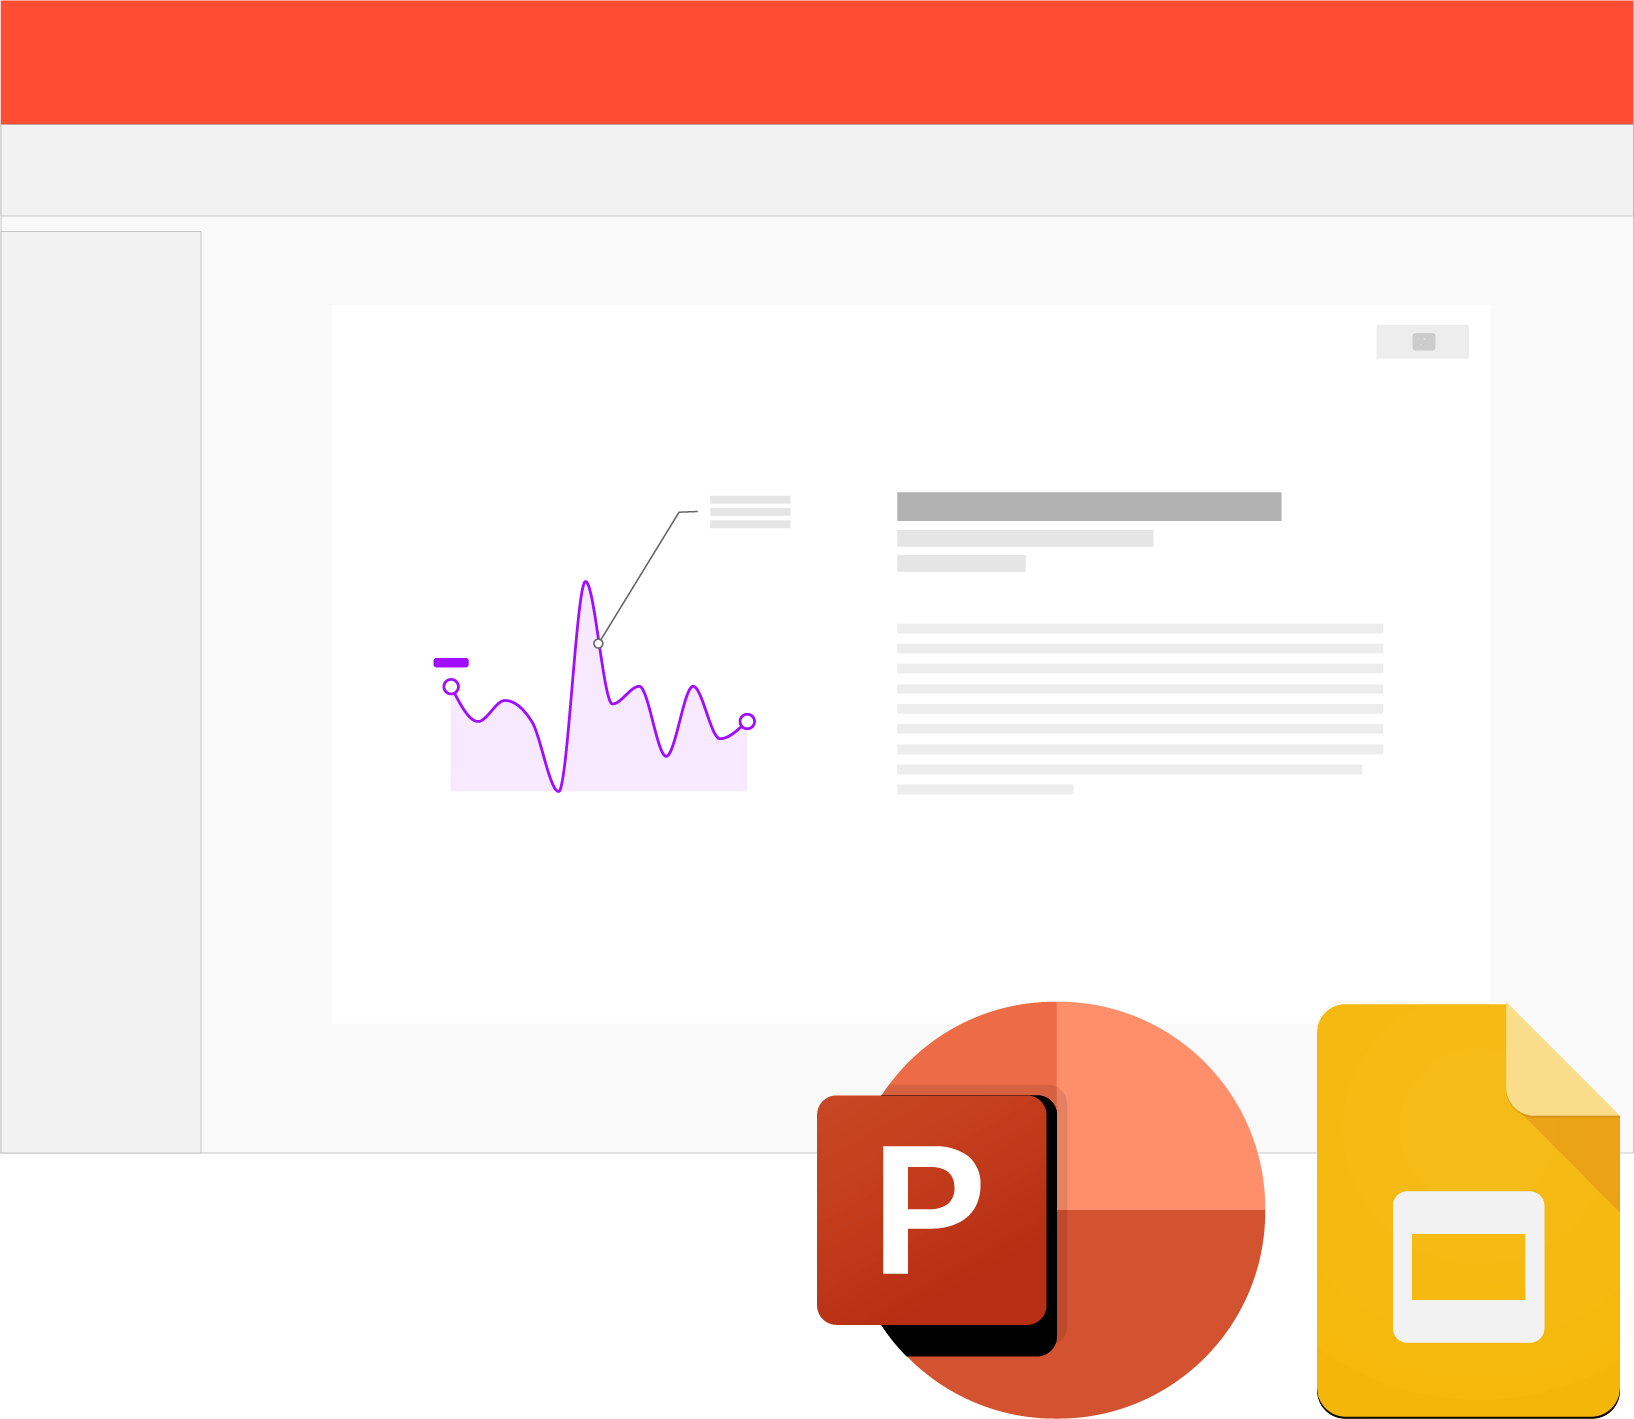
Create captivating presentations  Bring the right message across using your line graphs. Import them as SVG or PNG in PowerPoint, Google Slides, or other tools and have your presentation look professional and on-brand.
OUTPUT

Create captivating presentations

Bring the right message across using your line graphs. Import them as SVG or PNG in PowerPoint, Google Slides, or other tools and have your presentation look professional and on-brand.

Get started with our line graph maker

More line graph maker features

Enjoy full design freedom while greatly improving productivity. We believe that carefully designed line graphs are essential to making an impact with data. Datylon gives you a line graph maker tool with powerful styling options.
Chart library - Jumpstart from one of our 120+ chart templates and express exactly the message you want to bring across.

Chart library

Use our line graph templates to get you started easily. Create your own to become even more productive and stay on-brand.

Advanced styling - Enjoy full freedom of design with our advanced styling options. Tweak all line graph elements to perfection.

Advanced styling

Enjoy full freedom of design with our advanced styling options. Tweak all line graph elements to perfection.
Re-use & collaborate - Save time and re-use or re-purpose line graphs with new data. Discover how charts adapt automatically.

Re-use & collaborate

Save time and re-use or re-purpose line graphs with new data. Discover how charts adapt automatically.

Data management - Import, update and store the data in an organized way speeding up the line graph design process.

Data management

Import, update and store the data in an organized way speeding up the line graph design process.
Data-driven styling - Style line graph properties automatically based on data. Speed up production and let the data talk.

Data-driven styling

Style line graph properties automatically based on data. Speed up production and let the data talk.
Export & publish - Use your line graphs in other applications and channels. Improve the impact of your communication.

Export & publish

Use your line graphs in other applications and channels. Improve the impact of your communication.
DESIGNER PLAN

Adobe Illustrator plug-in

Advanced data visualization right within Adobe Illustrator! Use our extension for Illustrator and boost your dataviz power with an extra set of unrivaled chart design features. Build charts with the Datylon chart maker and add annotations, titles and illustrations using Adobe’s most powerful linework toolbox. Try it out for free with a 14-day trial.

Try our chart make plug-in for Adobe Illustrator and design the most advanced charts and graphs - Try for free!

Supercharge your line graph design

Join Datylon for free and get started online or download our Datylon for Illustrator plug-in with a 14-day trial. Connect with a Datylon expert for a demo session.

Create a free line graph in 6 steps

You do not have to choose between freedom of design or additional productivity. With the Datylon line graph maker, you easily create impactful data visualizations, again and again. Unleash your creativity in six steps:

Sign in or create an account

Making an account on Datylon is free and it only takes a few seconds. You can use your email address or Google account to join our platform and start making your own line graph.

Create a line graph with our line graph maker in 6 simple steps

Select 'Create design'

Although you can start with editing a pre-made line graph design on the Inspiration page, you can also create a line graph from scratch with our line graph maker. Just select 'Create design' and stay in the "Charts" category.

Create a line graph with our line graph maker in 6 simple steps

Select your default line graph template

Default charts serve as a starting point to help you design your line graph. Click on the line graph card to see a set of default variations and select the one you want by clicking on it.


Create a line graph with our line graph maker in 6 simple steps

Add your data

There are a few ways to add your data to the line graph maker. You can just type or copy-paste your data into an empty or dummy data sheet. You can also add a locally saved file. You can find more detailed information on how to manage data in the Datylon line graph maker in our Help Center article.

Create a line graph with our line graph maker in 6 simple steps

Bind your data and style the line graph

Data binding is the mandatory step to connect the data as columns or rows to categories, serie, or data marks (e.g. line graph axis). Make sure to check out our Help Center article to learn more about binding in our line graph maker.

Export your line graph design

Every design, publication, and inspiration chart can be exported to SVG, PNG or PDF file.

Get started now.

Create a line graph with our line graph maker in 6 simple steps

What is a line graph?

A line graph visualizes an evolution of data over time. The data points represent two variables and are connected by a line to show the changing trend of the data. The x-axis or independent axis shows a continuous variable (usually time) and the y-axis or dependent axis contains a numerical value for a metric of interest. The line graph is very helpful in showing overall trends or progress. If the data requires more precise focus or exploration, it’s better to use another chart type.

Line graphs are among the oldest types of charts and are still one of the most popular. They are versatile, simple, and easy to understand. They can show a lot of information at once, but be careful with overloading the viewer. To avoid creating a spaghetti chart, don’t show too many lines at once or make sure you highlight the most important ones. 

A line graph can be also very easily applied onto or merged with other charts like the bar chart or the area chart. 

Line graph resources

Learn how to work with line graphs, discover great alternatives and pro design tips, or create your own line graph in Illustrator. Find the best chart resources below and dive into the world of line graphs.
Line graph resource page: line graph definition, line graph alternatives, line graph variations and pro tips for line graph design

Line chart - Resource page

Your starting point for making line graphs. The resource for everything around how to use and design line graphs and available built-in chart templates.

Read more
What really is a line graph? Dive deep into the world of line graphs and line charts and learn what makes a really good line graph

A deep dive into... line charts

Understand how reading a line graph works in our brain. Consider what makes a good line graph. Dive deep into the world of line graphs with this in-depth article.

Read more
How to create a fully customizable line graph design in Adobe Illustrator with our chart maker plug-in Datylon for Illustrator

How to make a line chart in Illustrator

Learn how to draw and edit your own line graph in Adobe Illustrator with our chart maker plug-in, Datylon for Illustrator.

Read more

Get inspired

Scroll and click on the images below to find inspiration samples of line graphs and other similar charts. With your Datylon account, you can use these designs, customize them and update them with your new data.

FAQ about our
line graph maker

Is Datylon line graph maker free?

Yes! If you want to create a line graph or any other type of graph or chart, you need to register on Datylon. Creating your account is free and only takes a few seconds. But if you would like to use our chart maker plug-in for Adobe Illustrator, you can try it for free for 14 days. Check the pricing here.

Learn more about the differences between our products here.

How to create a line graph?

Easily! If you want to create a line graph online, you can create a free account on Datylon using this link. With your account, you're free to create any type of chart available. Click on "Create design" and find the chart type or chart template you're interested in. In this case, click on "Line chart". You can also check our Help Center to learn more about how to create and style your line graph.

Can I share my line graph online?

Of course! When you create a new line graph design, by default it's private. You can then publish the design and add it to publications. Every publication can be shared and embedded online. Just right-click on your publication and generate the code.

Can I print my line chart?

Yes. Although you can export your line graph design as a PDF (or PNG) and print it, it probably is more common to print reports and bigger layouts containing multiple charts and graphs. For this, you might want to use our robust chart maker plug-in for Adobe Illustrator - Datylon for Illustrator. The plug-in supports CMYK color mode or spot colors enabling on-brand color consistency. Learn more about the color modes available here.

What if I want a different type of chart?

Then with Datylon, you're in good hands! Datylon chart maker offers 120+ chart templates. Line graph, bar graph, scatter plot, heatmap, treemap, and many, many more chart types are available in Datylon! Our chart types are carefully crafted to give you the full power of expression. Use our chart templates to get you started easily and quickly. Create your own to become even more productive and stay on-brand.

Can you help me make a line graph?

Definitely! We're a bunch of data visualization experts ready to help you get started with our chart maker. As it is often with many online tools, at first the features of our chart maker might be overwhelming. There are different ways to get help. You can check our elaborate Help Center and see if your question can be answered there. If not, we're more than happy to show you around our tools and services! Use this link to schedule a free demo session!

Okay, but what about my privacy?

We take data security and privacy issues very seriously. Please check our privacy policy to learn more.

About data security:
If you save your data, charts or designs on Datylon's online platform (web app), it will belong only to your account and you will have full control over it. Your data is treated as confidential while Datylon keeps all online user data in secure servers.

If you publish a project on our web app, it can be accessed through a direct link with a unique ID. If you want to make sure nobody finds your visualizations, keep them unpublished and download them as PDFs, SVGs, or PNGs for private use.

Read more here.

Didn't find the answer? Check our Help Center.