datylon-stacked-bar-chart-icon

Stacked bar chart

datylon-chart-library-stacked-bar-chart-hero-image
DATYLON > CHART LIBRARY > STACKED  BAR CHART

What is a stacked bar chart?

 
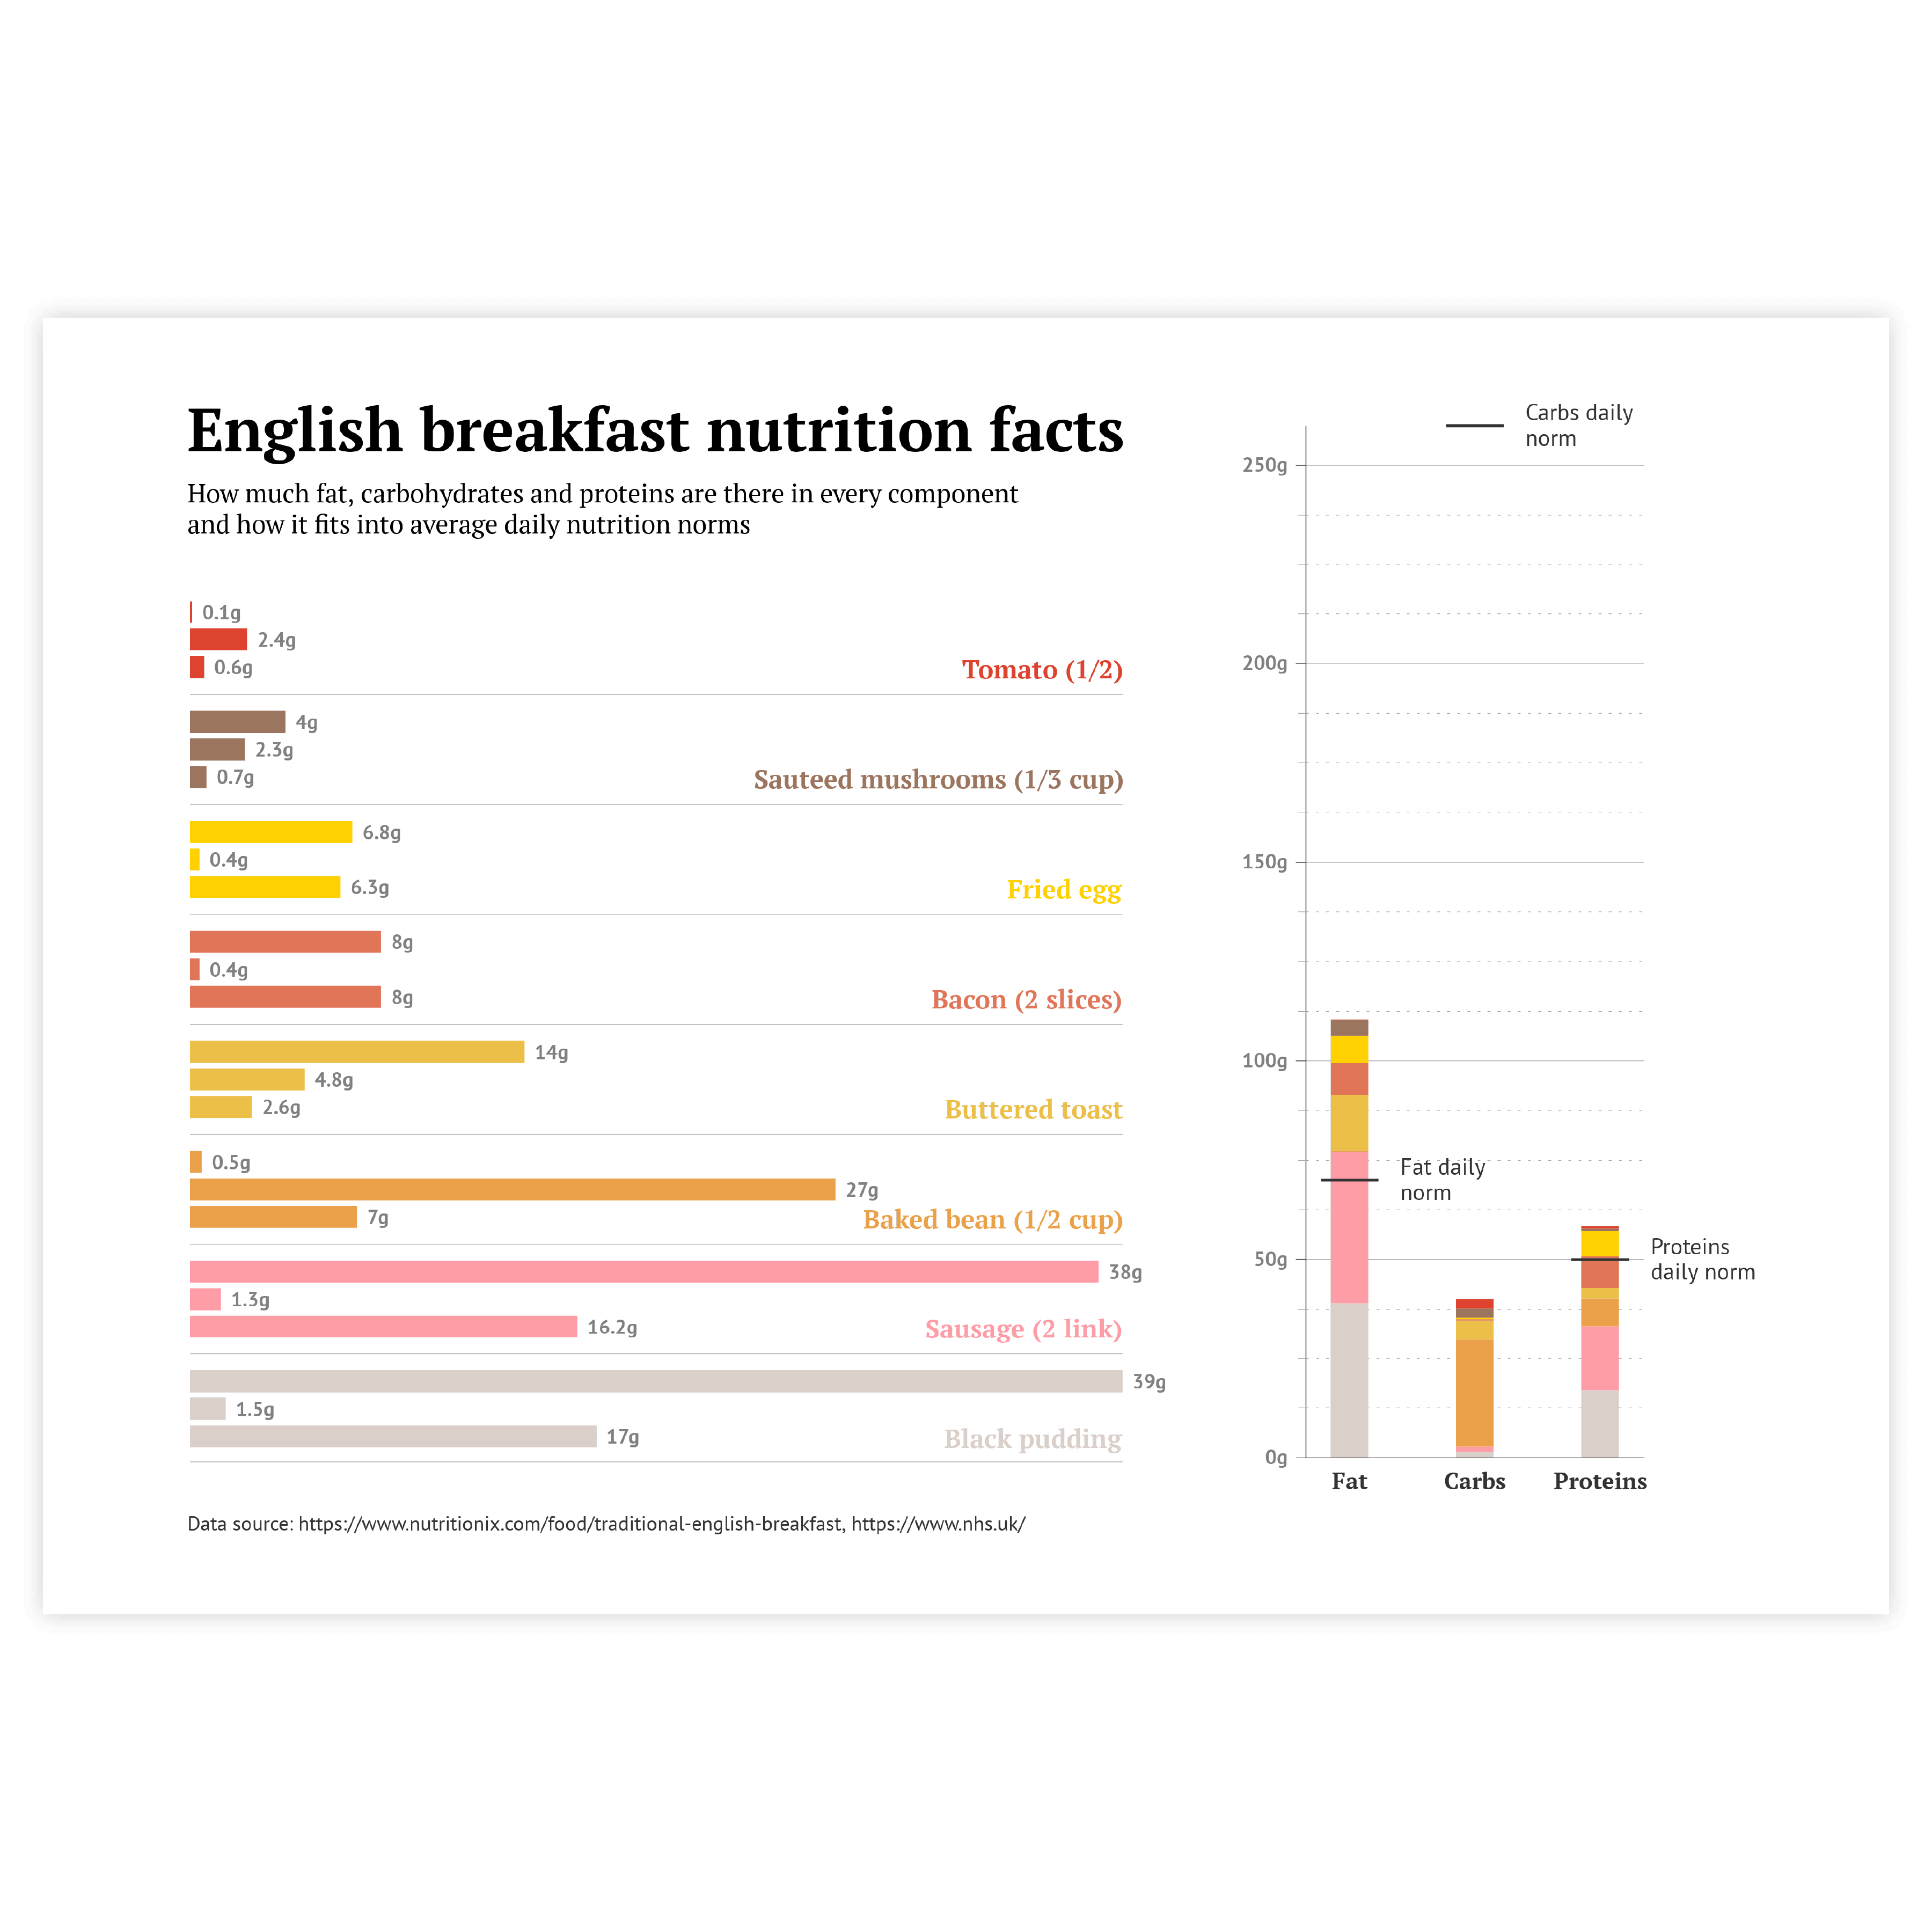
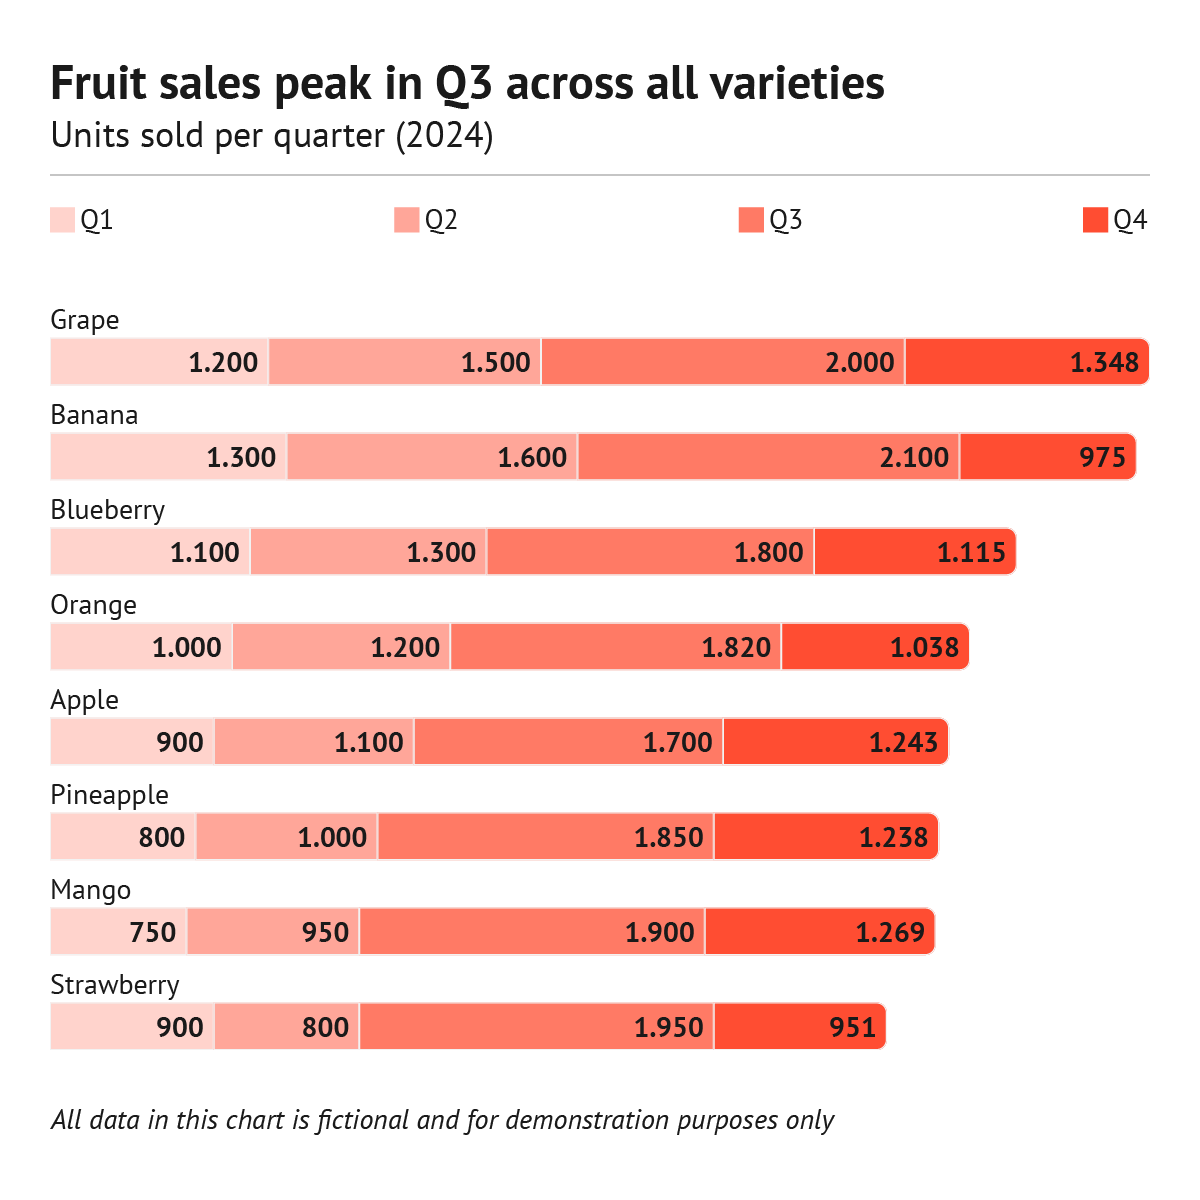
A stacked bar chart is created on base of a regular bar chart. The difference is that in stacked bar chart the bar is divided into colored segments. The full size of the bar represents the total, while segments show the contribution of each element. 

Stacked bar charts are great for showing part-to-whole relationships inside one bar and for comparison between bars. 

Stacked bar charts are commonly used charts due to their simplicity. It makes them a preferable option for showing part-to-whole relationships. 
 

Stacked bar chart examples & inspiration

Scroll and click on the images below to find inspiration samples of stacked bar charts. With your Datylon account, you can use these designs, customize them and update them with new data. 

Variations of stacked bar charts

The charts below are variations of a stacked bar chart. To learn how to make them with Datylon, check out the bar chart user documentation in the Datylon Help Center.
Datylon chart library: use a diverging bar chart as a variation of a bar graph

Diverging bar chart

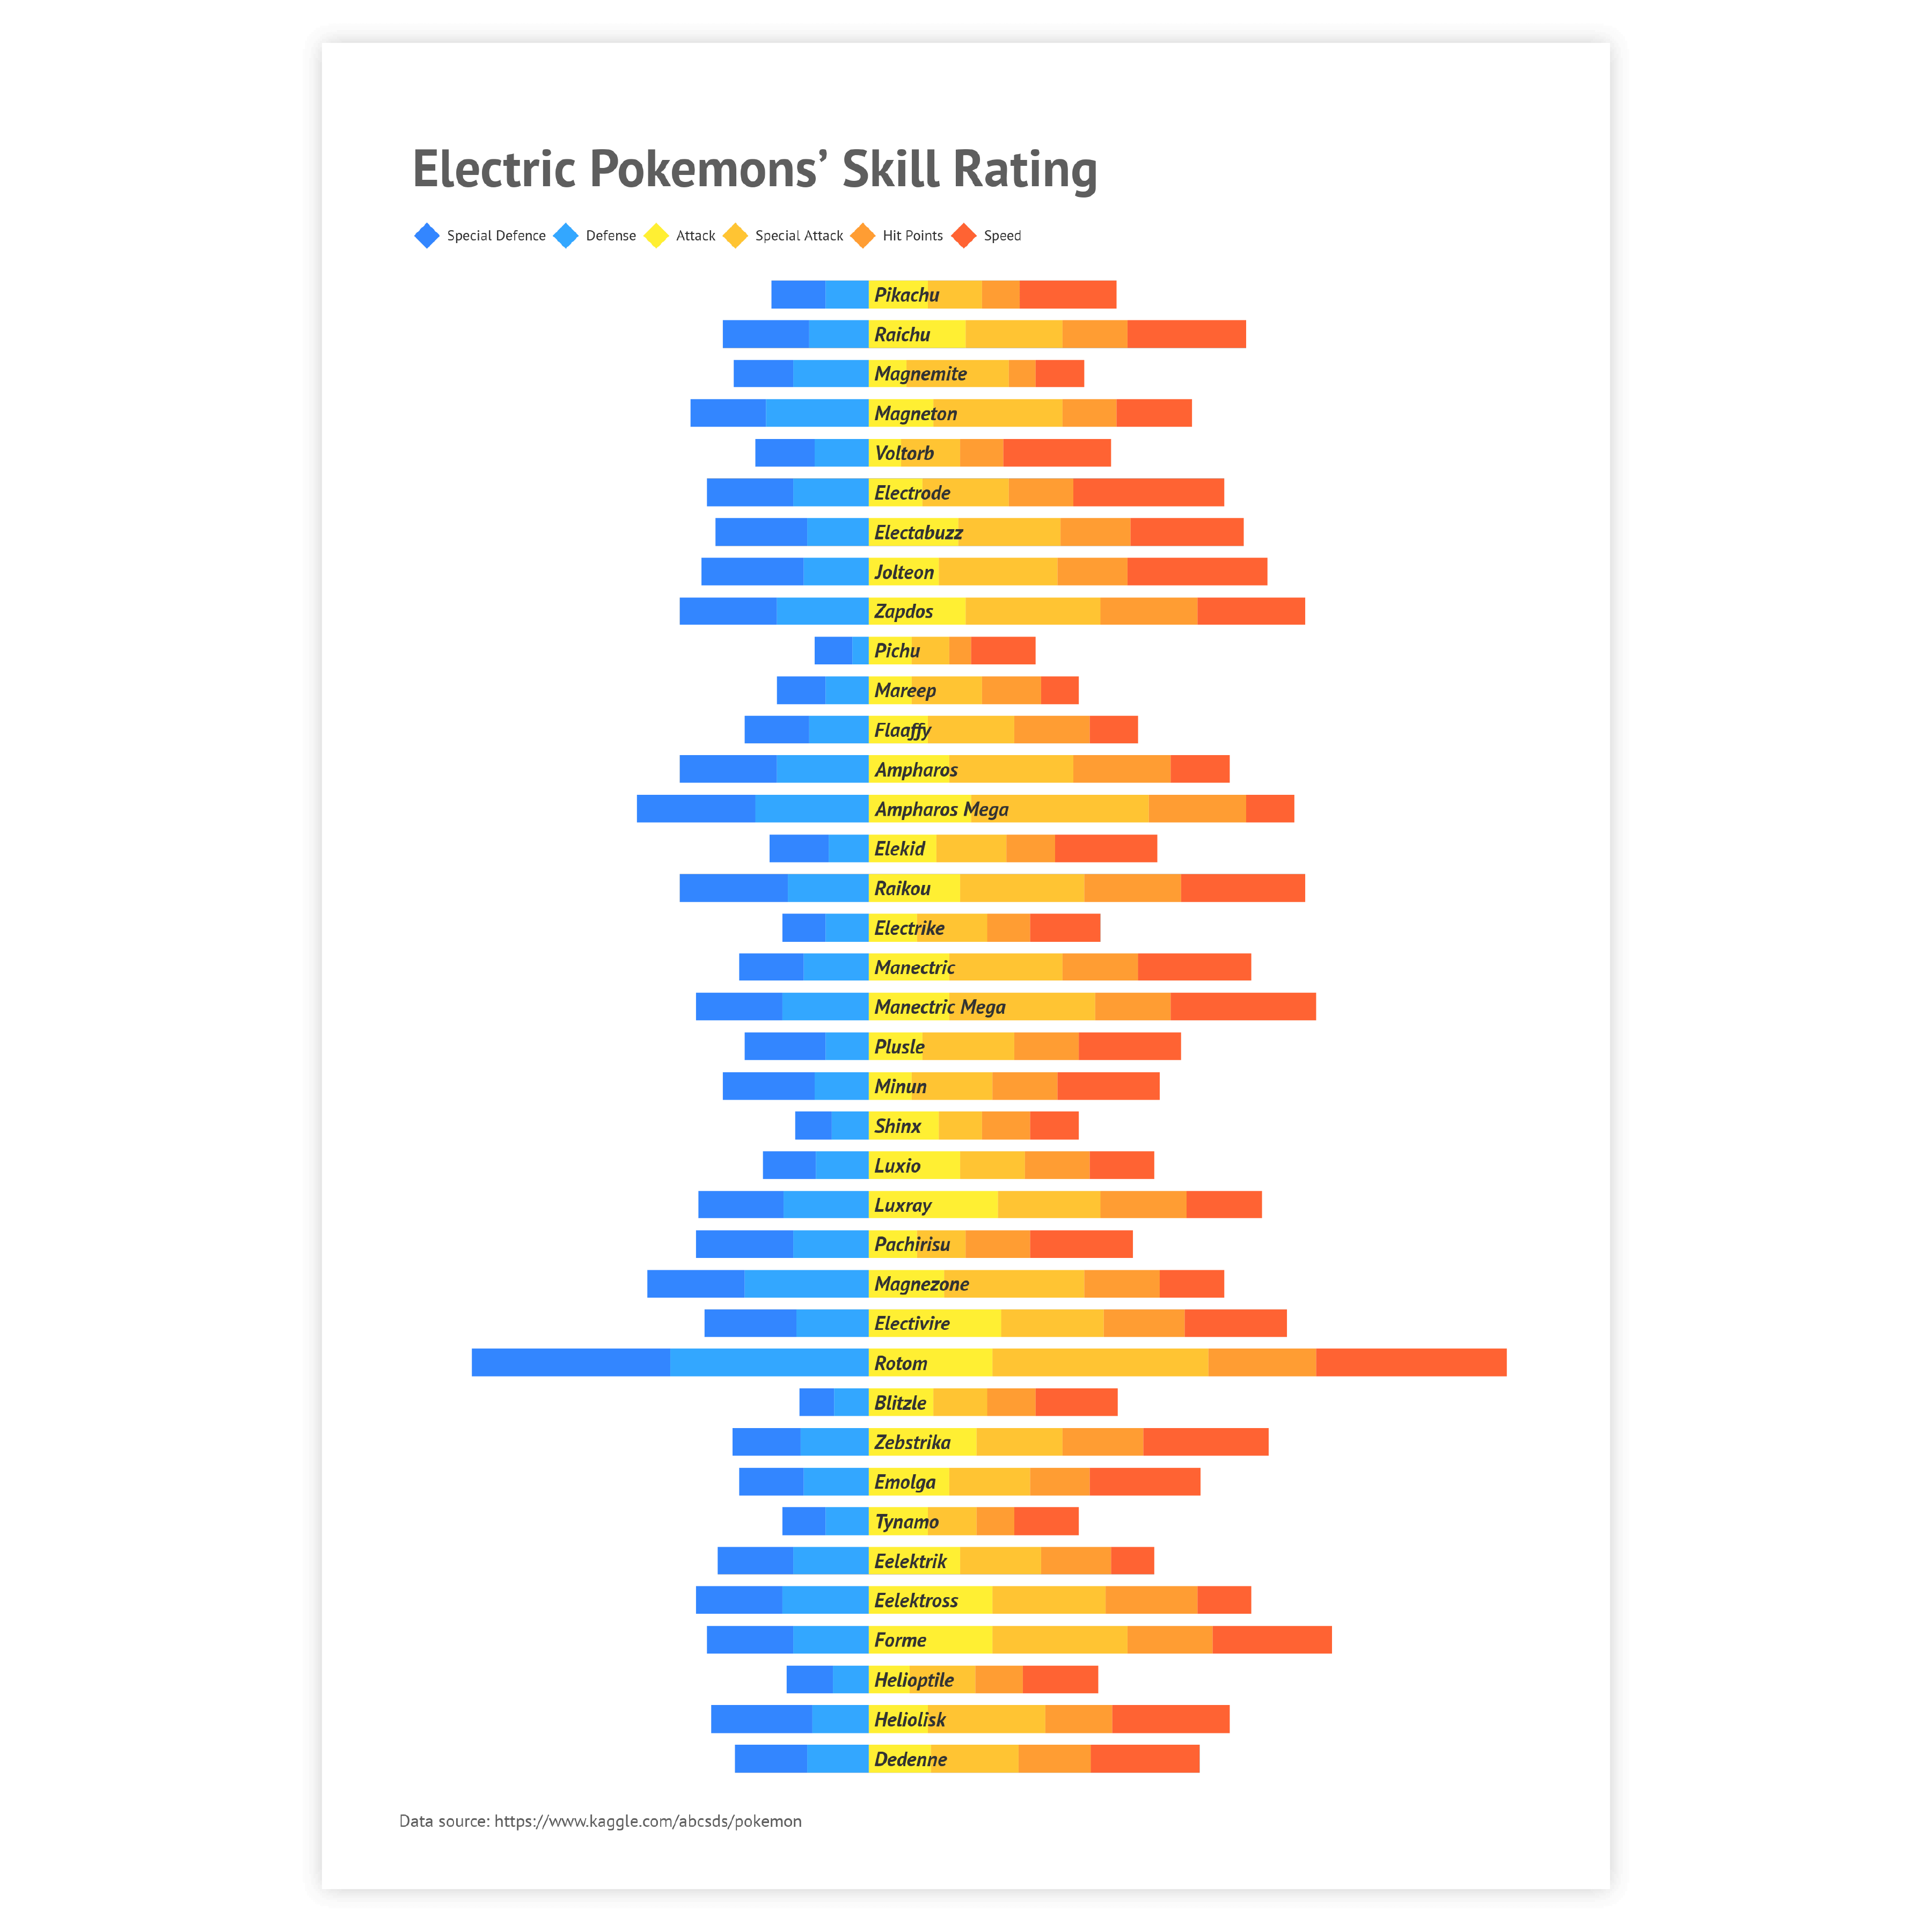
This is a stacked bar chart where segments are divided with the axis baseline. It can be useful for the comparison of paired categories.

datylon-chart-library-stacked-bar-chart-100%stacked-bar
datylon-chart-library-stacked-bar-chart-100%stacked-bar-hover

100% stacked bar chart

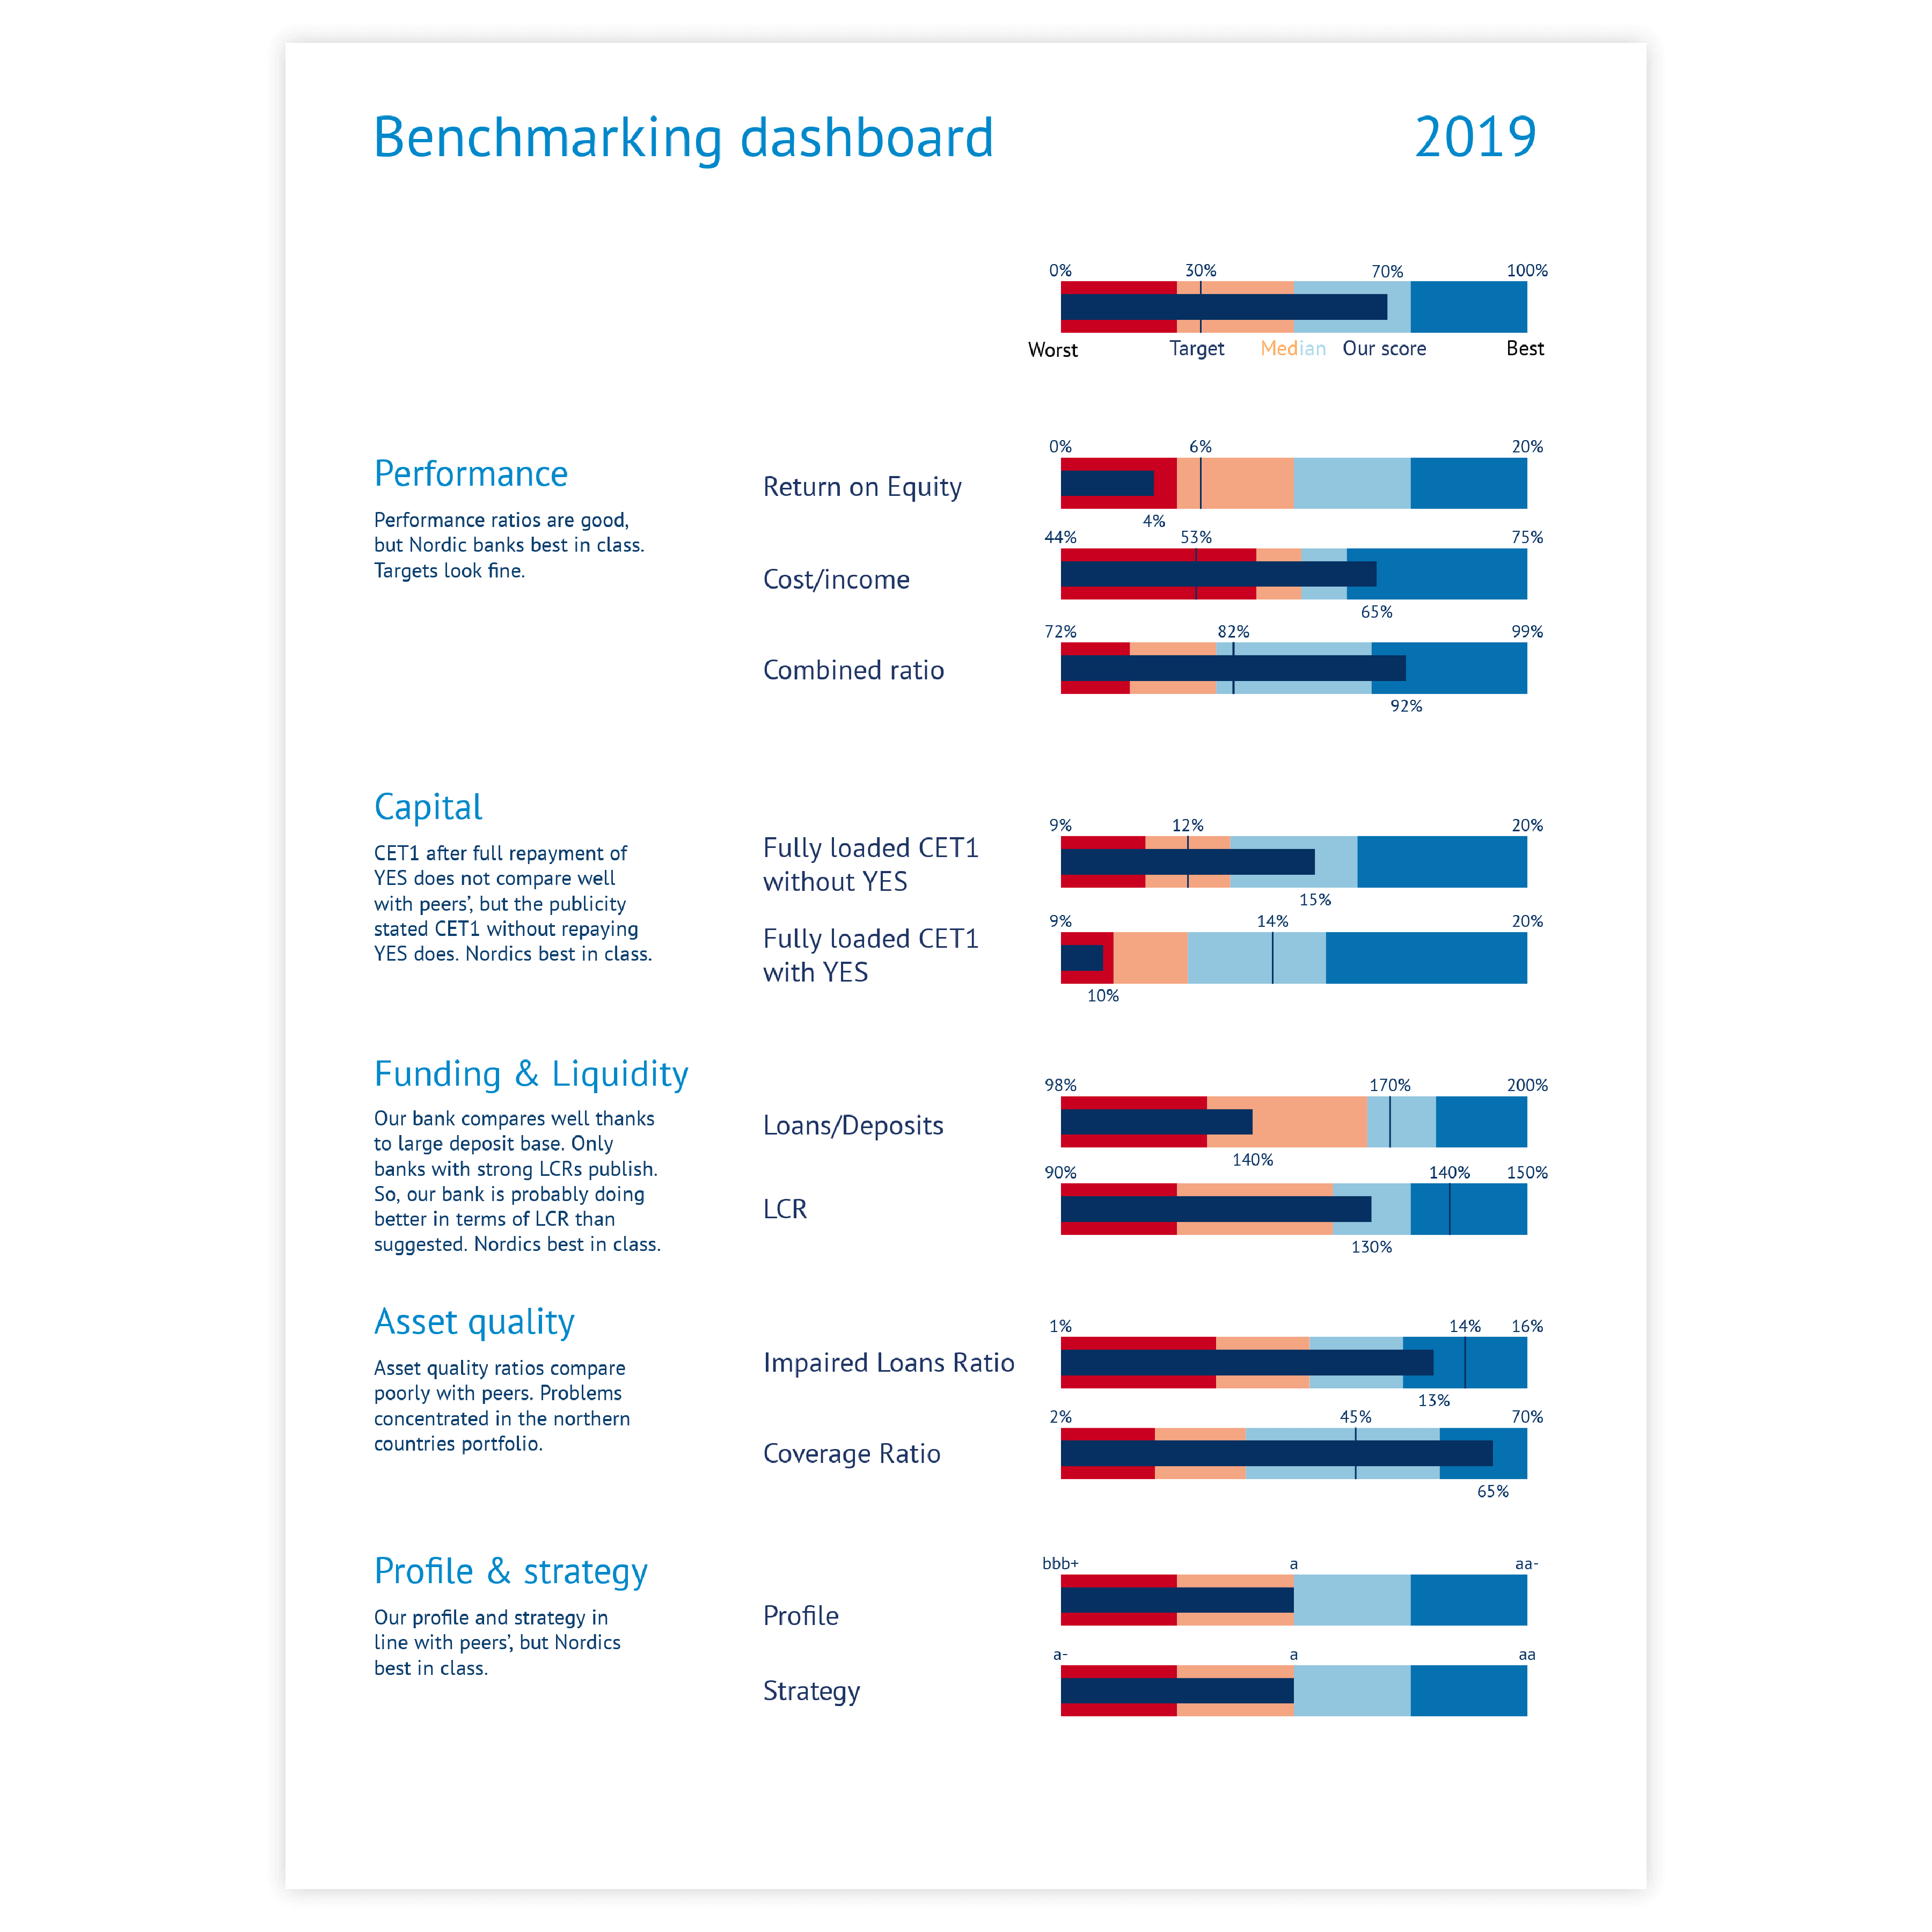
100% stacked bar chart can be useful for showing part-to-whole relationships via percentages. It can exist as a one bar chart or as a set of bars.

datylon-chart-library-pyramid-chart
datylon-chart-library-pyramid-chart-hover

Pyramid chart

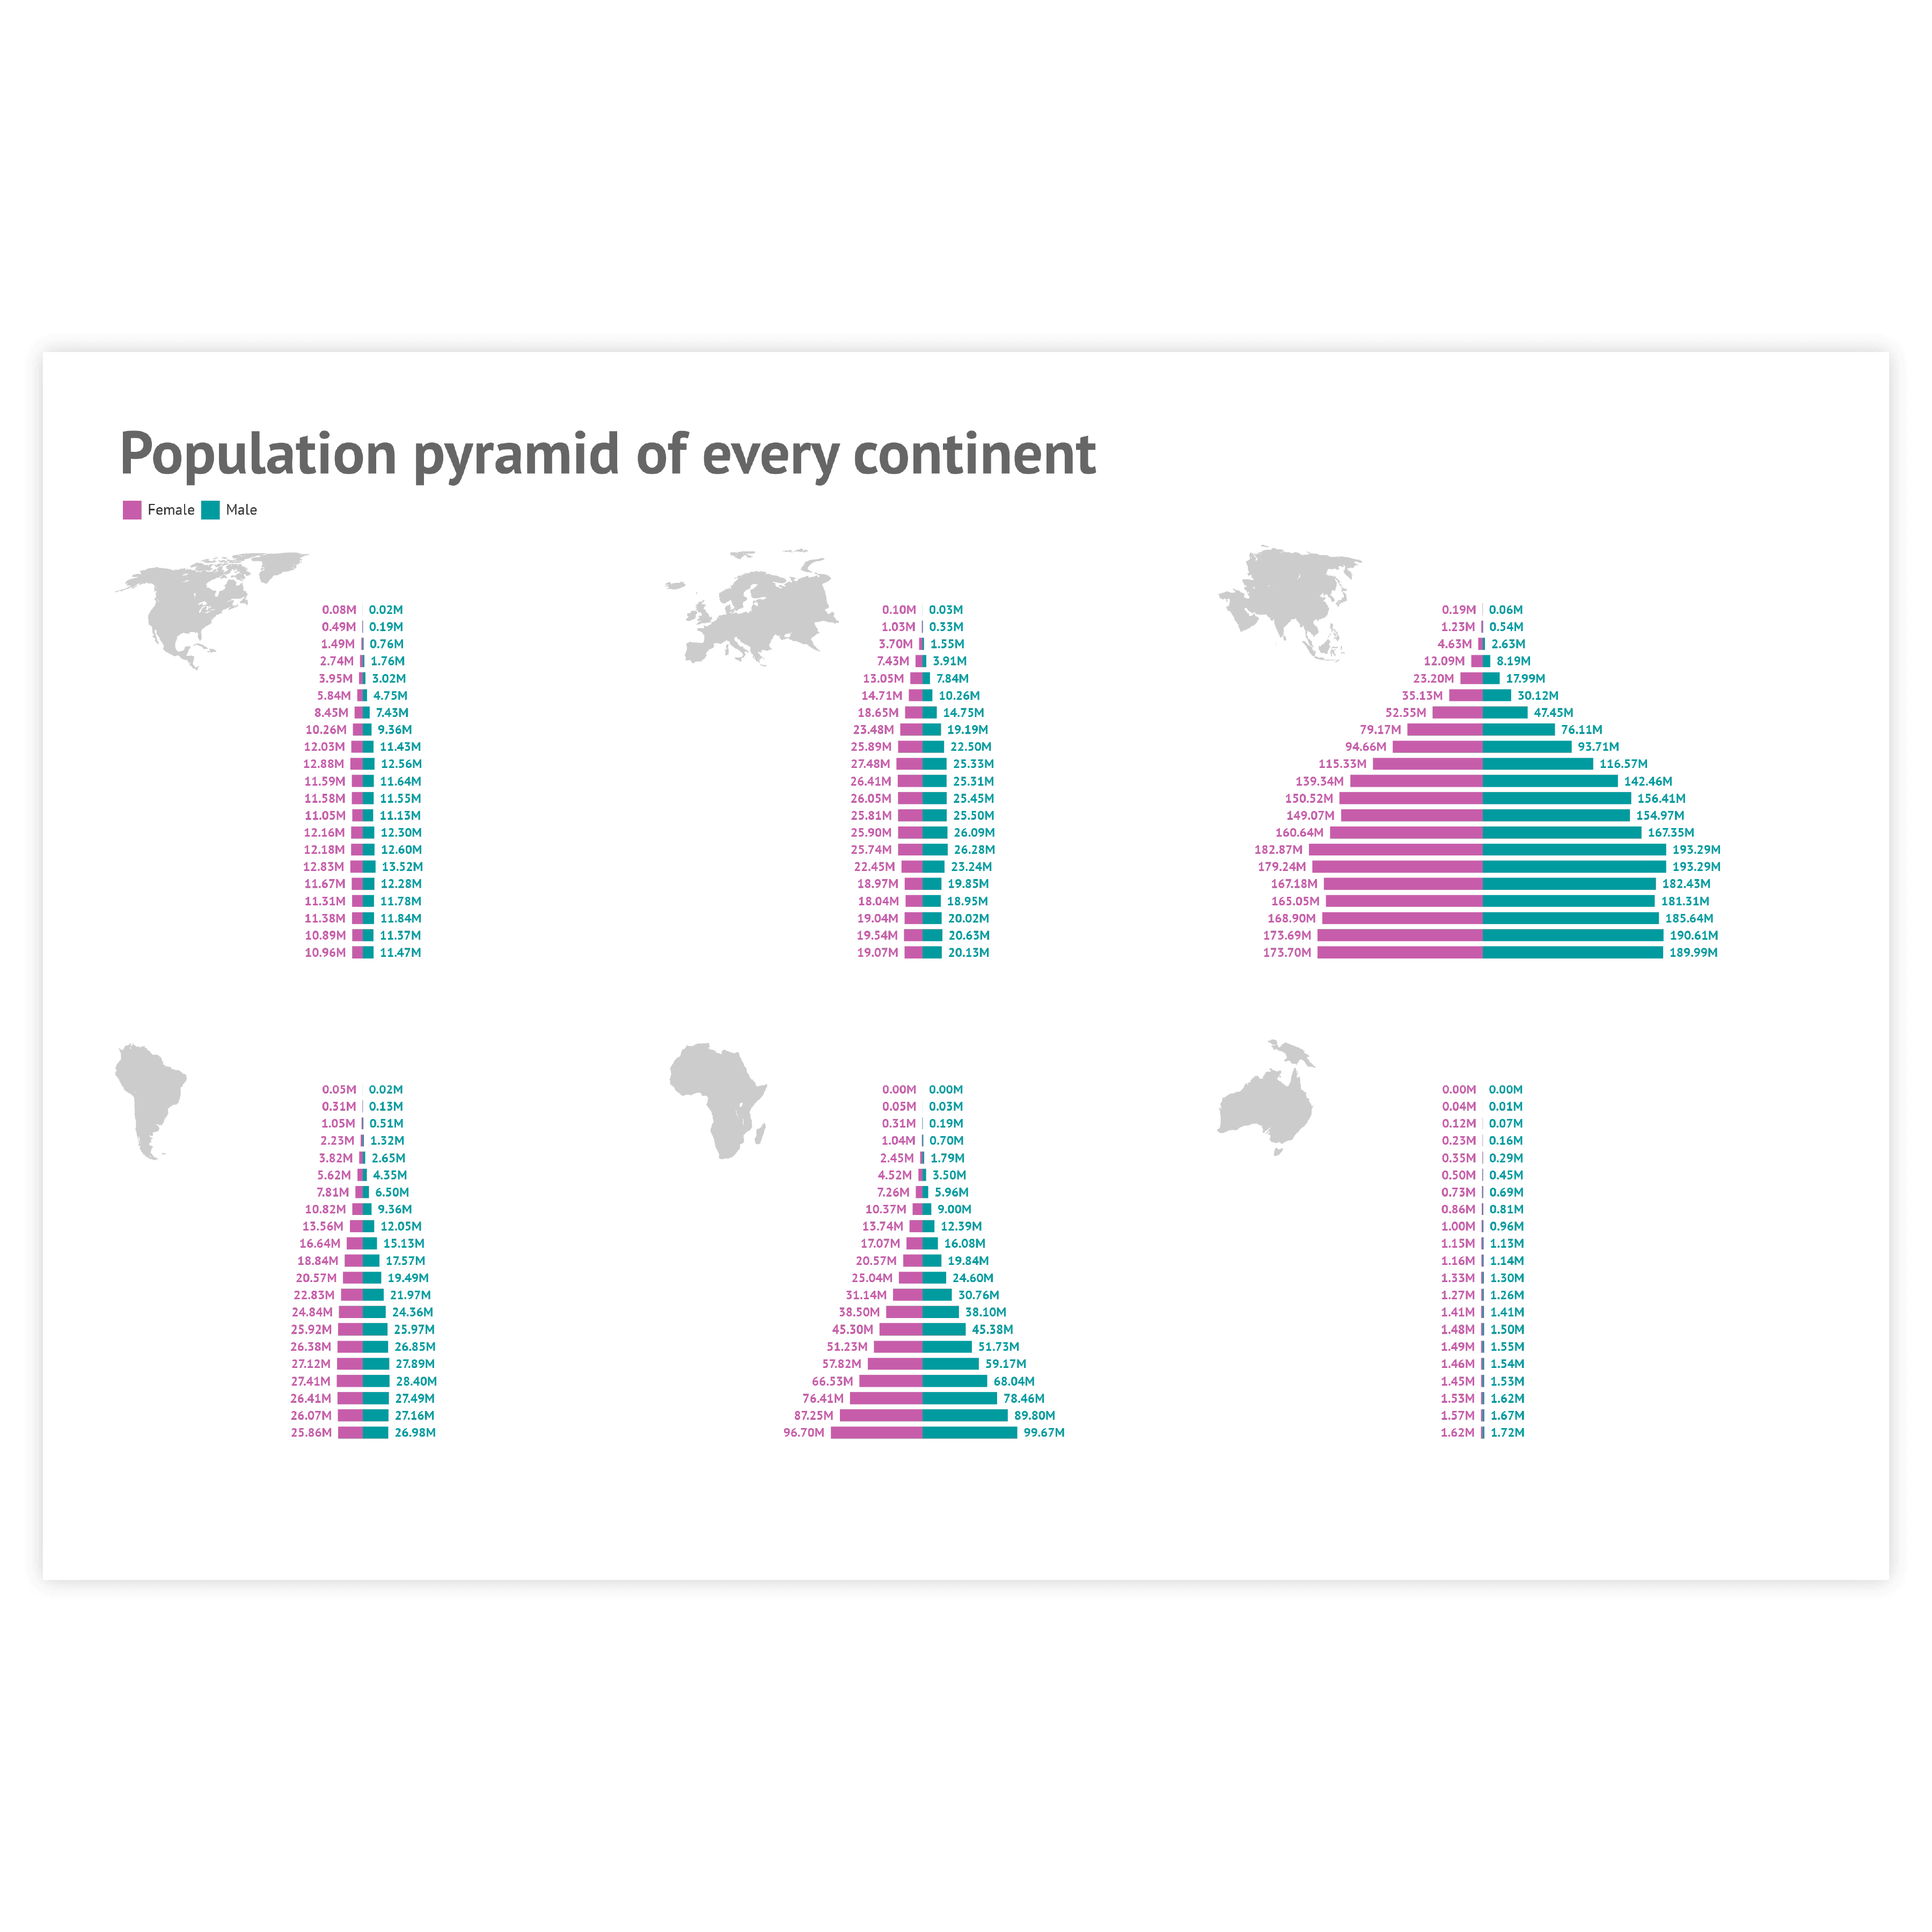
Pyramid chart is a variation of a diverging bar chart. It is specifically used only to show how a population is distributed by age and sex.

Alternatives to a stacked bar chart

Substitute your stacked bar chart with any of the charts below when you want a visual alternative that still allows you to compare values within and between categories.
datylon-chart-library-pie-chart
datylon-chart-library-pie-chart-hover

Pie chart

You can use a pie chart if you are dealing with only one dimension and the values in your data add up to 100%. The pie chart uses the surface of the slices in combination with the arc length to communicate the value.

datylon-chart-library-bar-chart-grouped-chart
datylon-chart-library-bar-chart-grouped-chart-hover

Grouped bar chart

A grouped bar chart is a variation of a bar chart. Each category is represented by multiple columns, illustrating a different aspect of the main category. The columns within each category are separated by spacing.

datylon-chart-library-treemap
datylon-chart-library-treemap-hover

Treemap

A treemap consists of a rectangle that is proportionally divided into other rectangles, representing the categories. The area of the shapes represents the values. It is useful when the scale of the values differs significantly. 

Pro tips for designing a stacked bar chart

Learn how to improve the readability and visual appeal of your stacked bar chart.
datylon-chart-library-stacked-bar-chart_2@2x

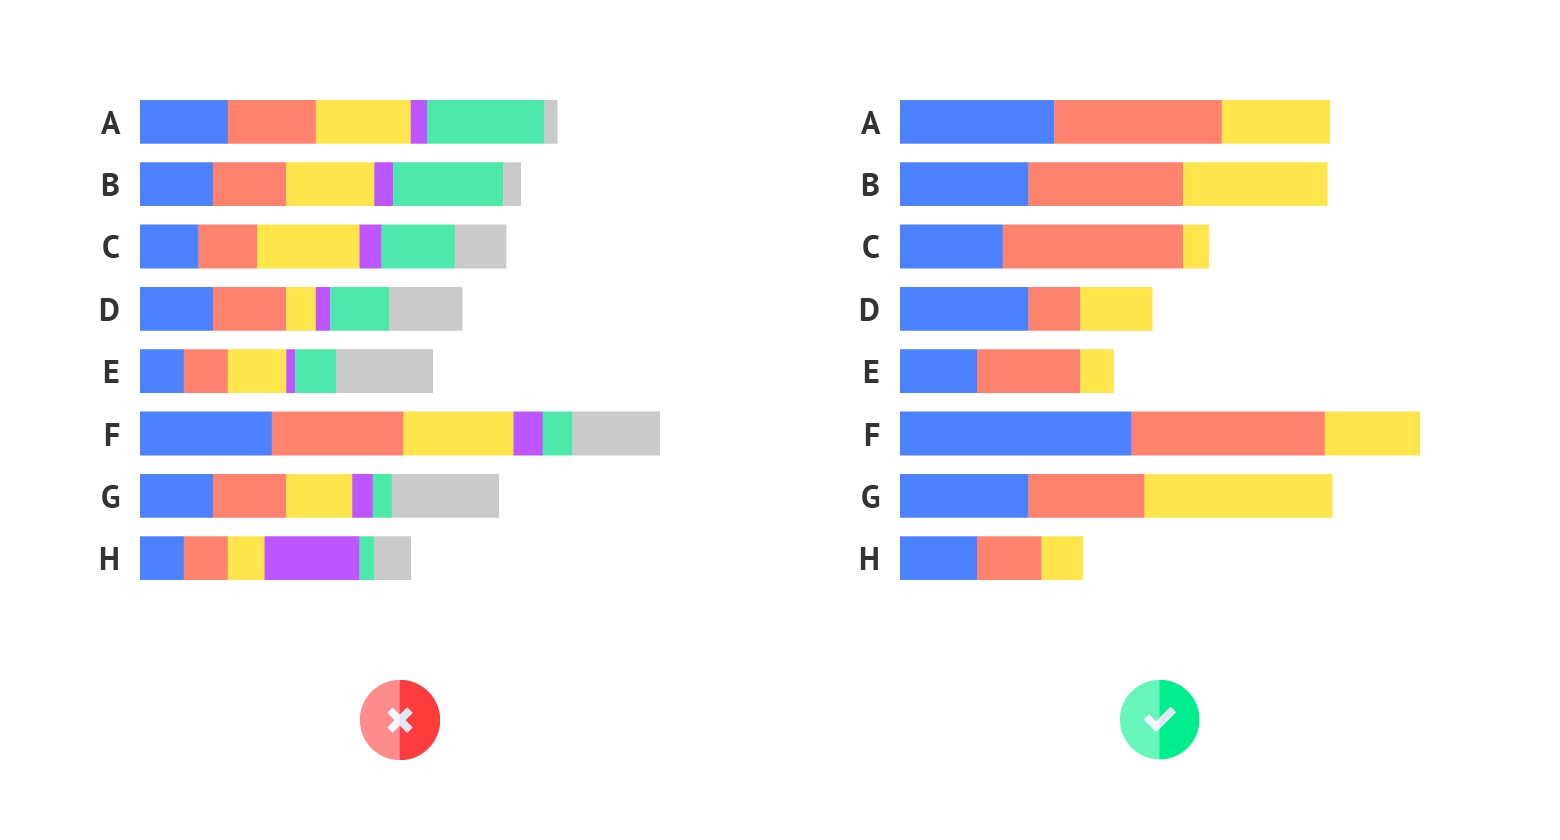
Number of segments

For stacked bar chart it's better not to use more than 3 segments per bar. Otherwise that chart becomes cluttered and it's extensively harder to read chart and compare separate segments.
datylon-chart-library-stacked-bar-chart-highlighting@2x

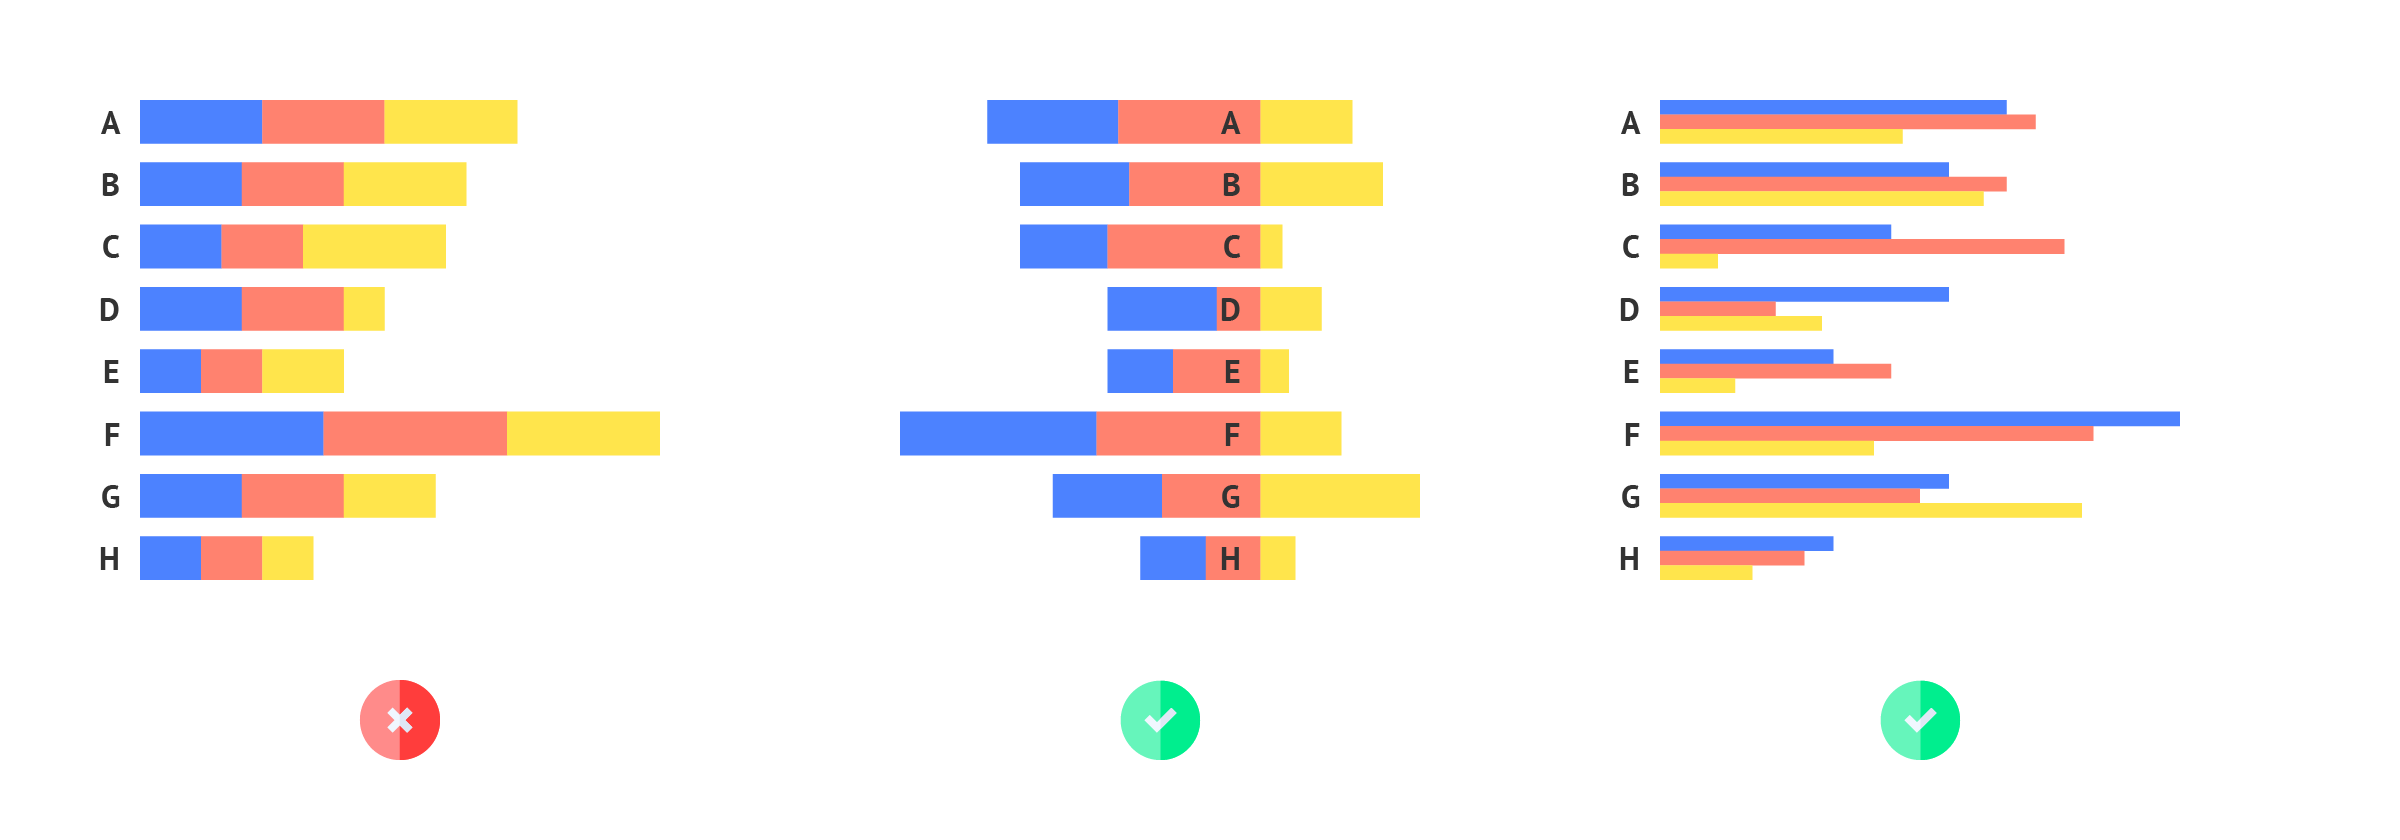
Comparing segments

In stacked bar chart it might not be easy to compare segments that are part of different bars. If you want to compare segments you might need to use diverging or grouped bar chart. Fortunately in Datylon bar chart it can be done in one click.

datylon-chart-library-stacked-bar-chart-sprting

Negative value segments

Comparing stacked bar charts that include segments with negative values can be misleading, as it may distort the overall interpretation of the chart. If your data contains negative values in one or more segments, consider using a grouped bar chart instead. This approach provides a clearer and more accurate representation of your data in such cases.
datylon-chart-library-stacked-bar-chart-overlaid-bars@2x

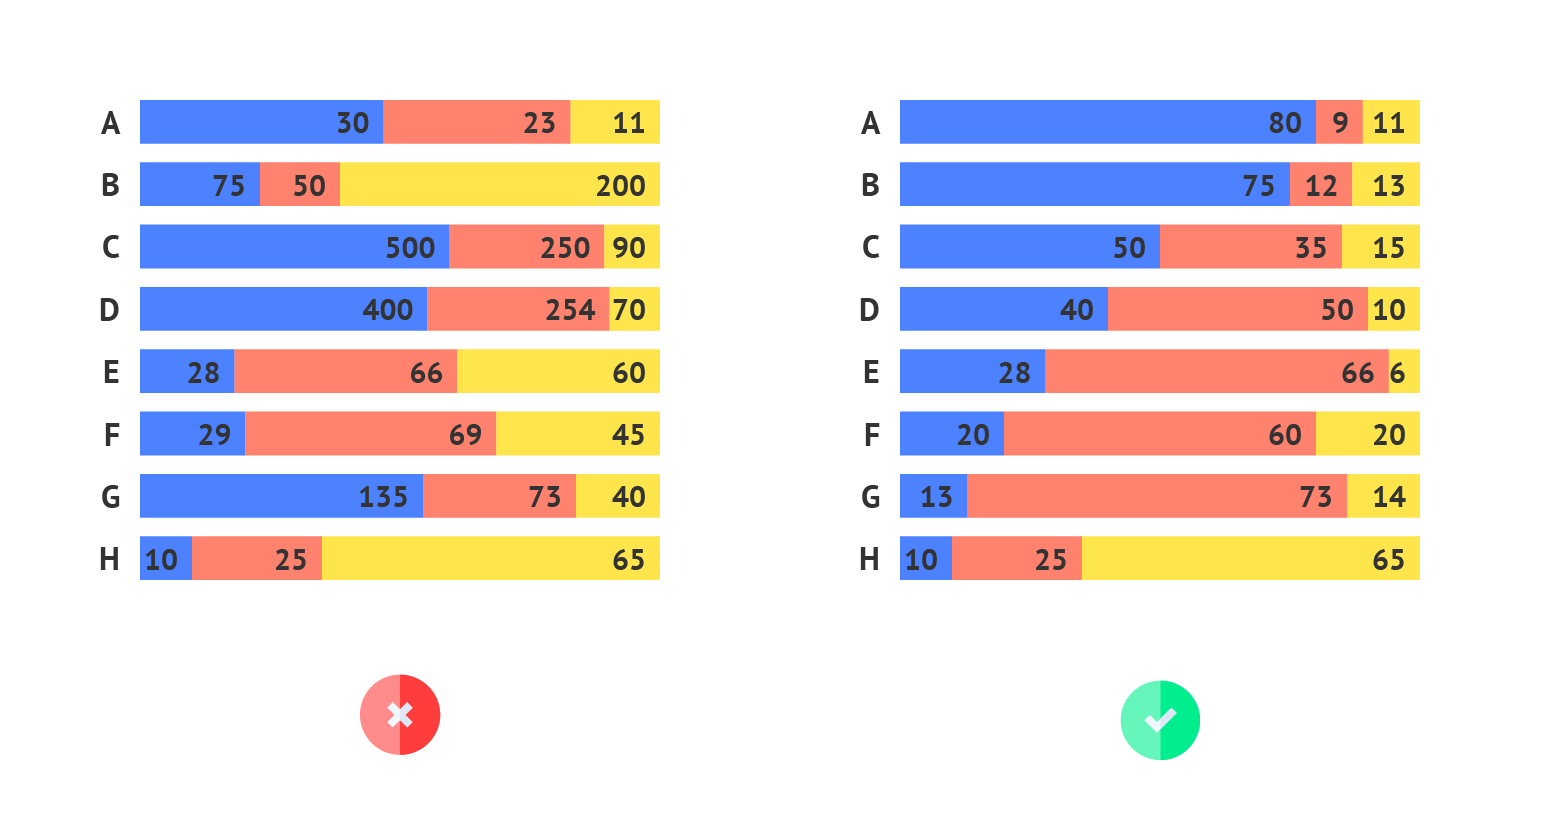
100% stacked bar chart

100% stacked bar chart allows you to compare the structure of several categories. But it's important to remember that if the range of values differs between categories there might be a misleading sense that values are similar. The recommendation is to use 100% stacked bar chart only for the cases when the total values of different categories have the same range.

Discover more charts in our Chart Library

Learn more about the different types of charts and graphs you can design with Datylon. Discover other resource pages in our Datylon Chart Library.

Learn advanced stacked bar chart tips first hand

Join Datylon for free and get started online or download our Datylon for Illustrator plug-in with a 14-day trial. Connect with a Datylon expert for a demo session.