 - no coding skills needed!")
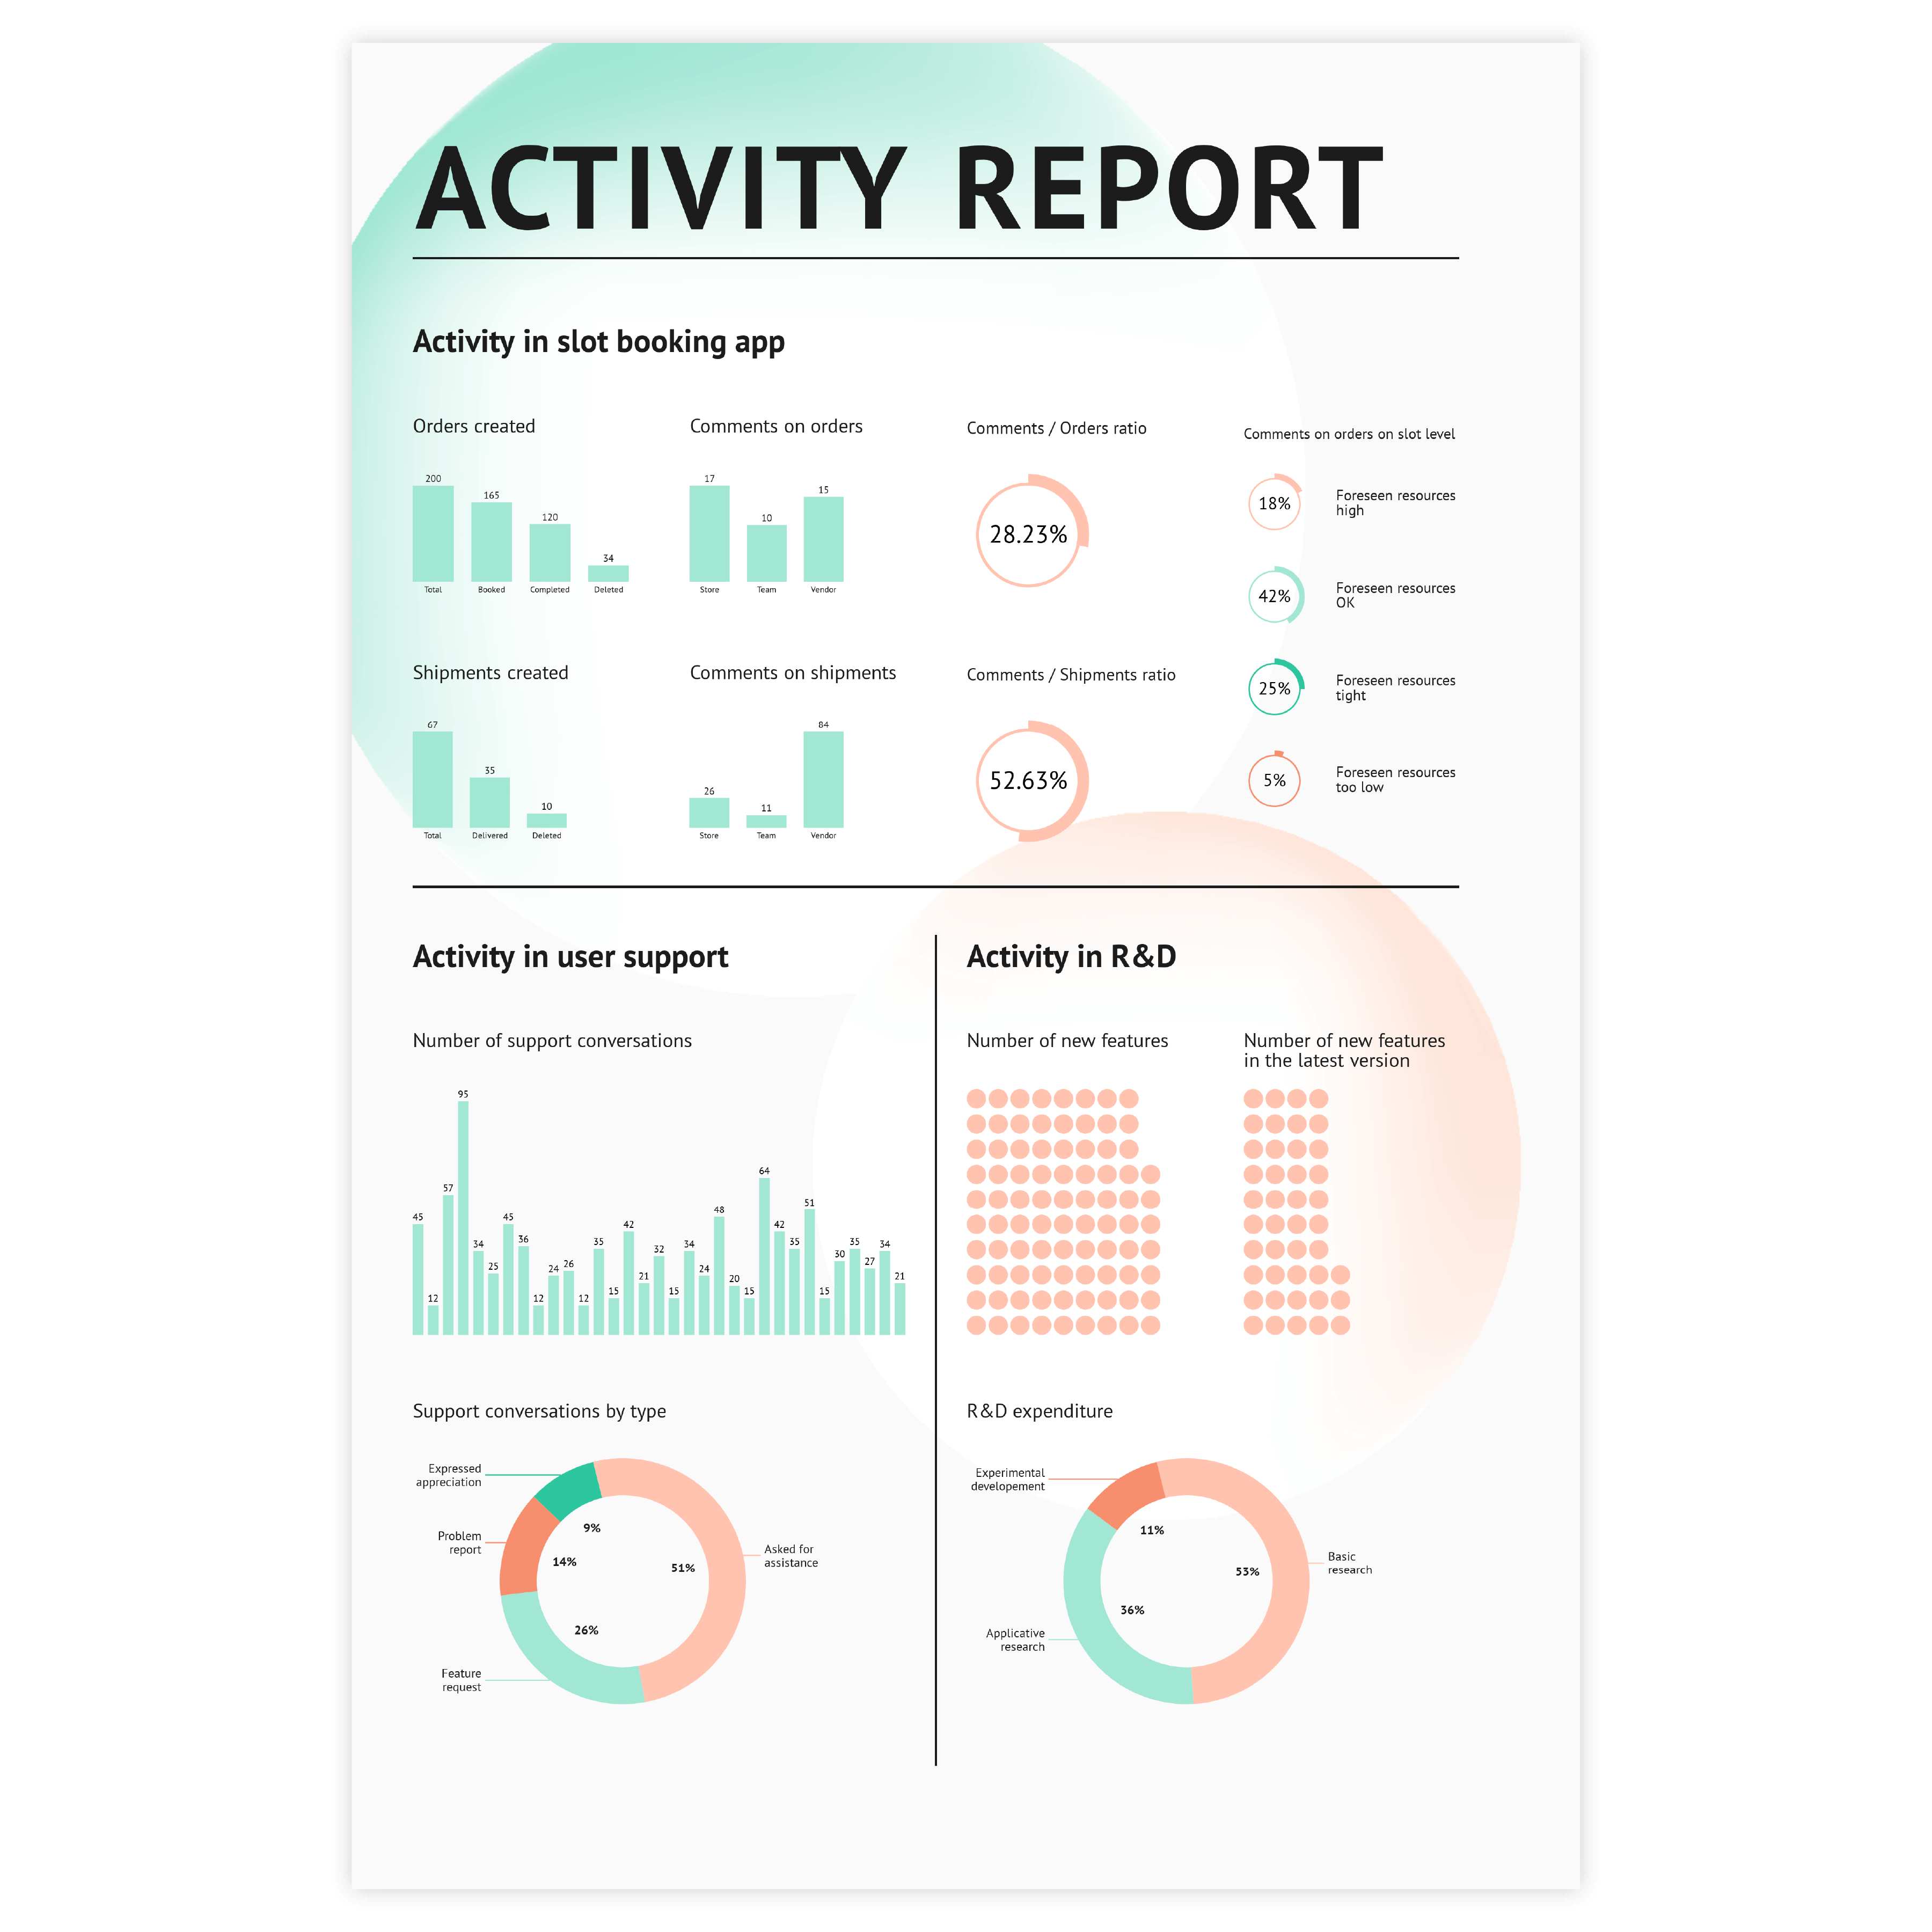
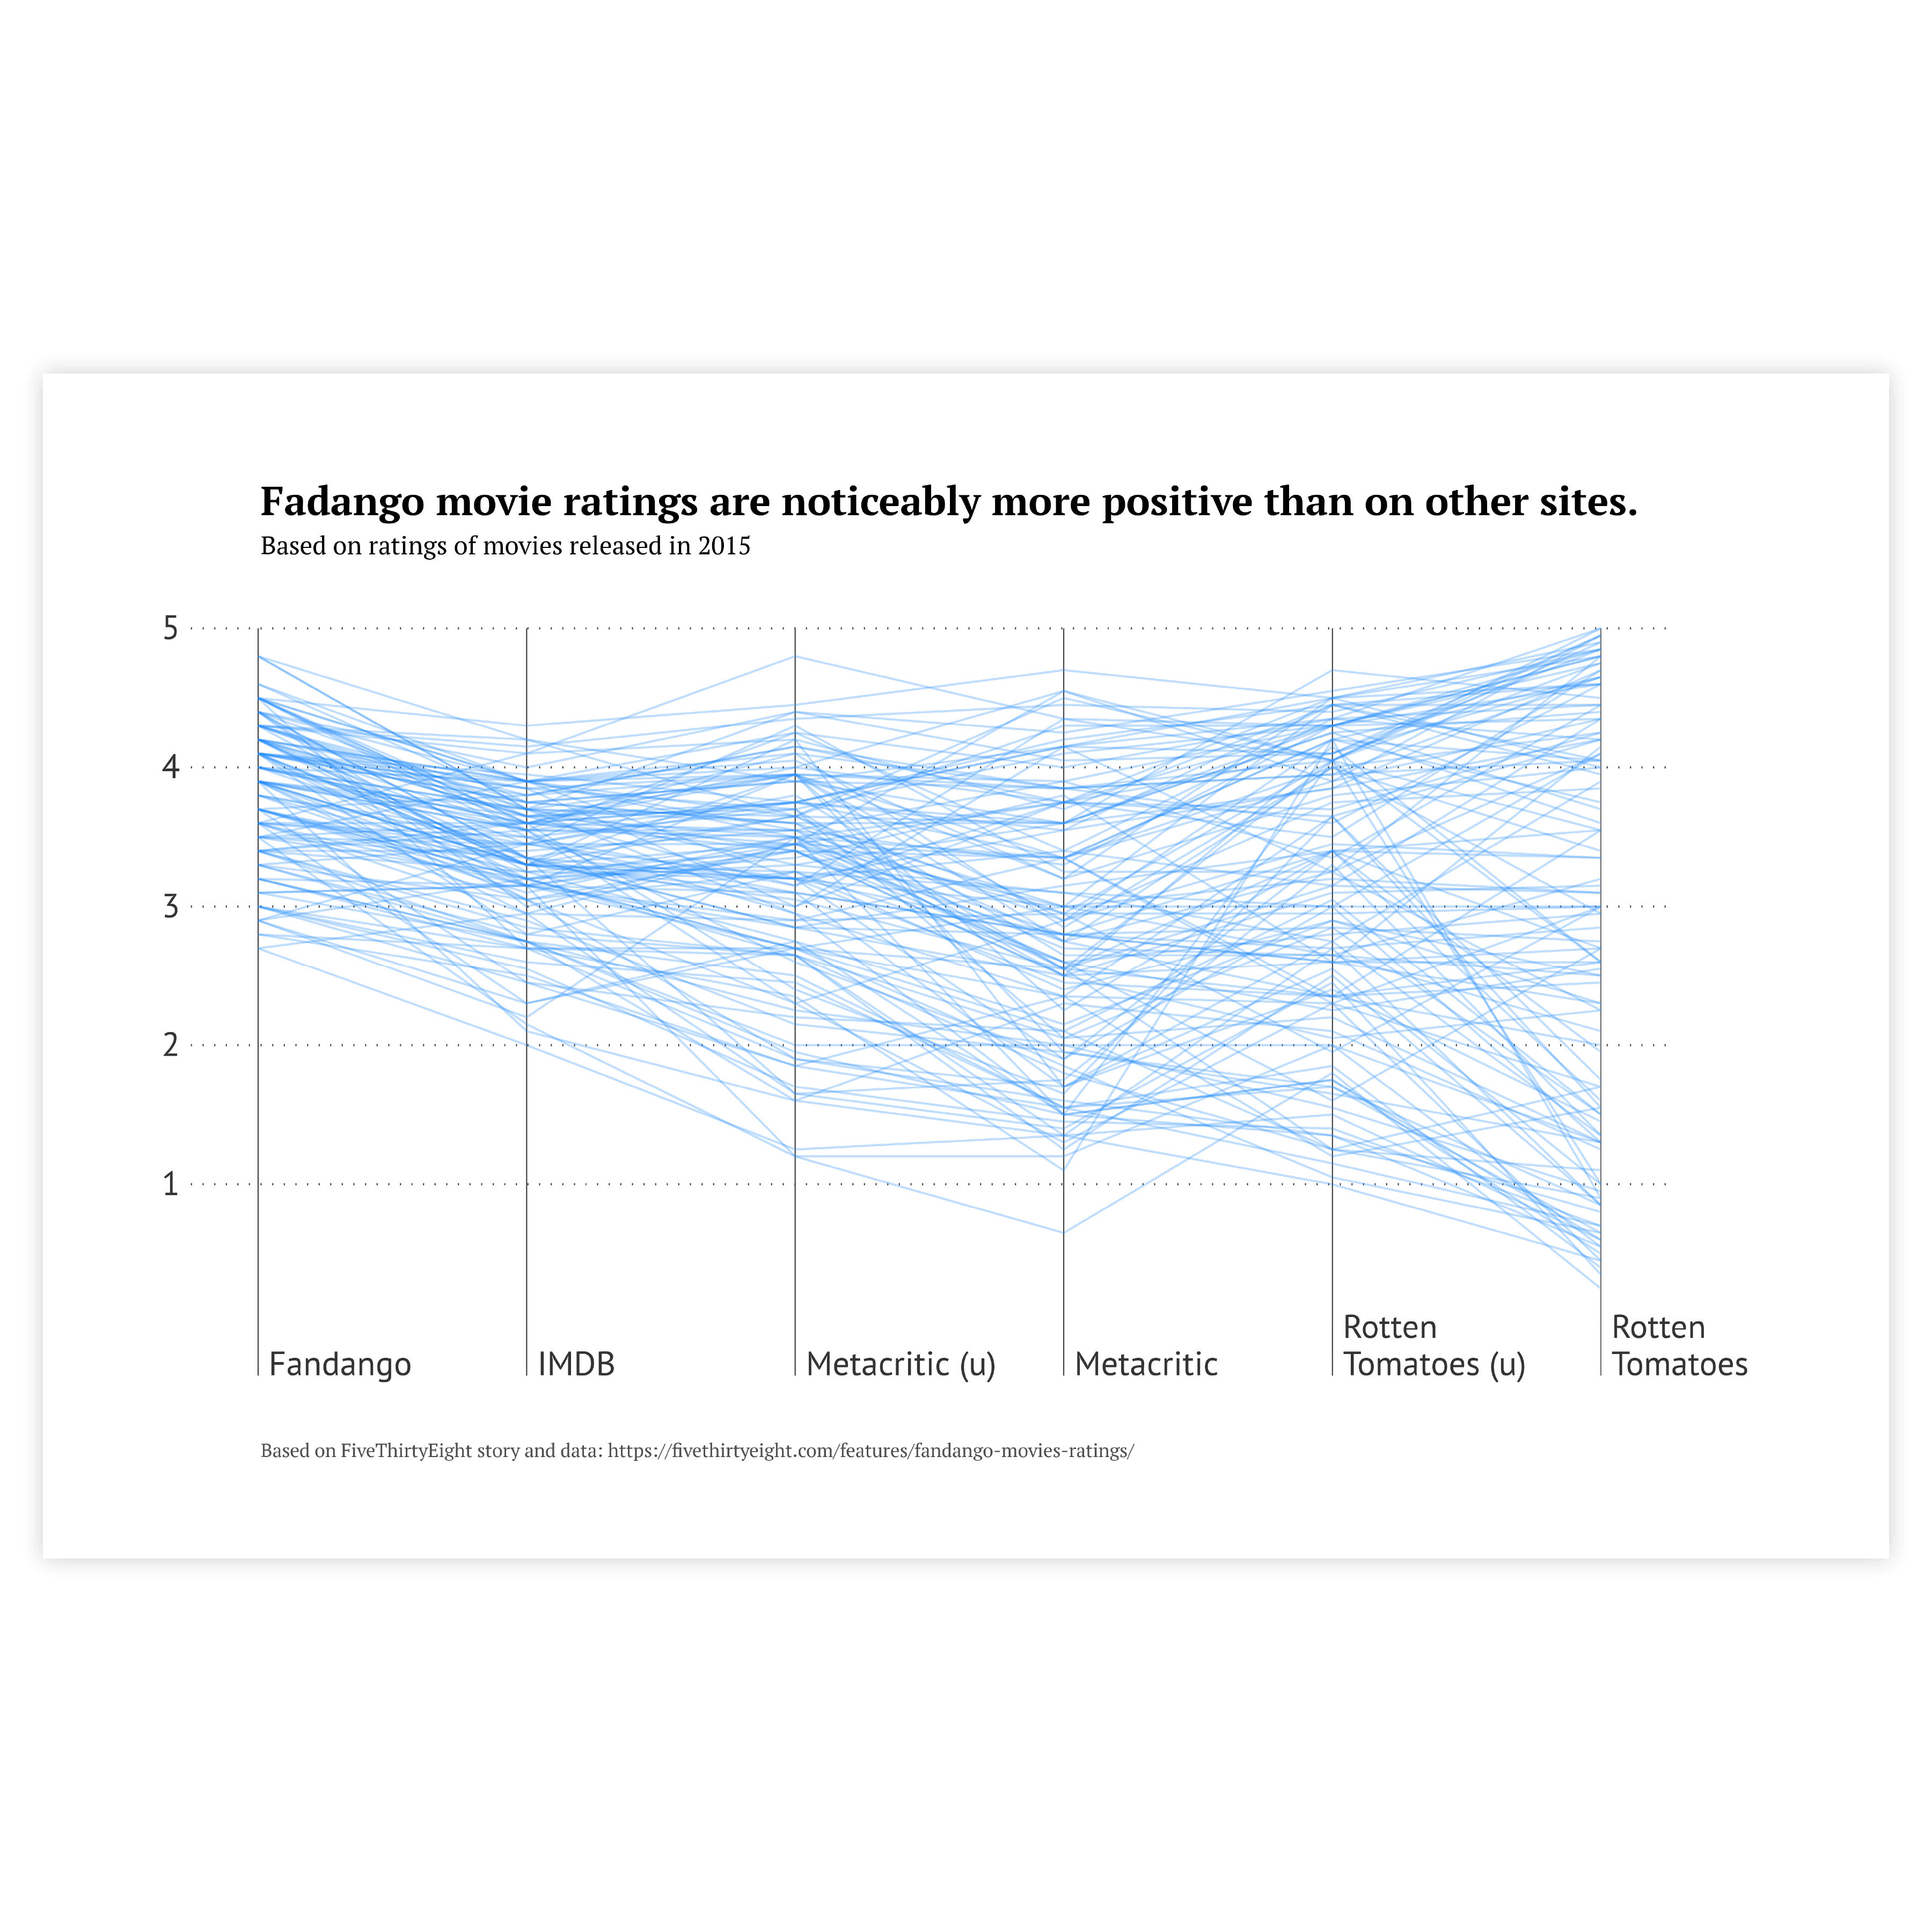
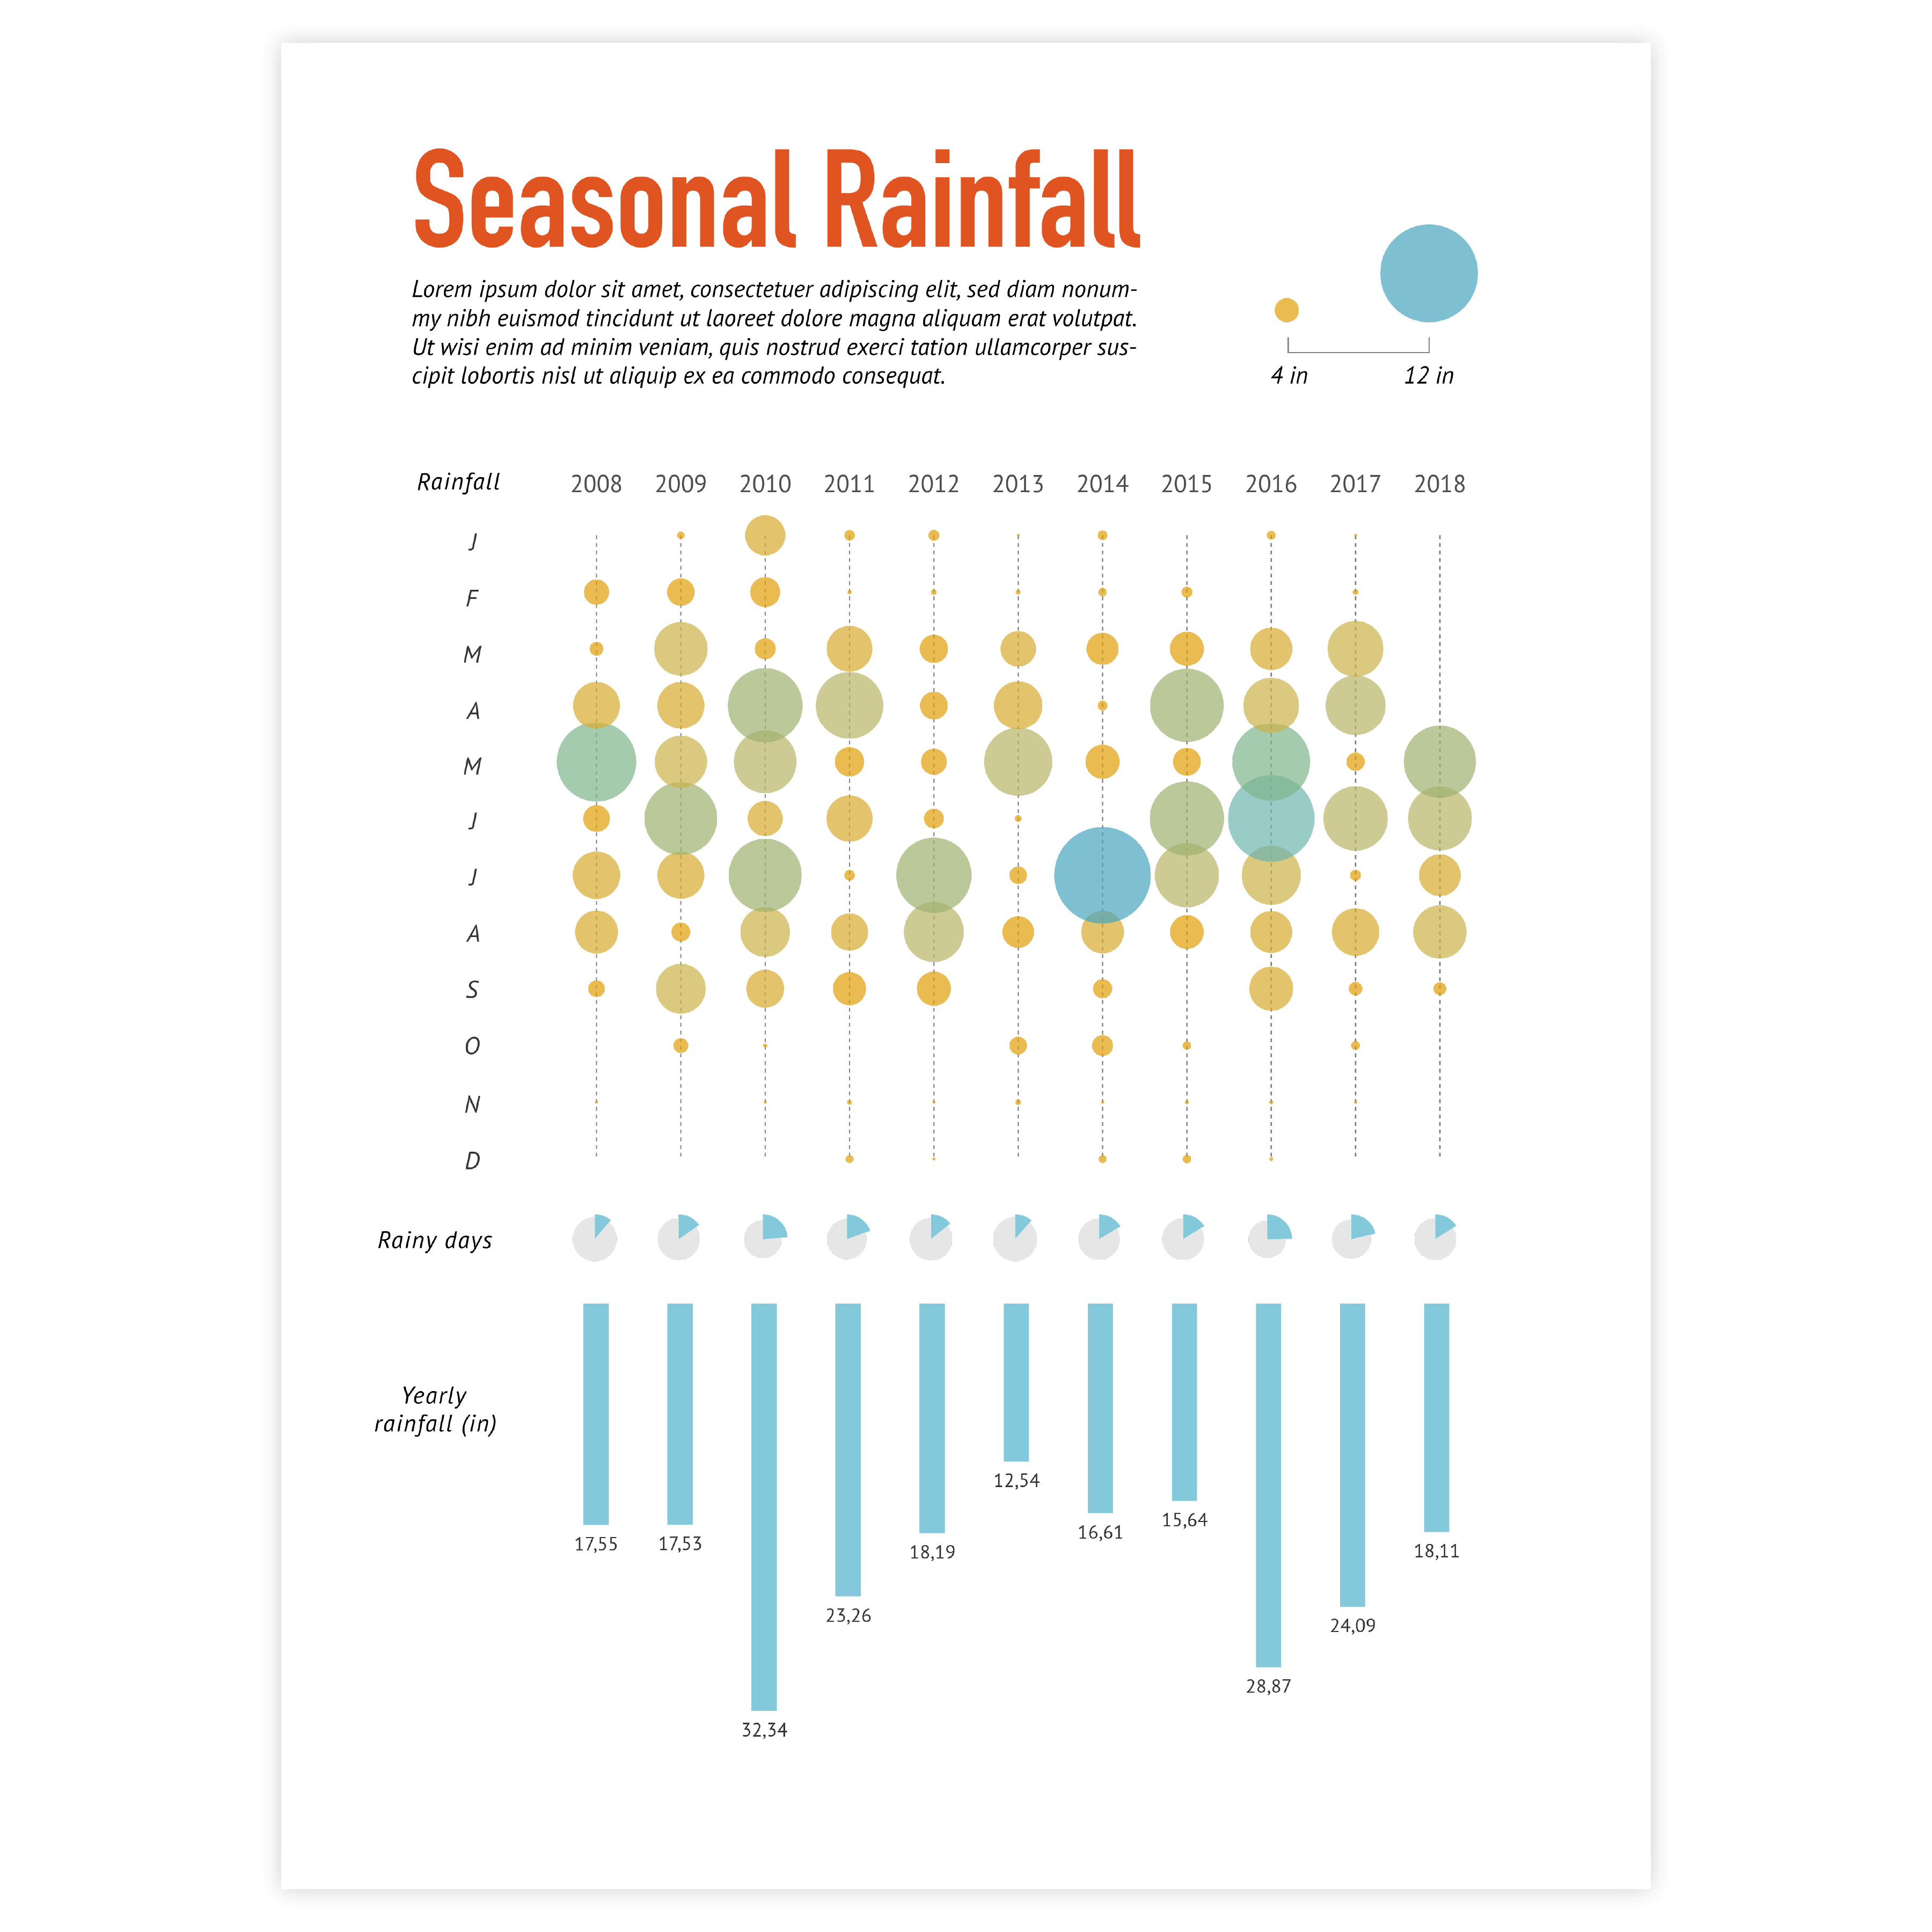
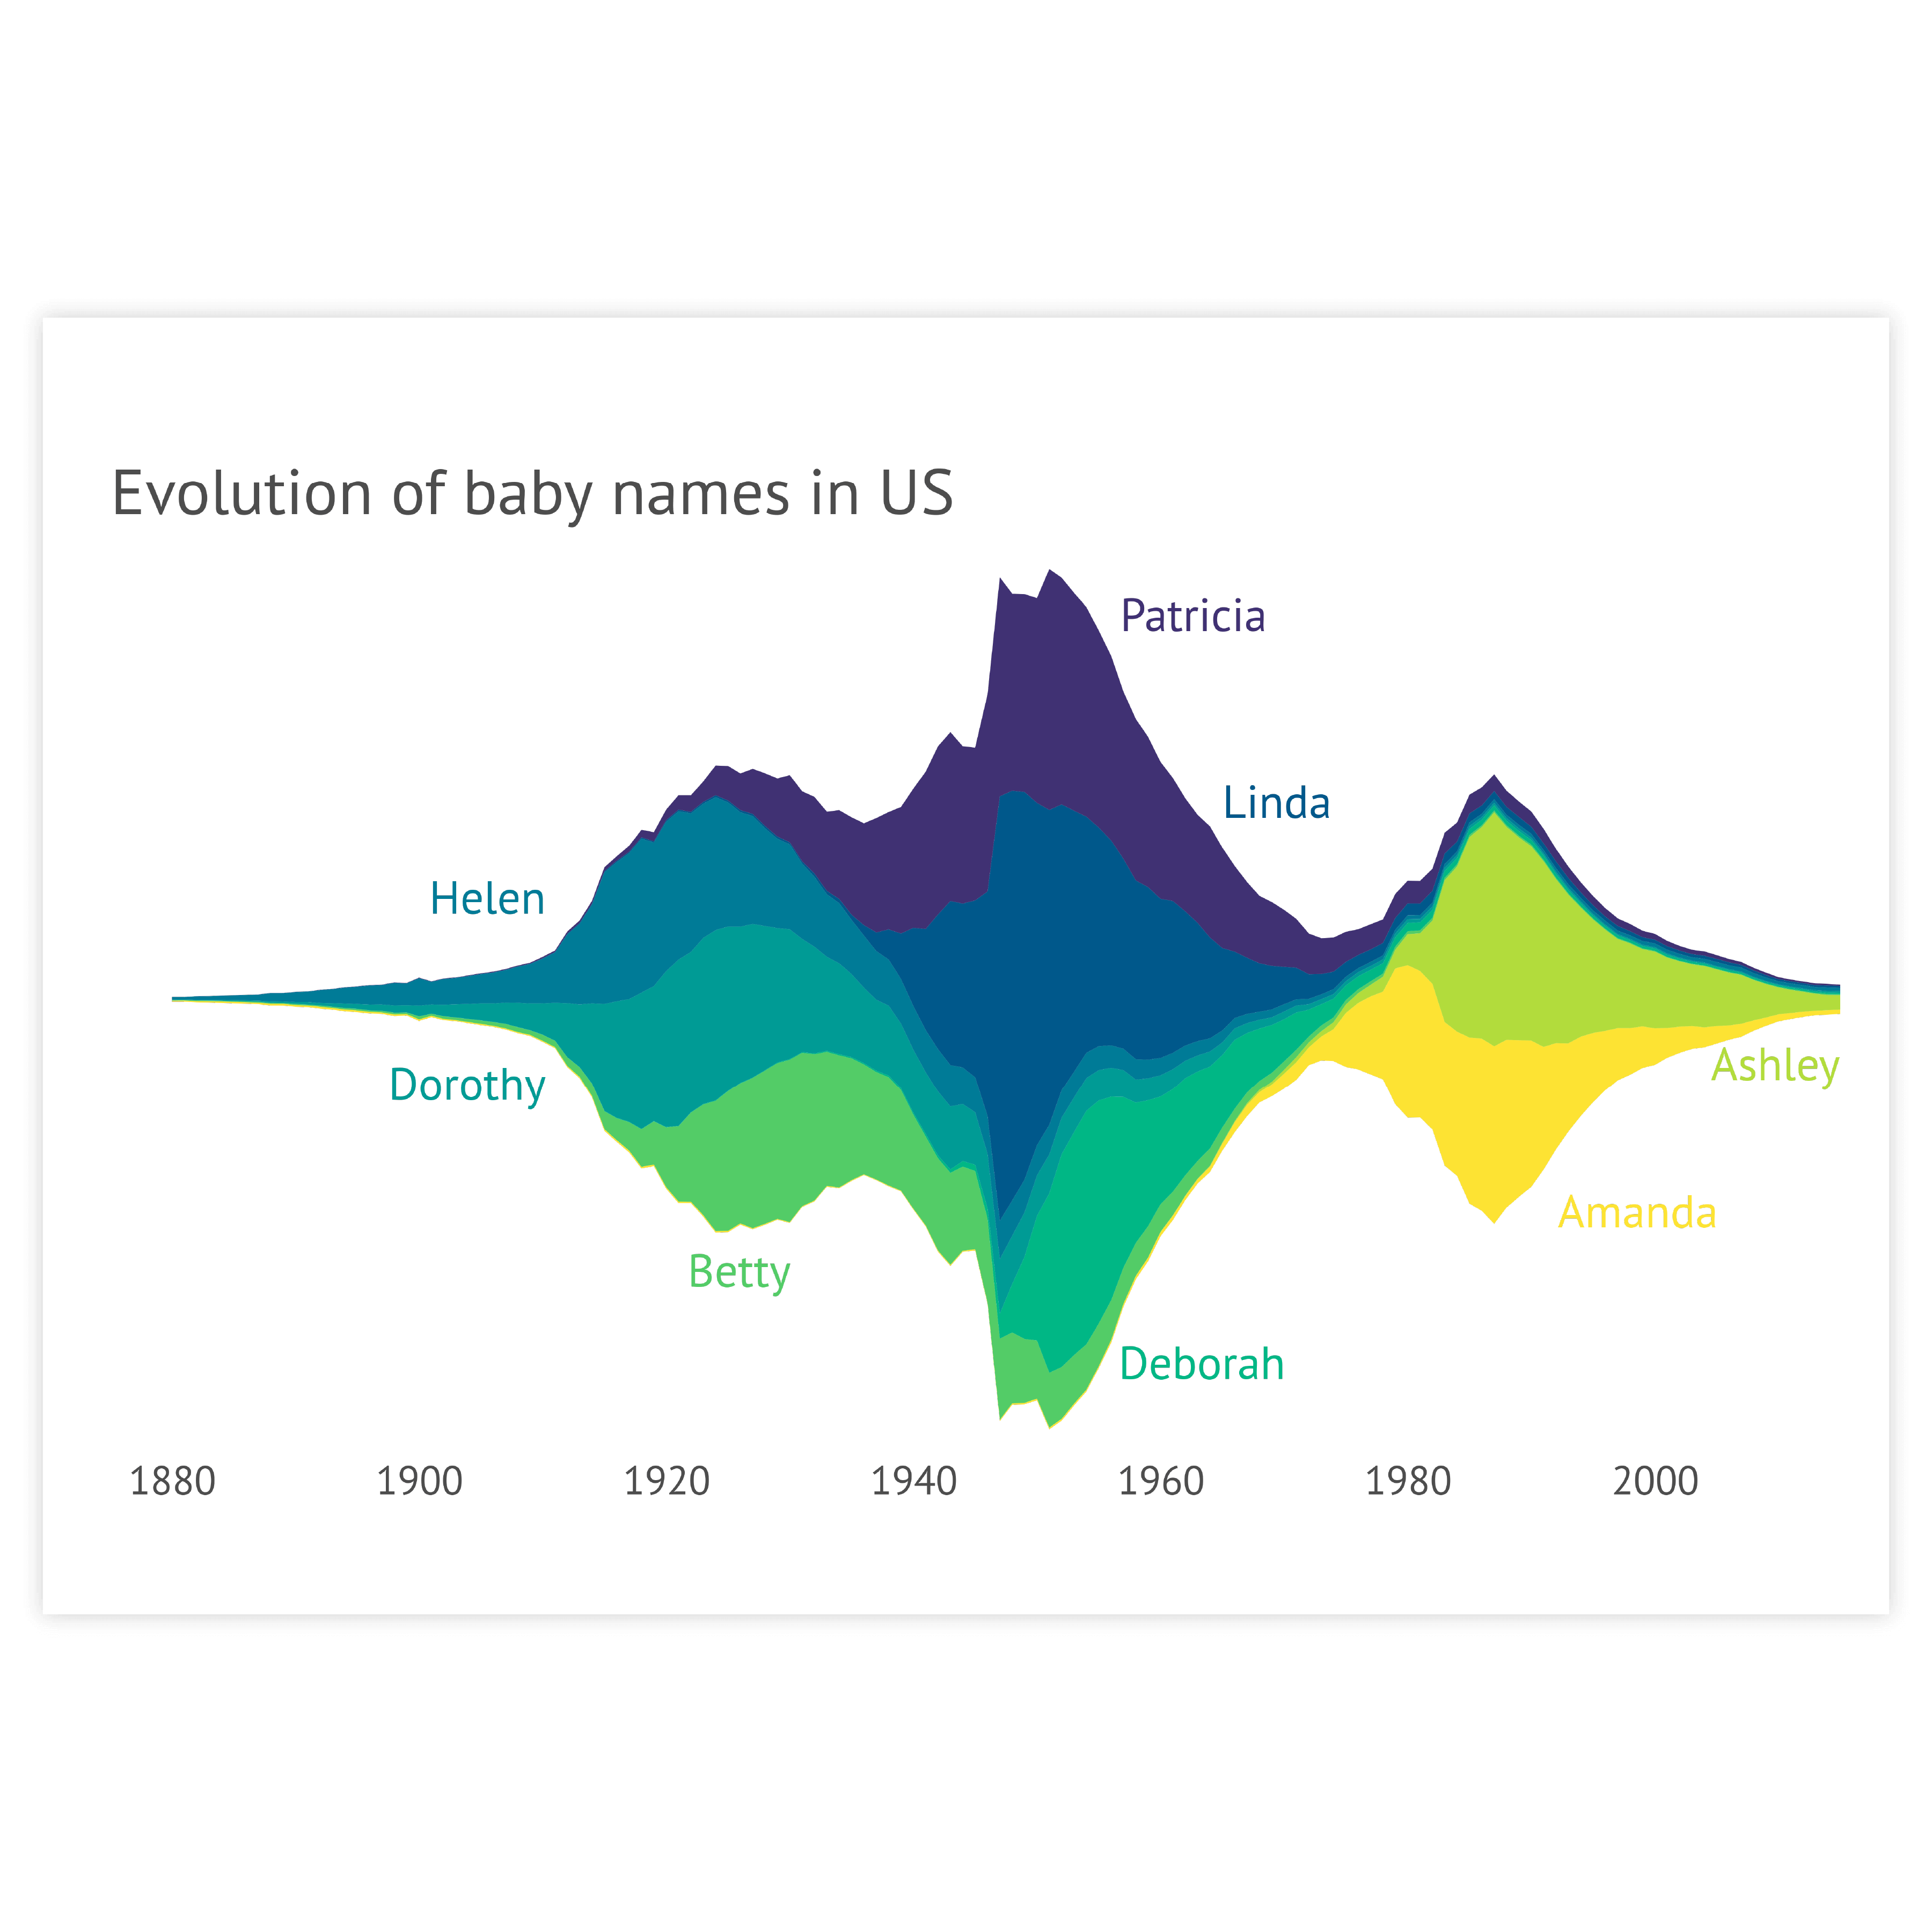
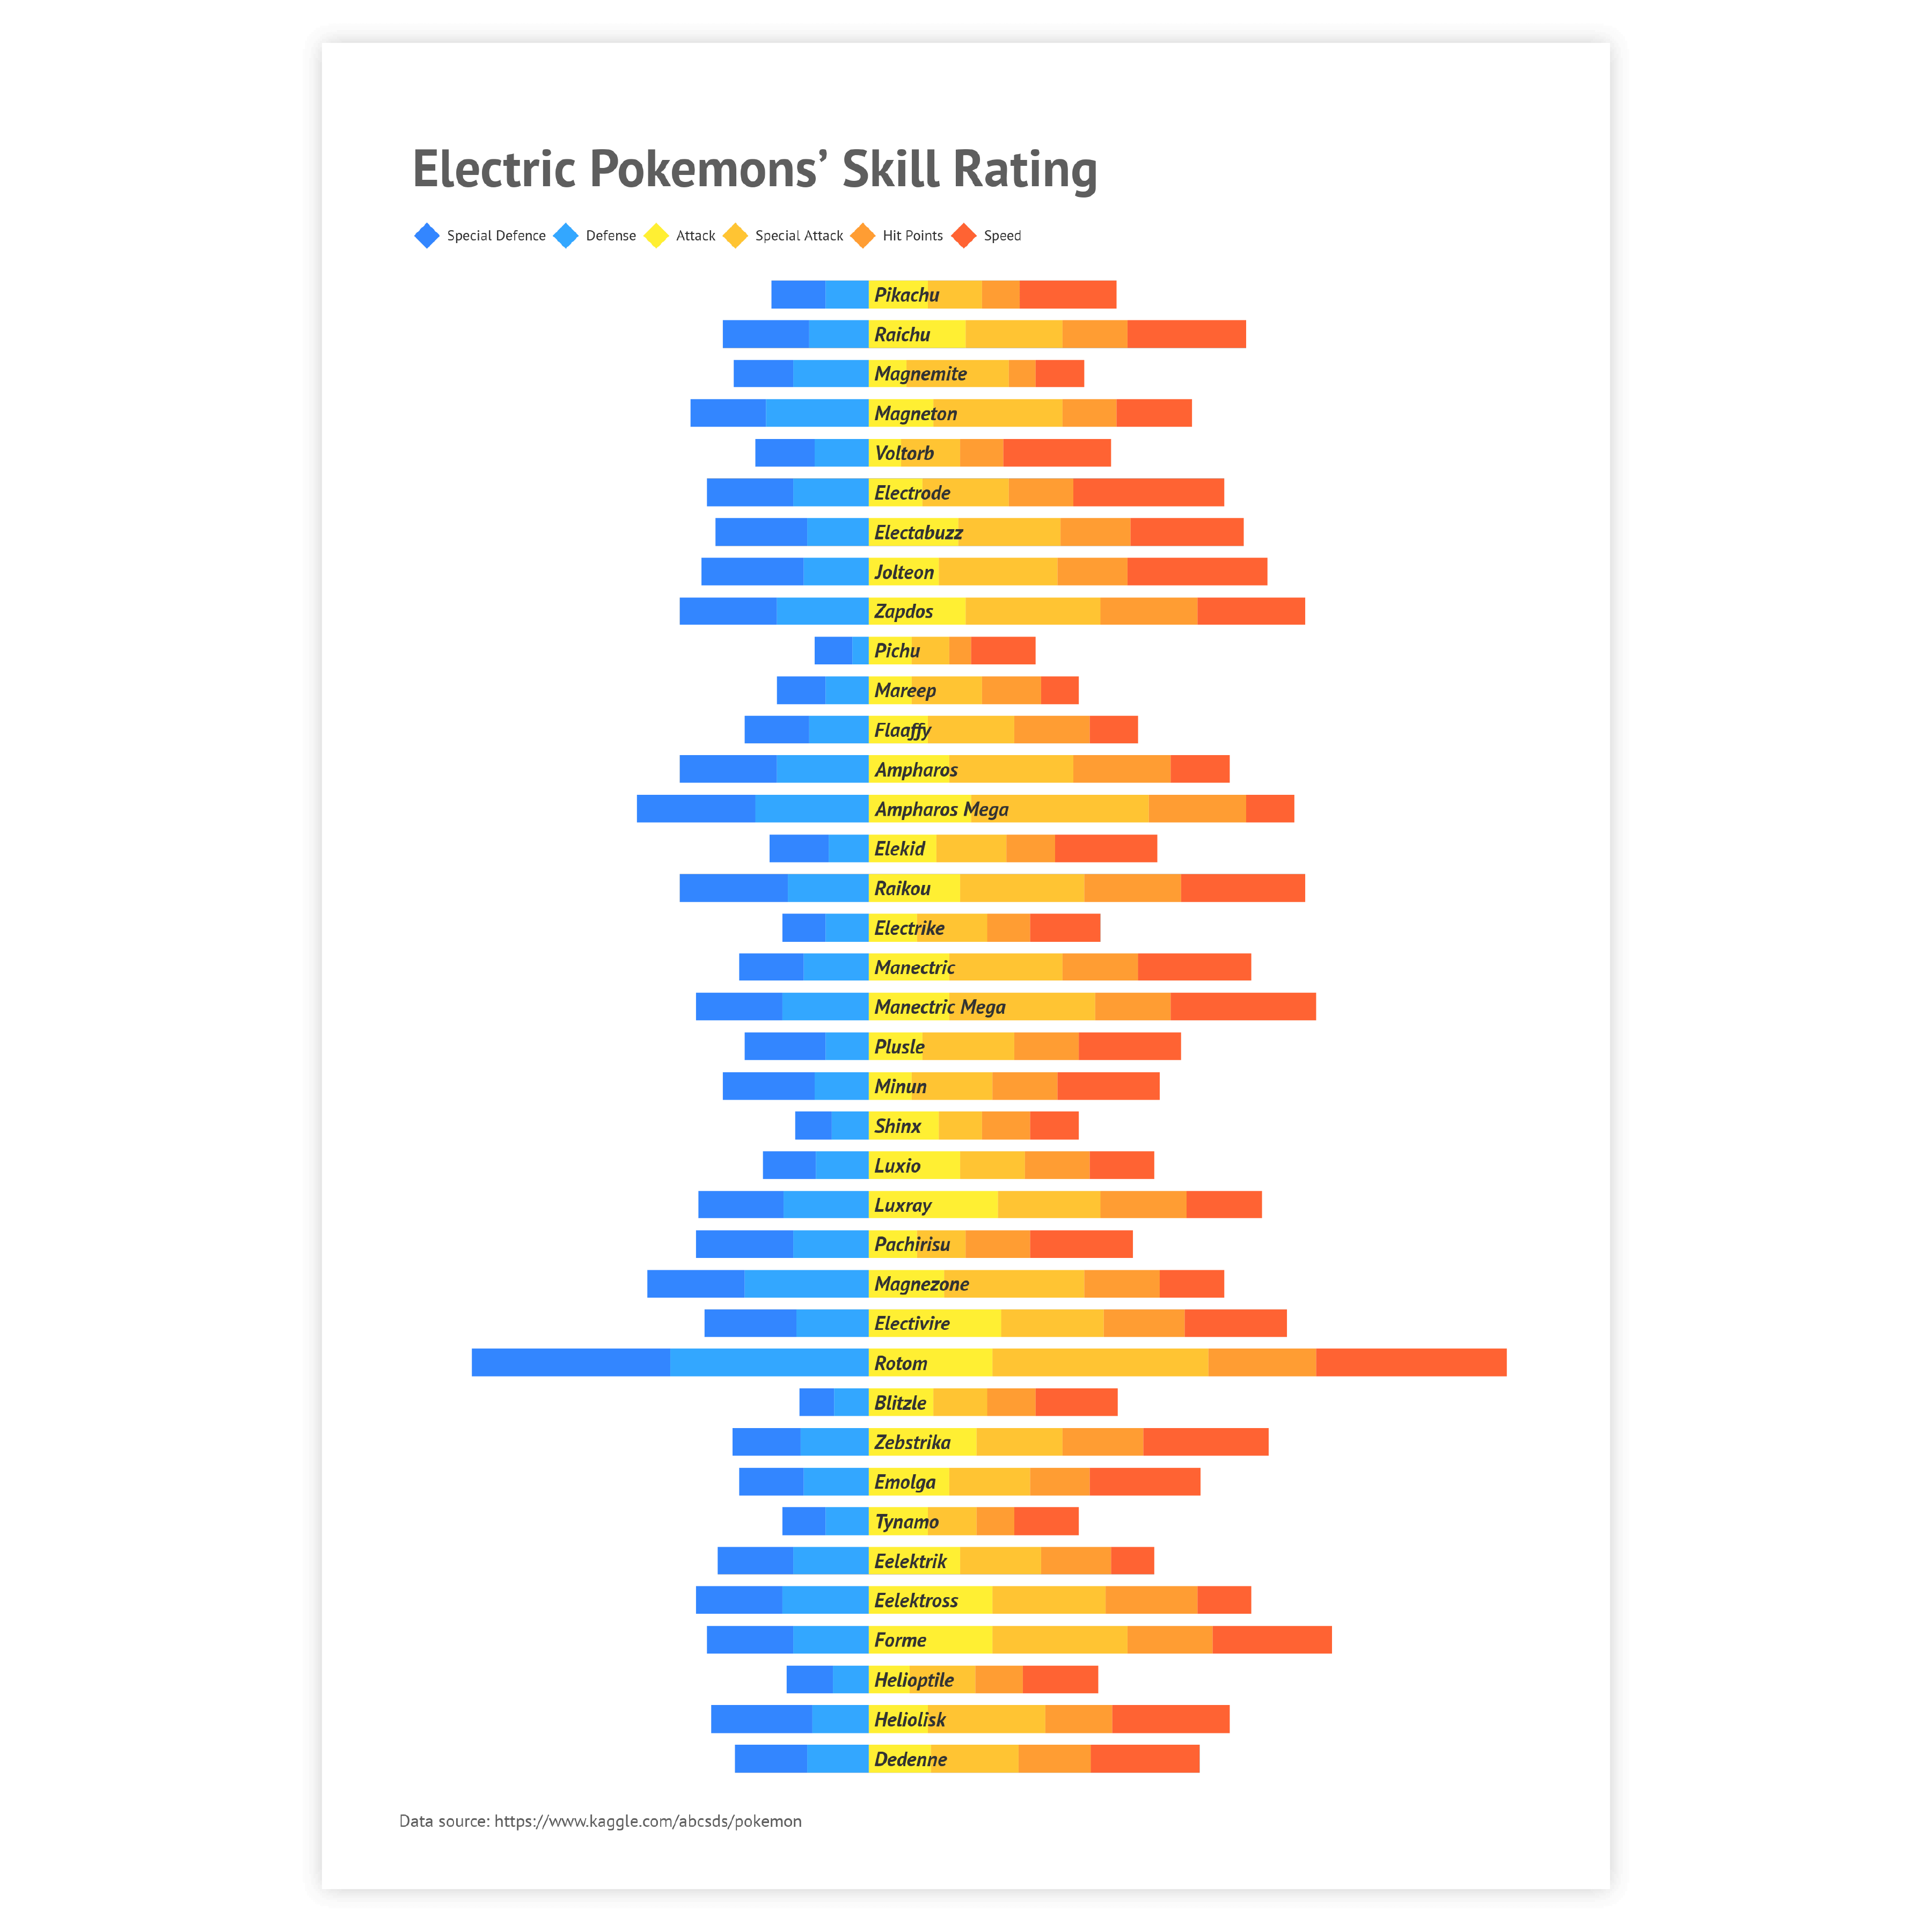
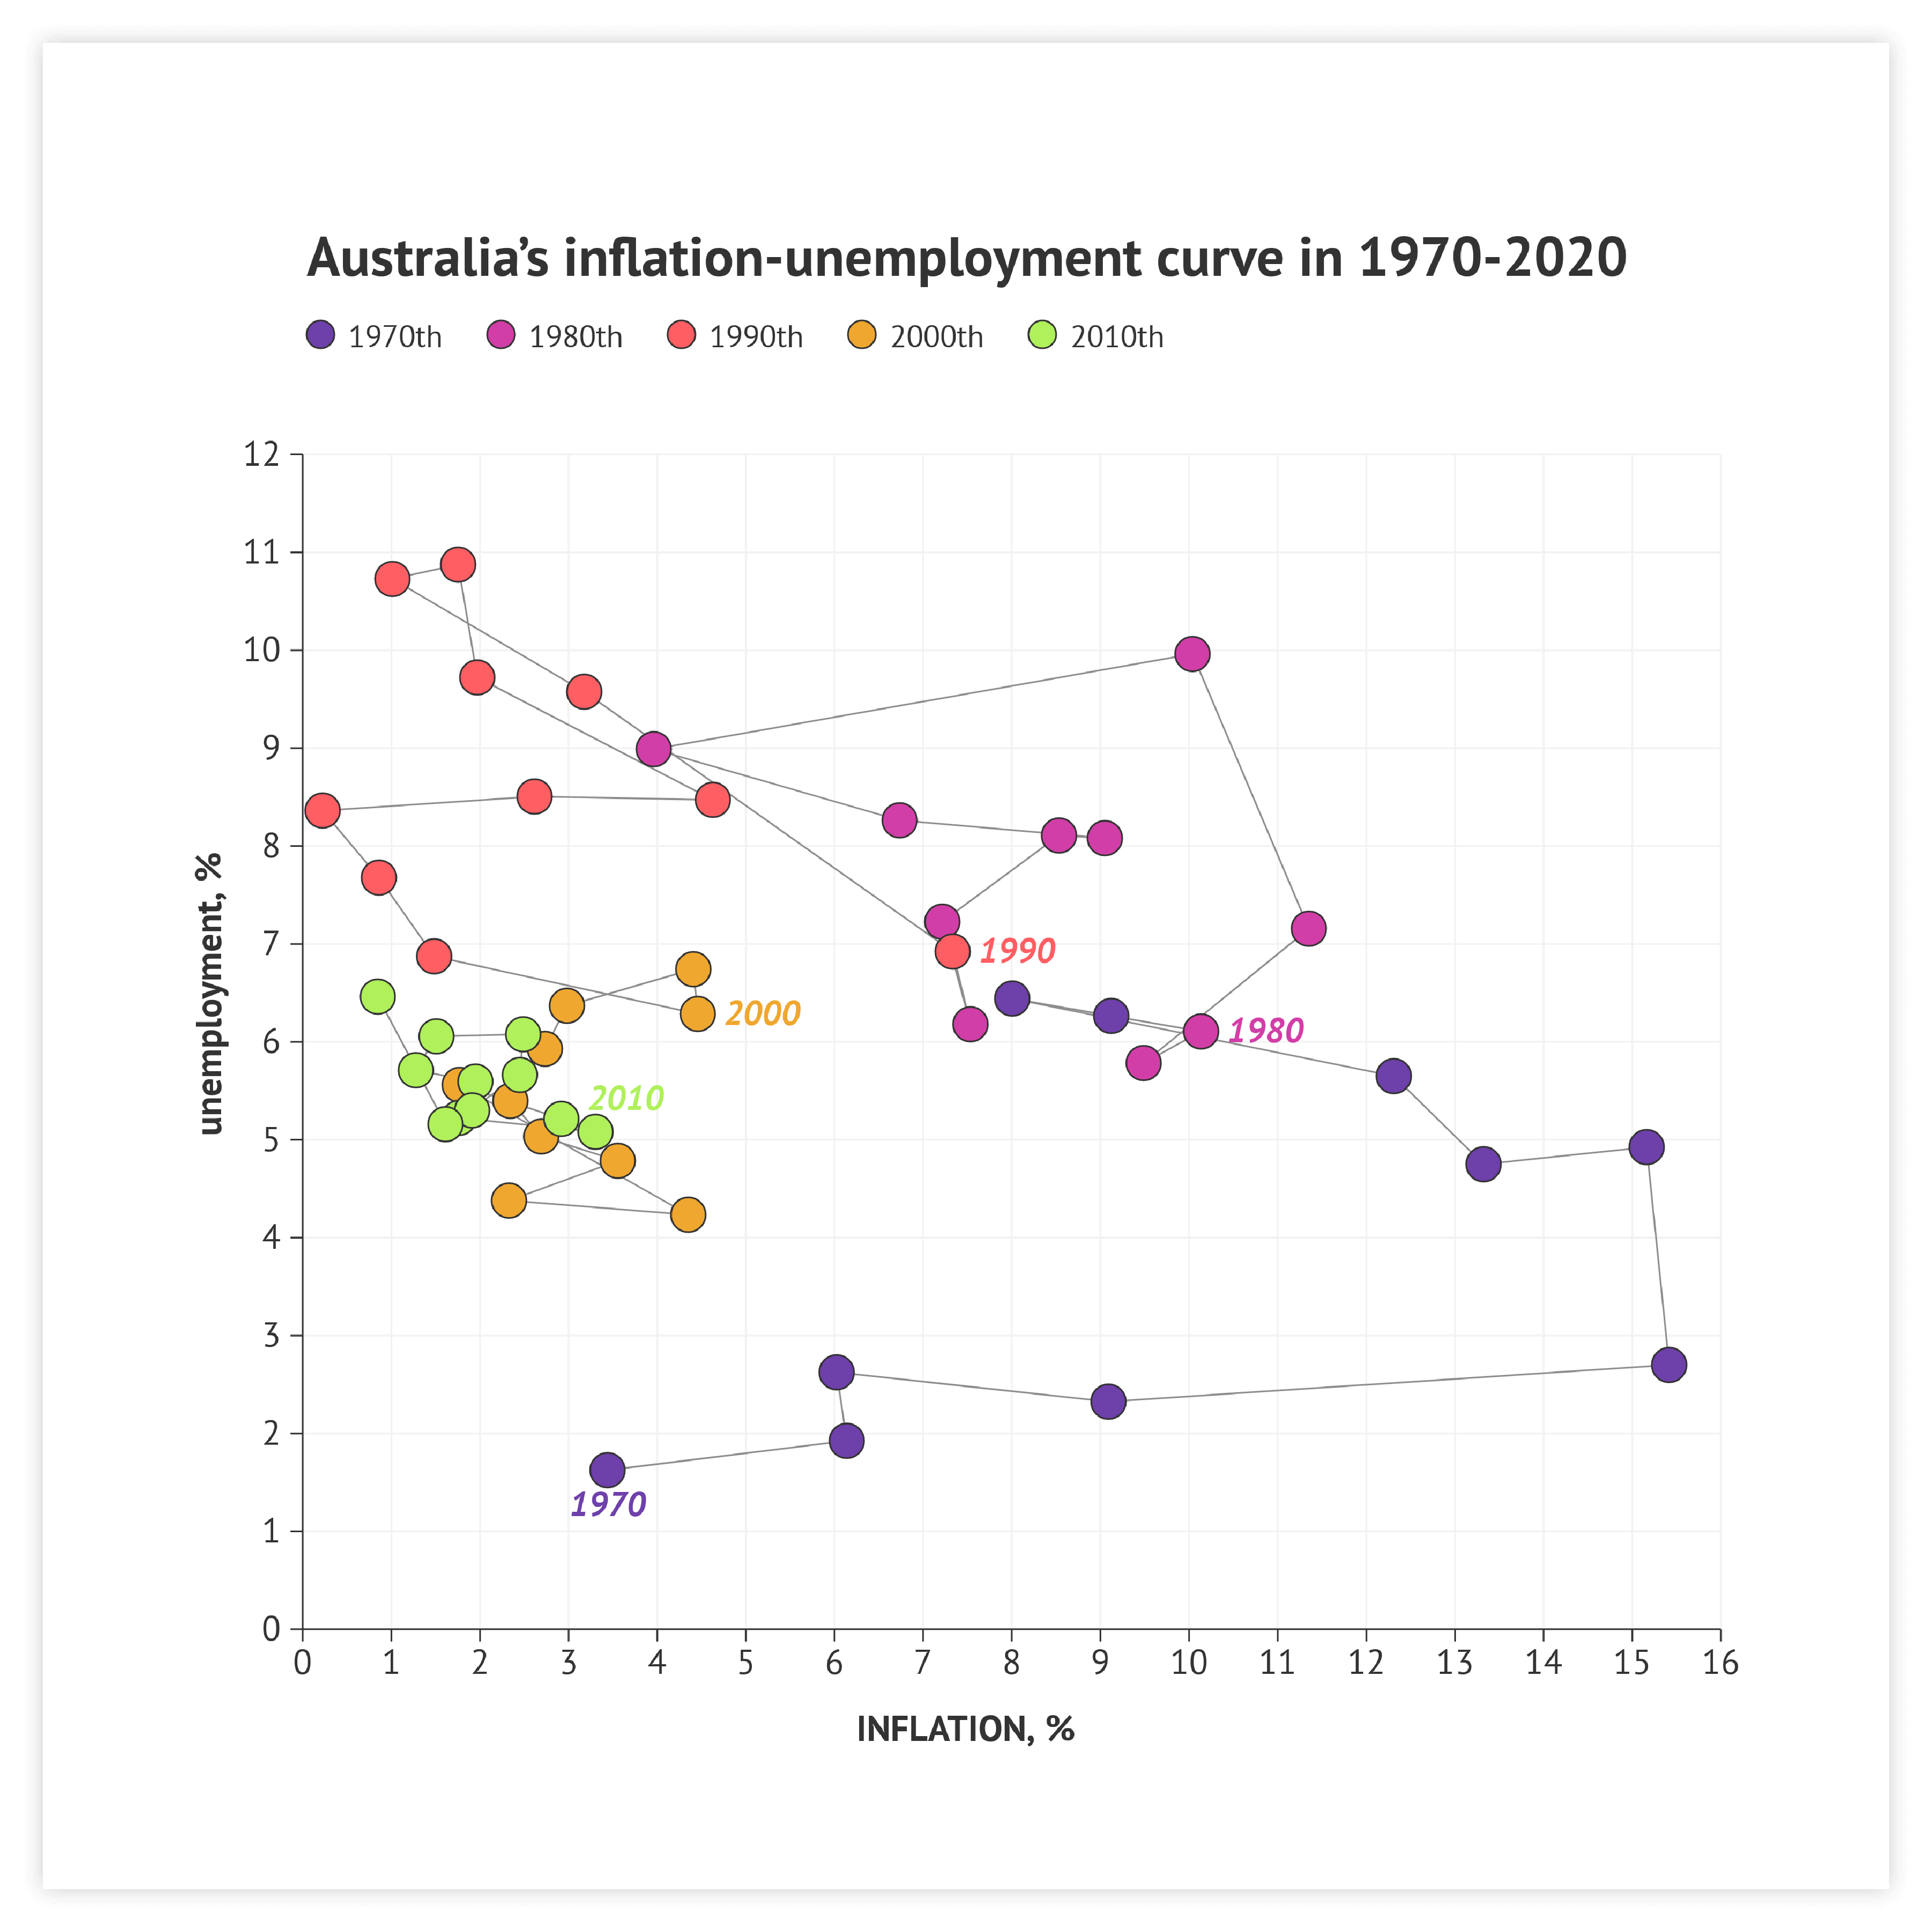
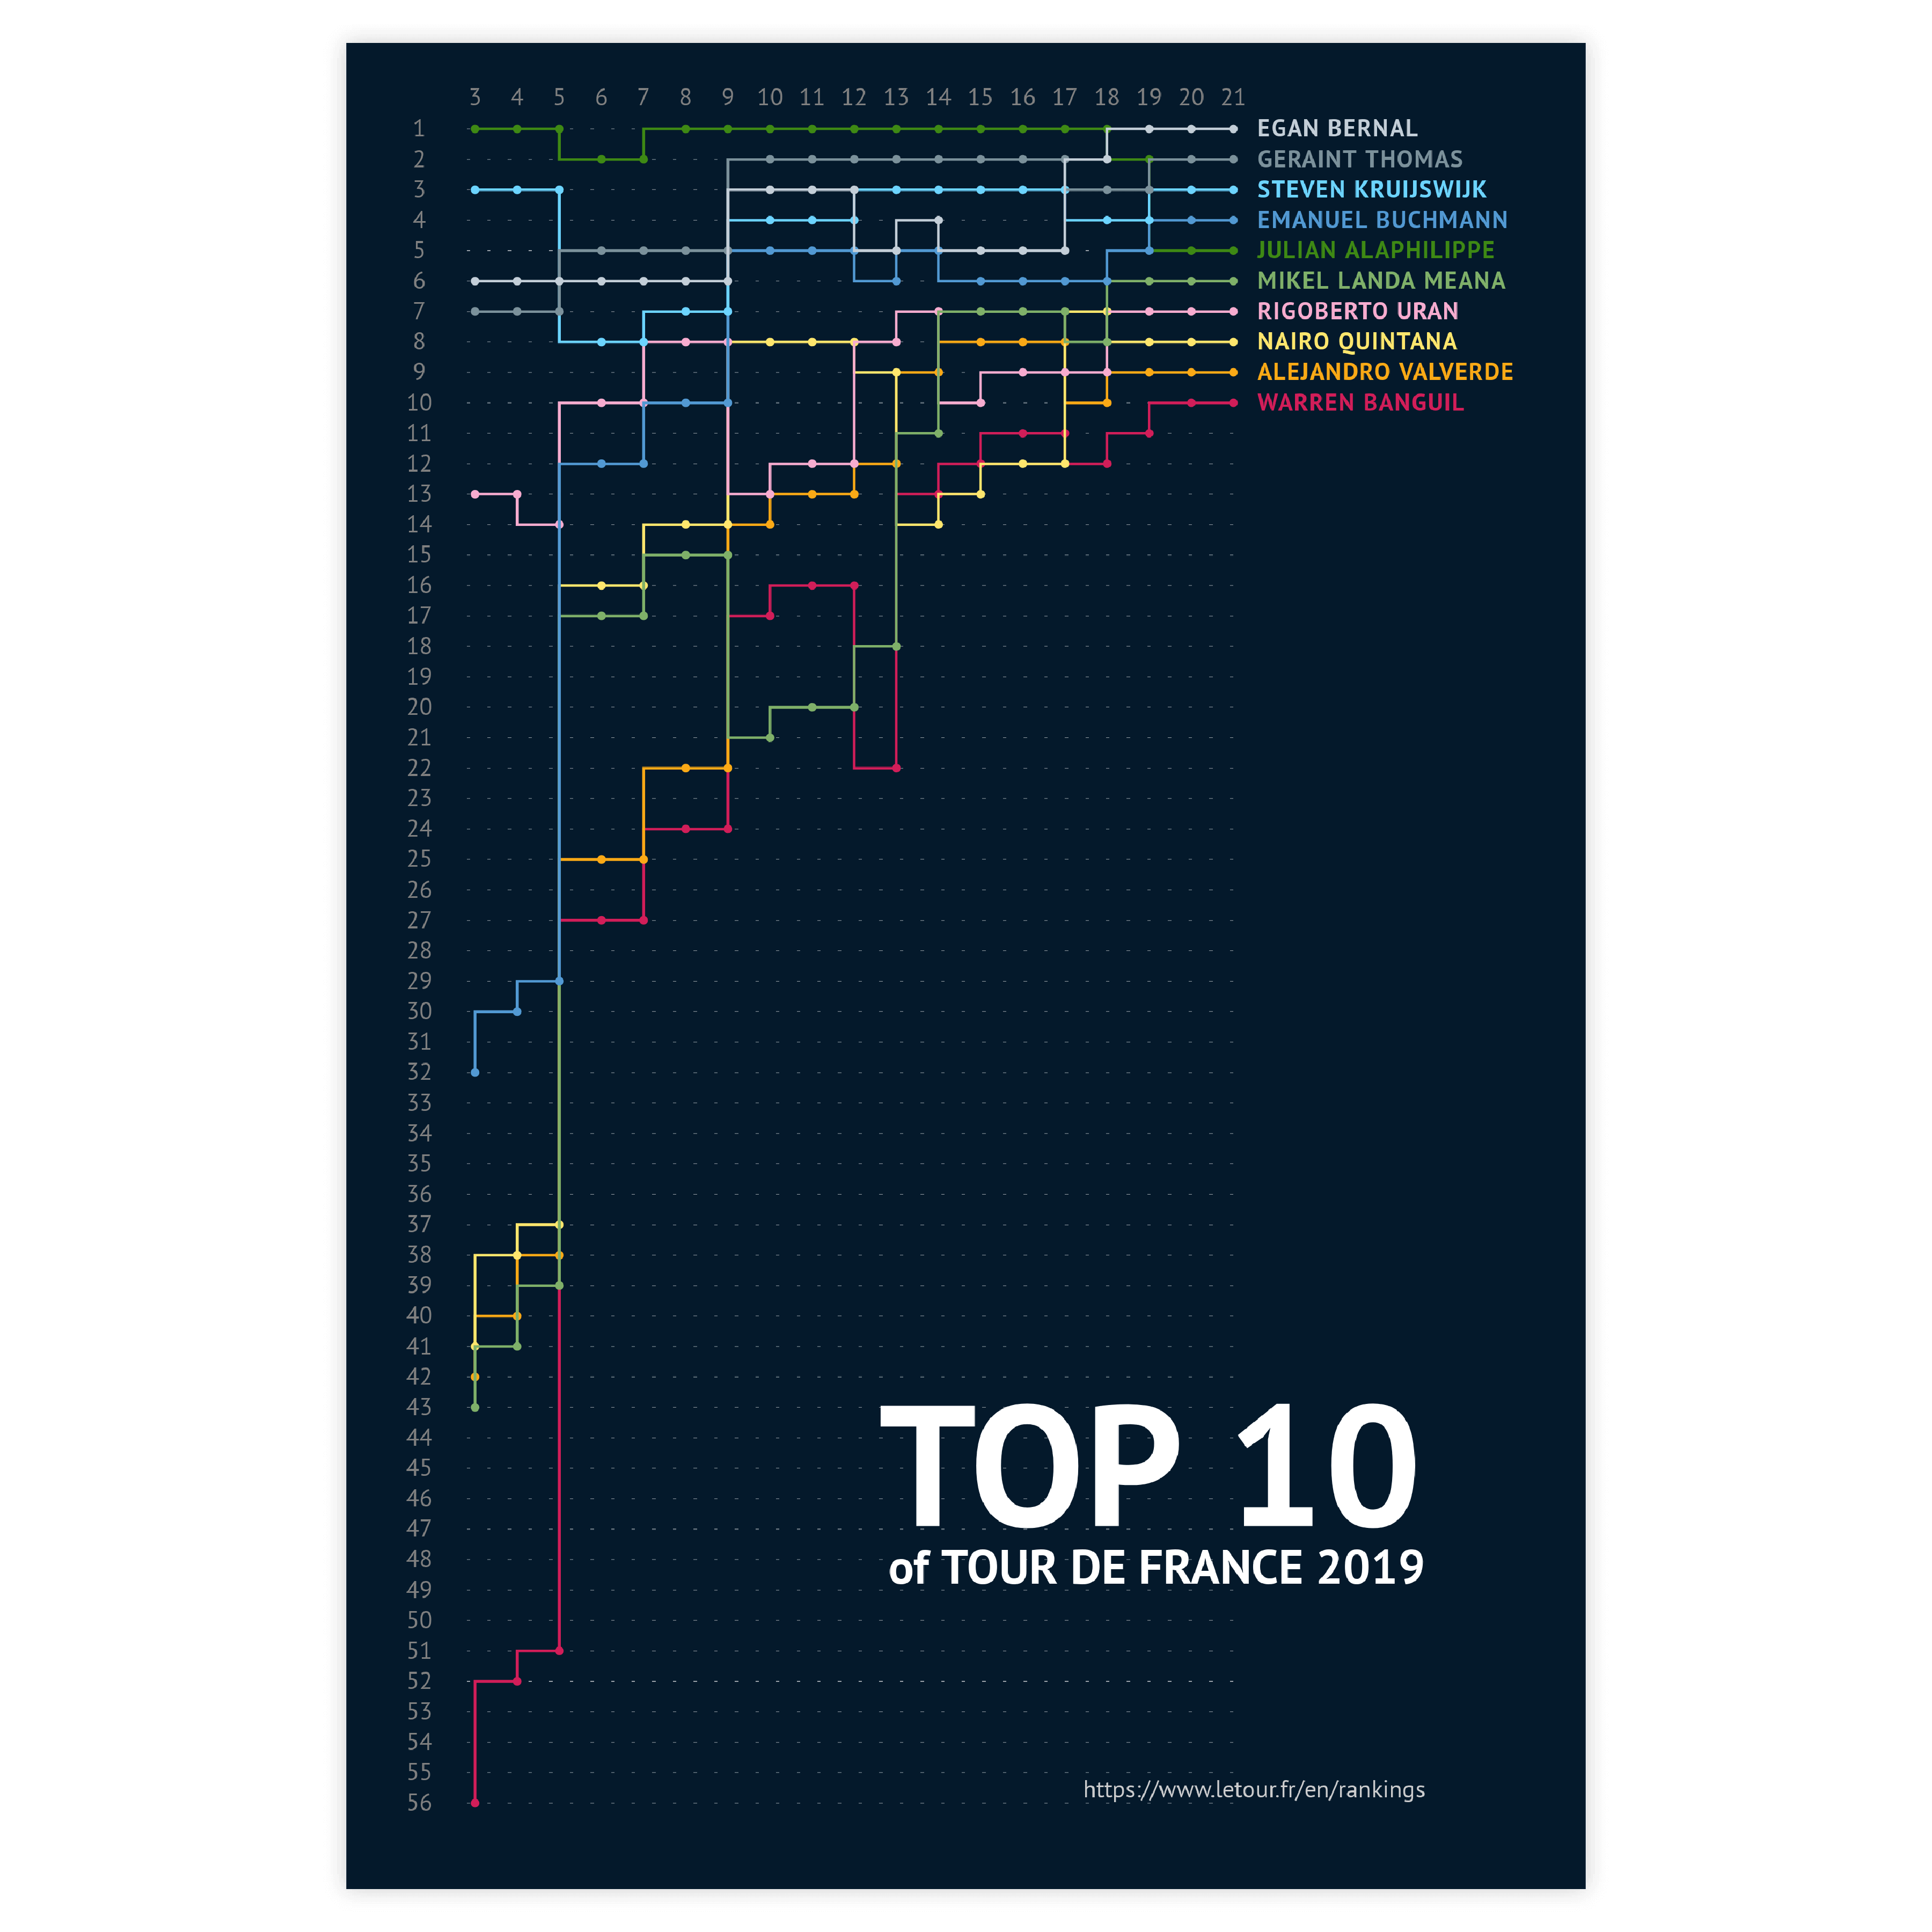
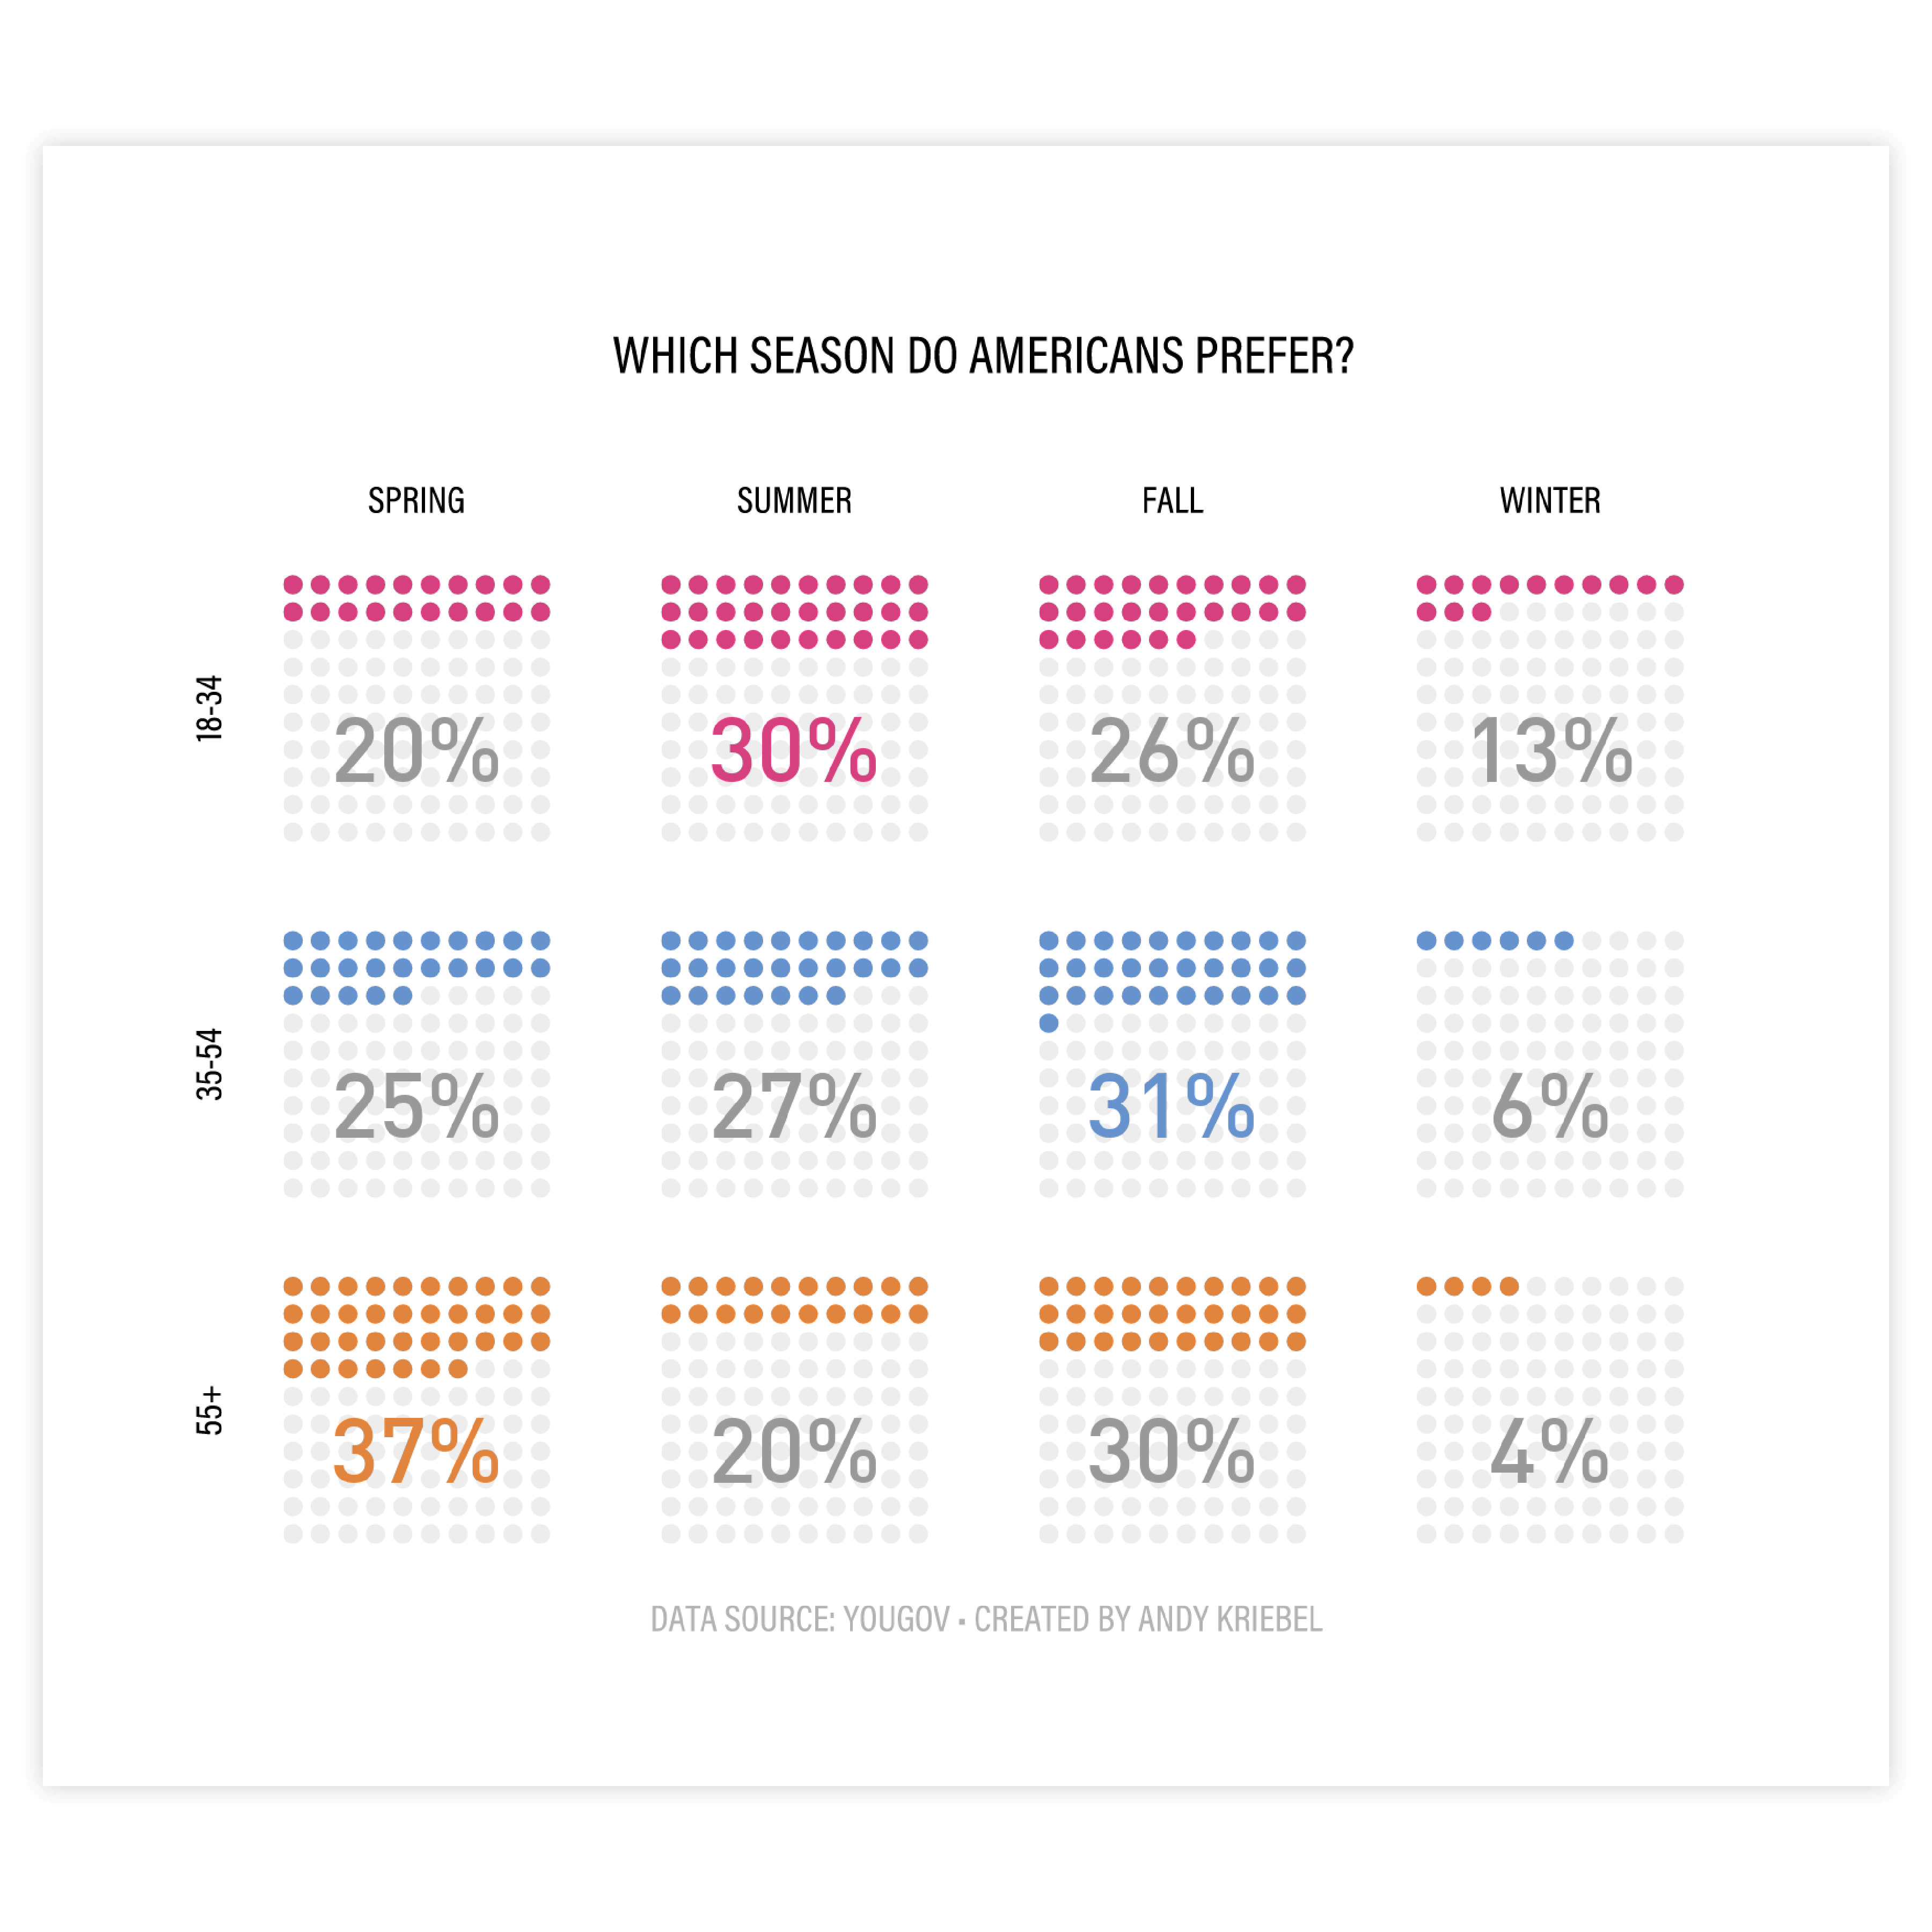
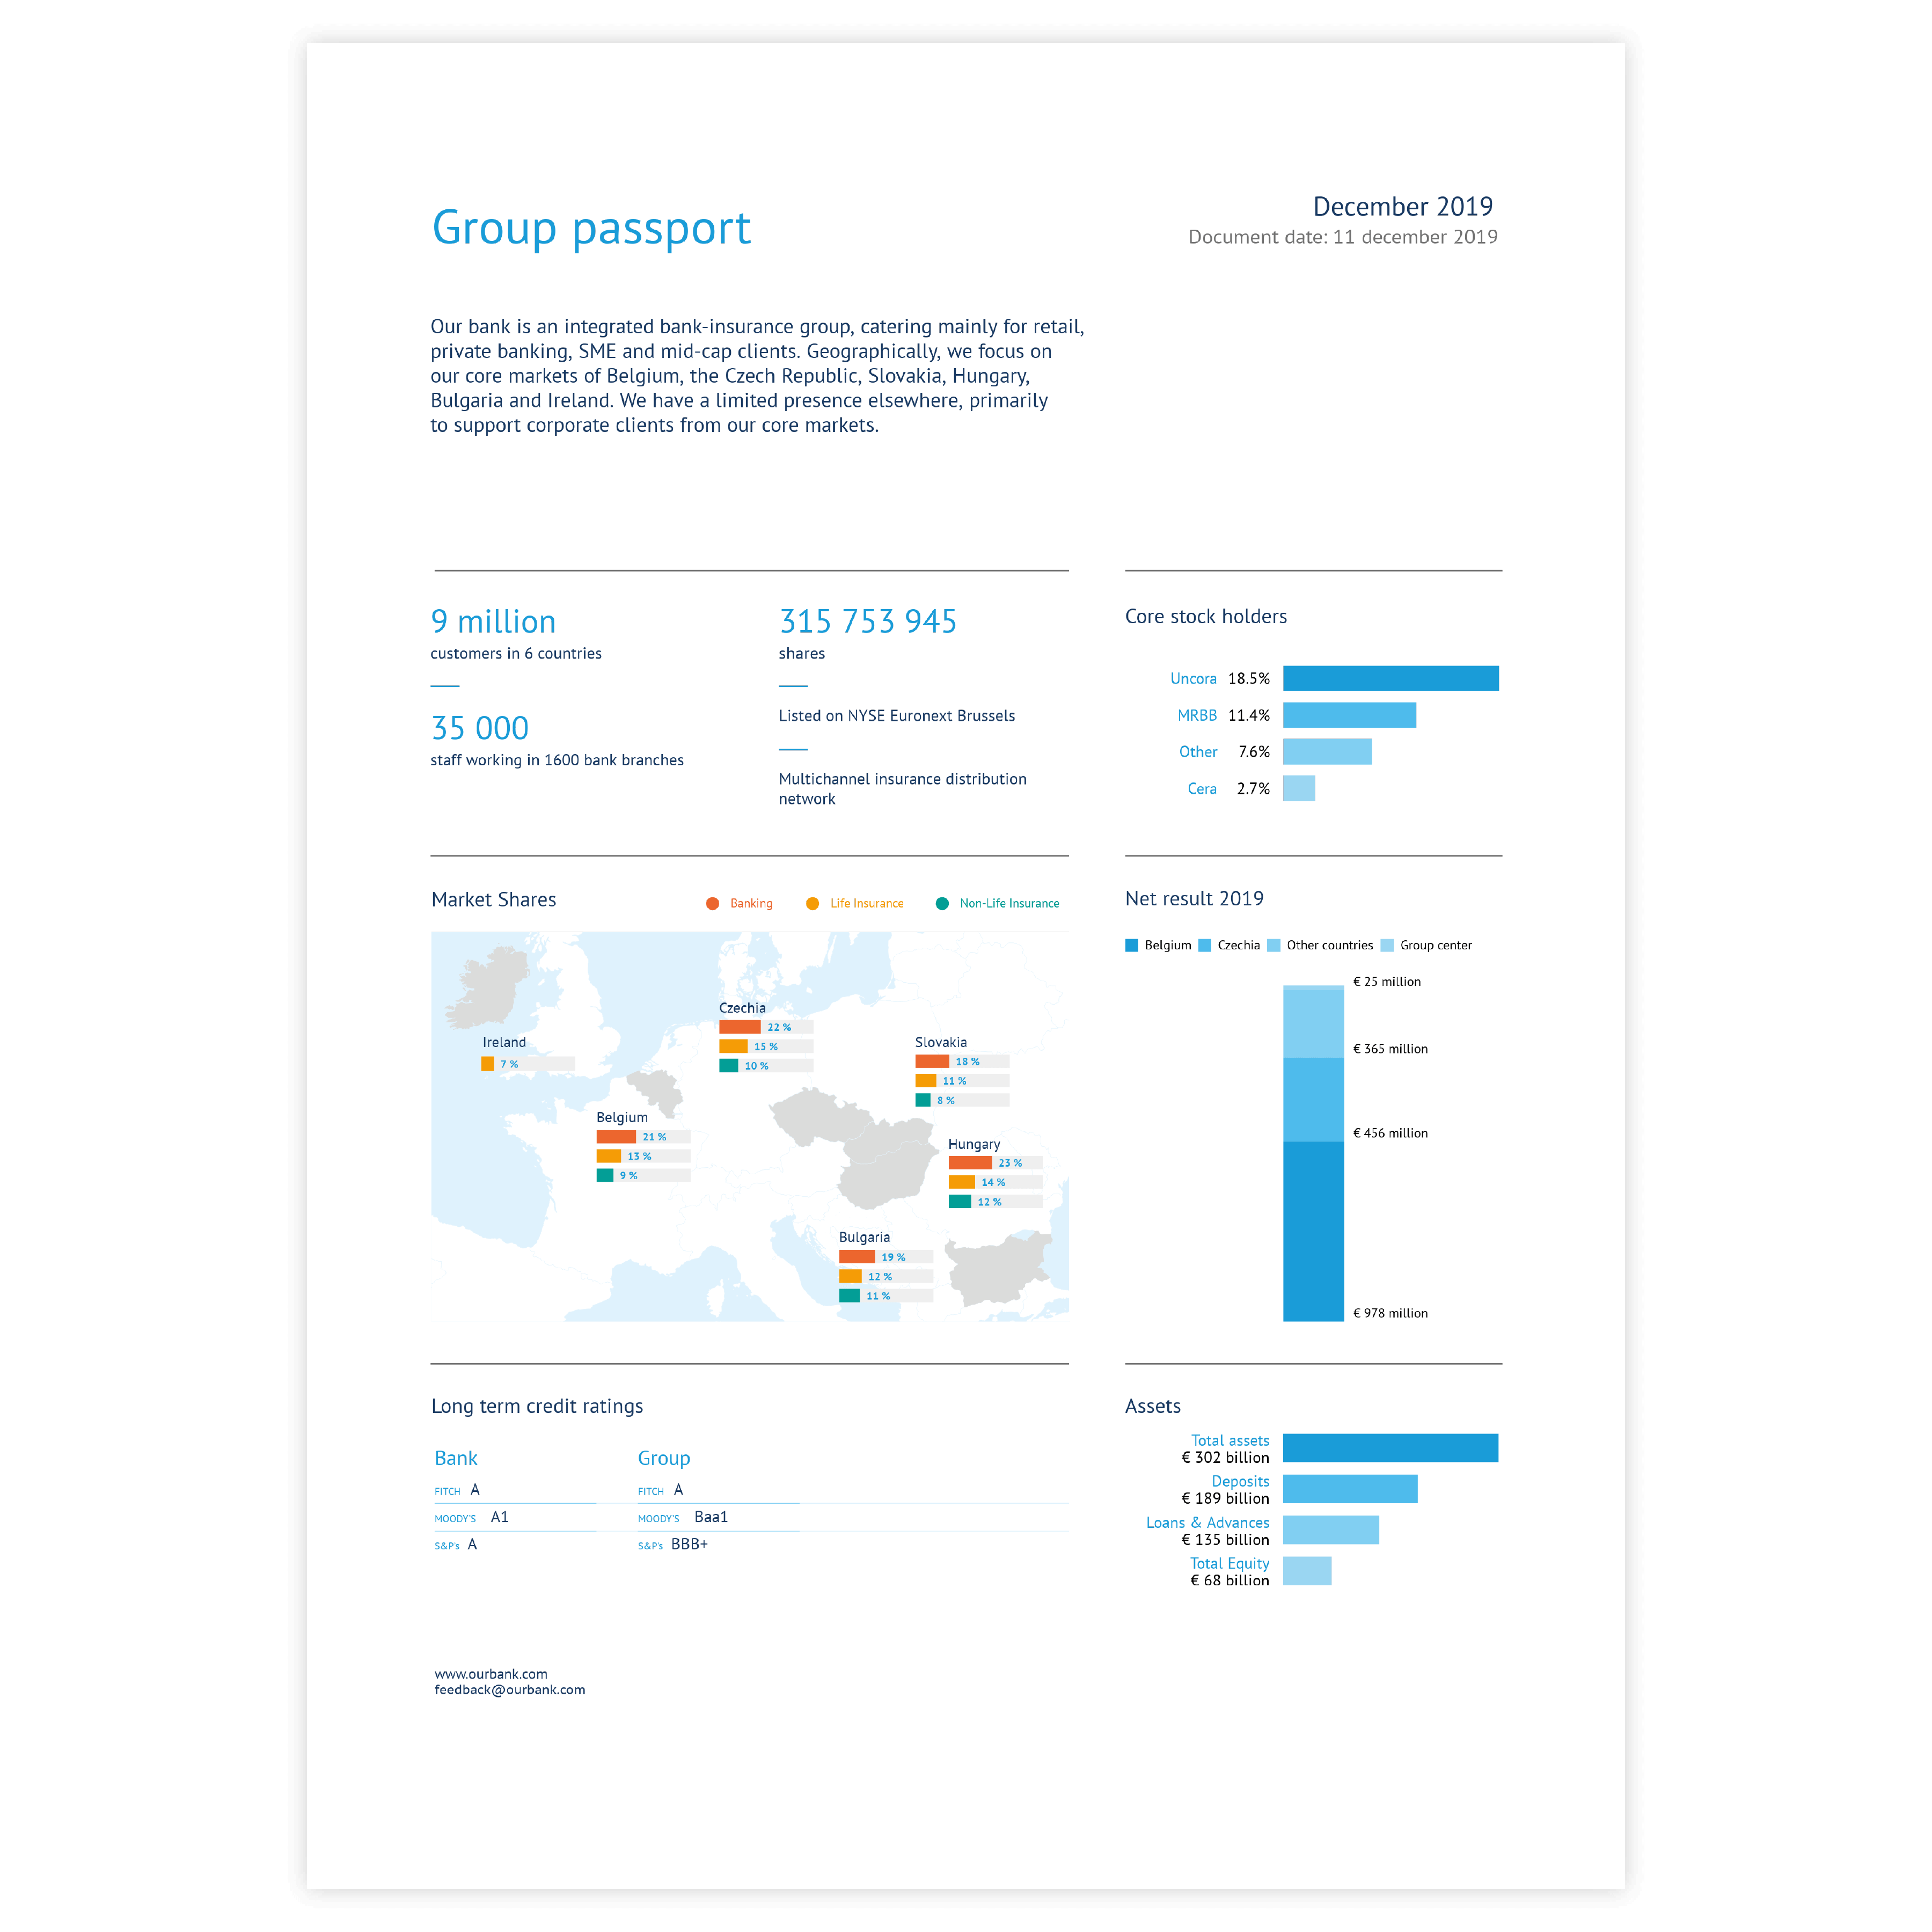
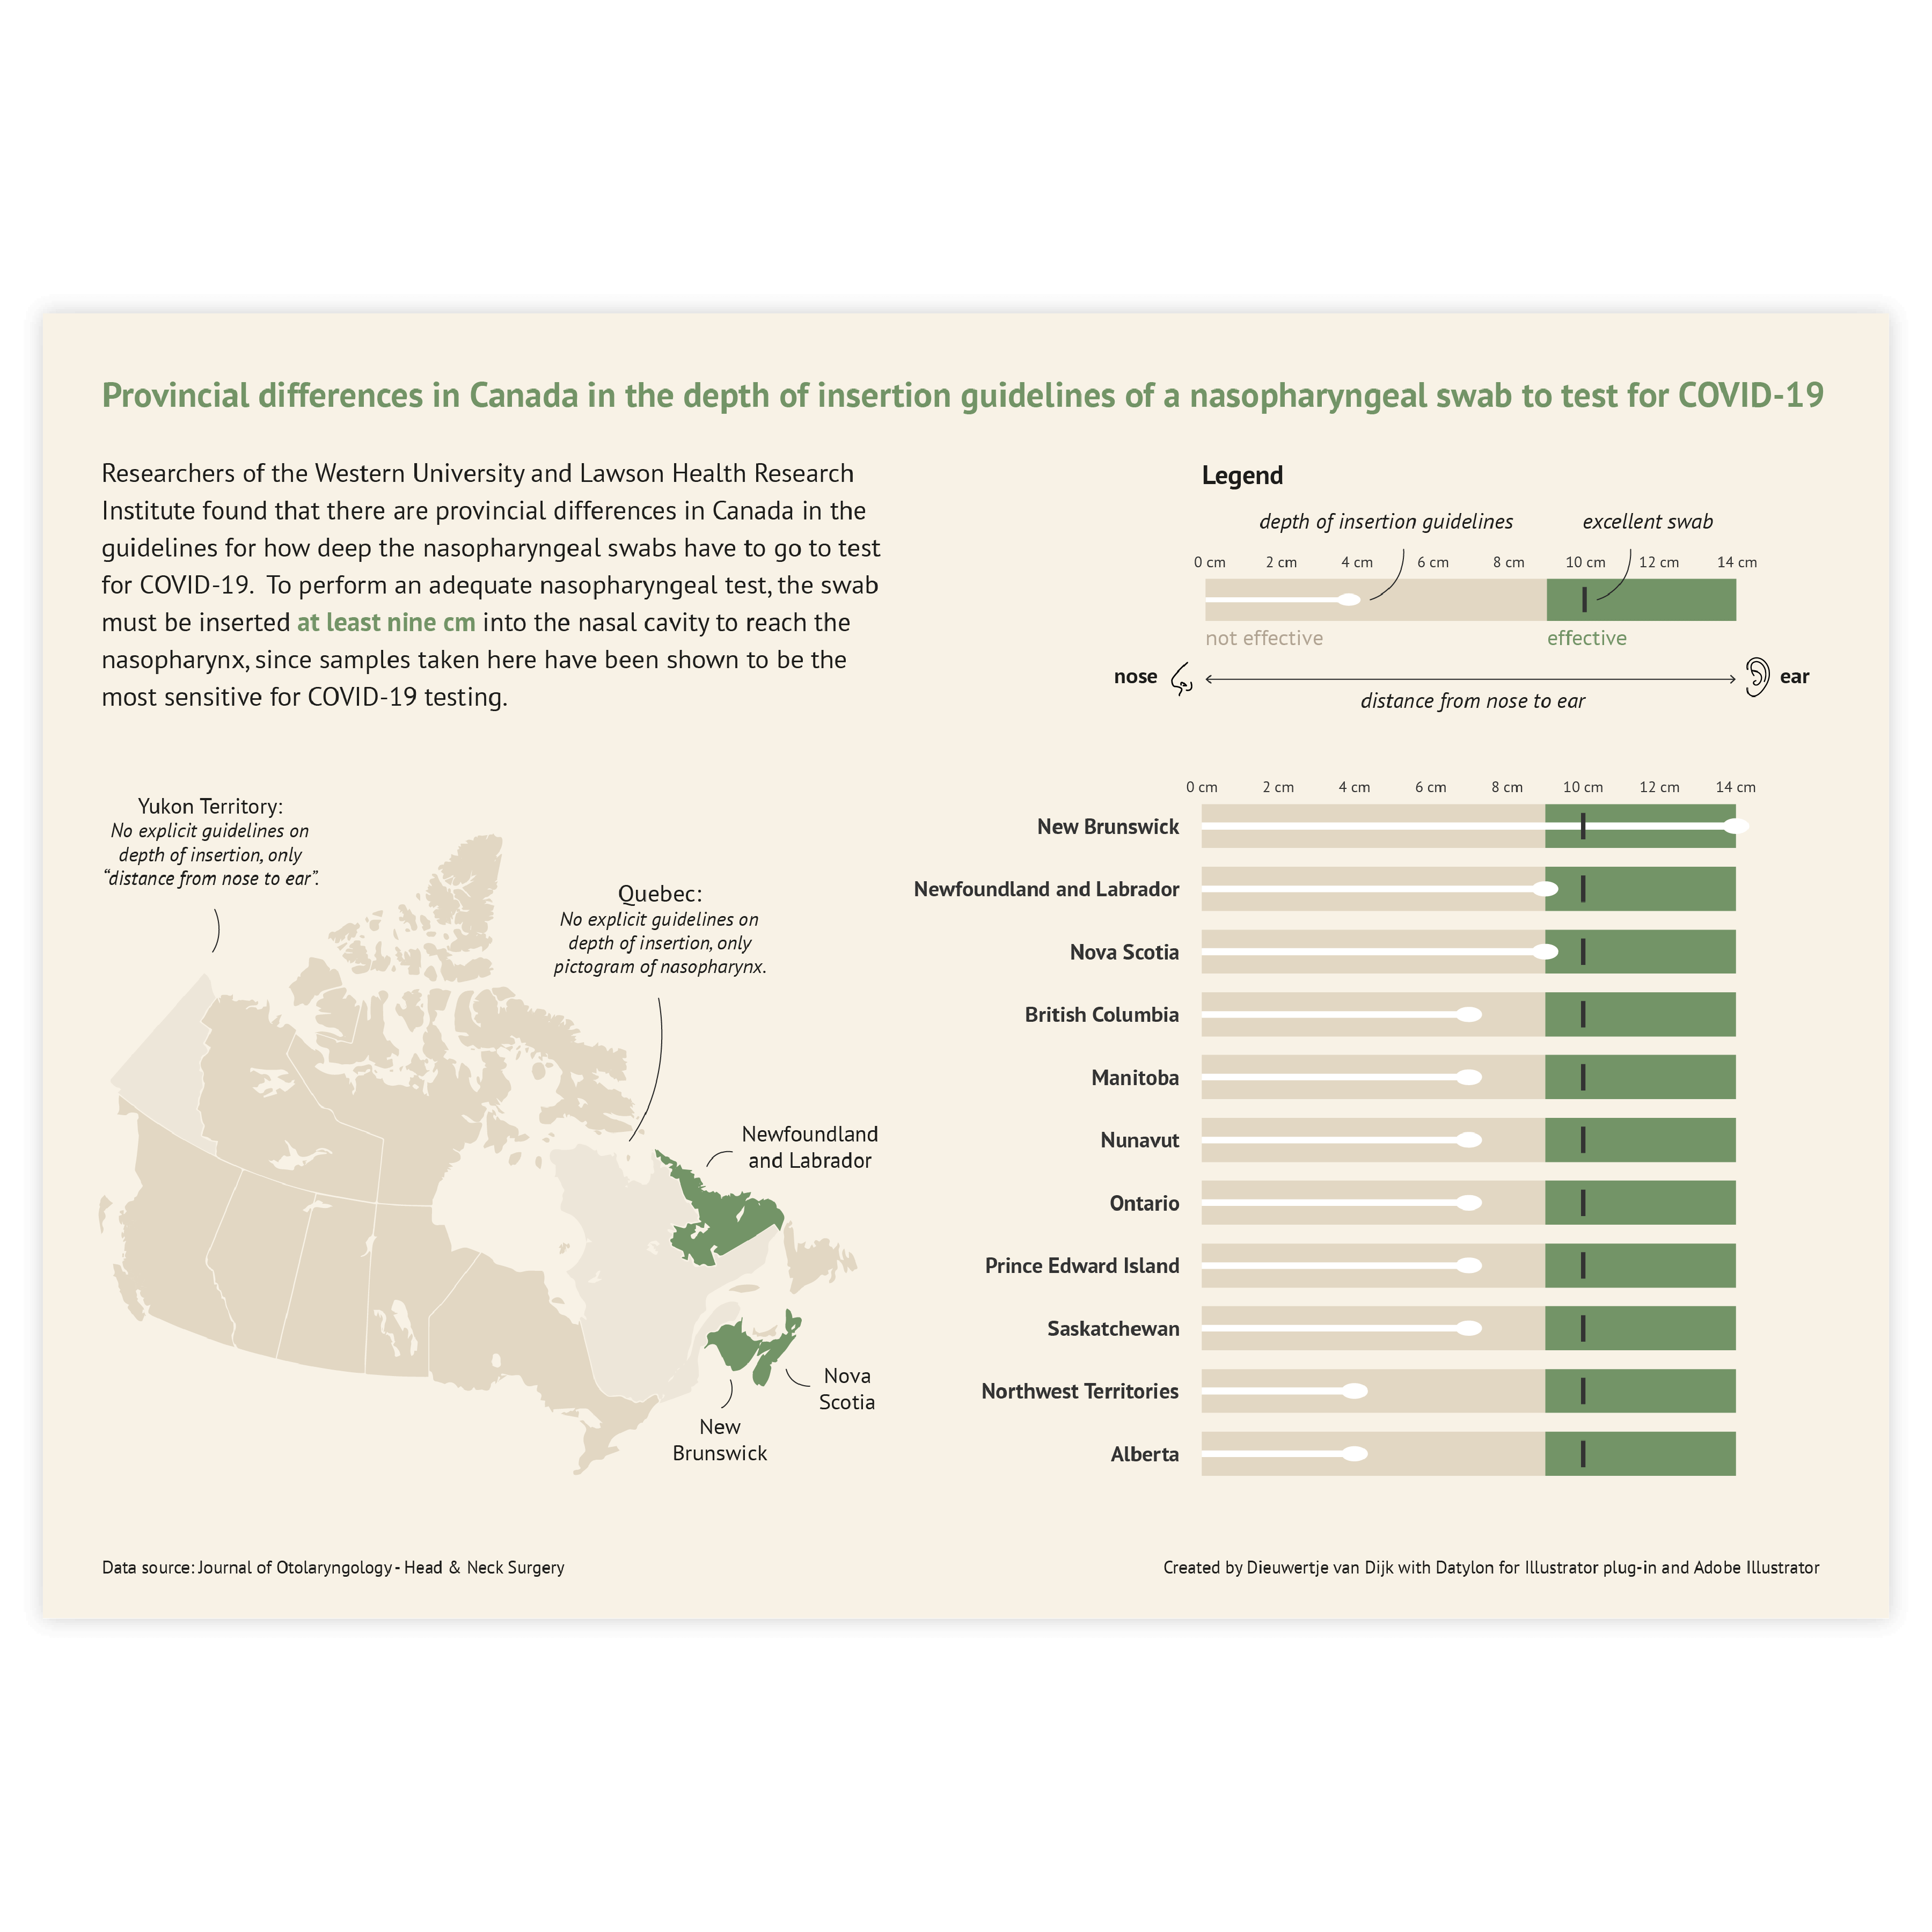
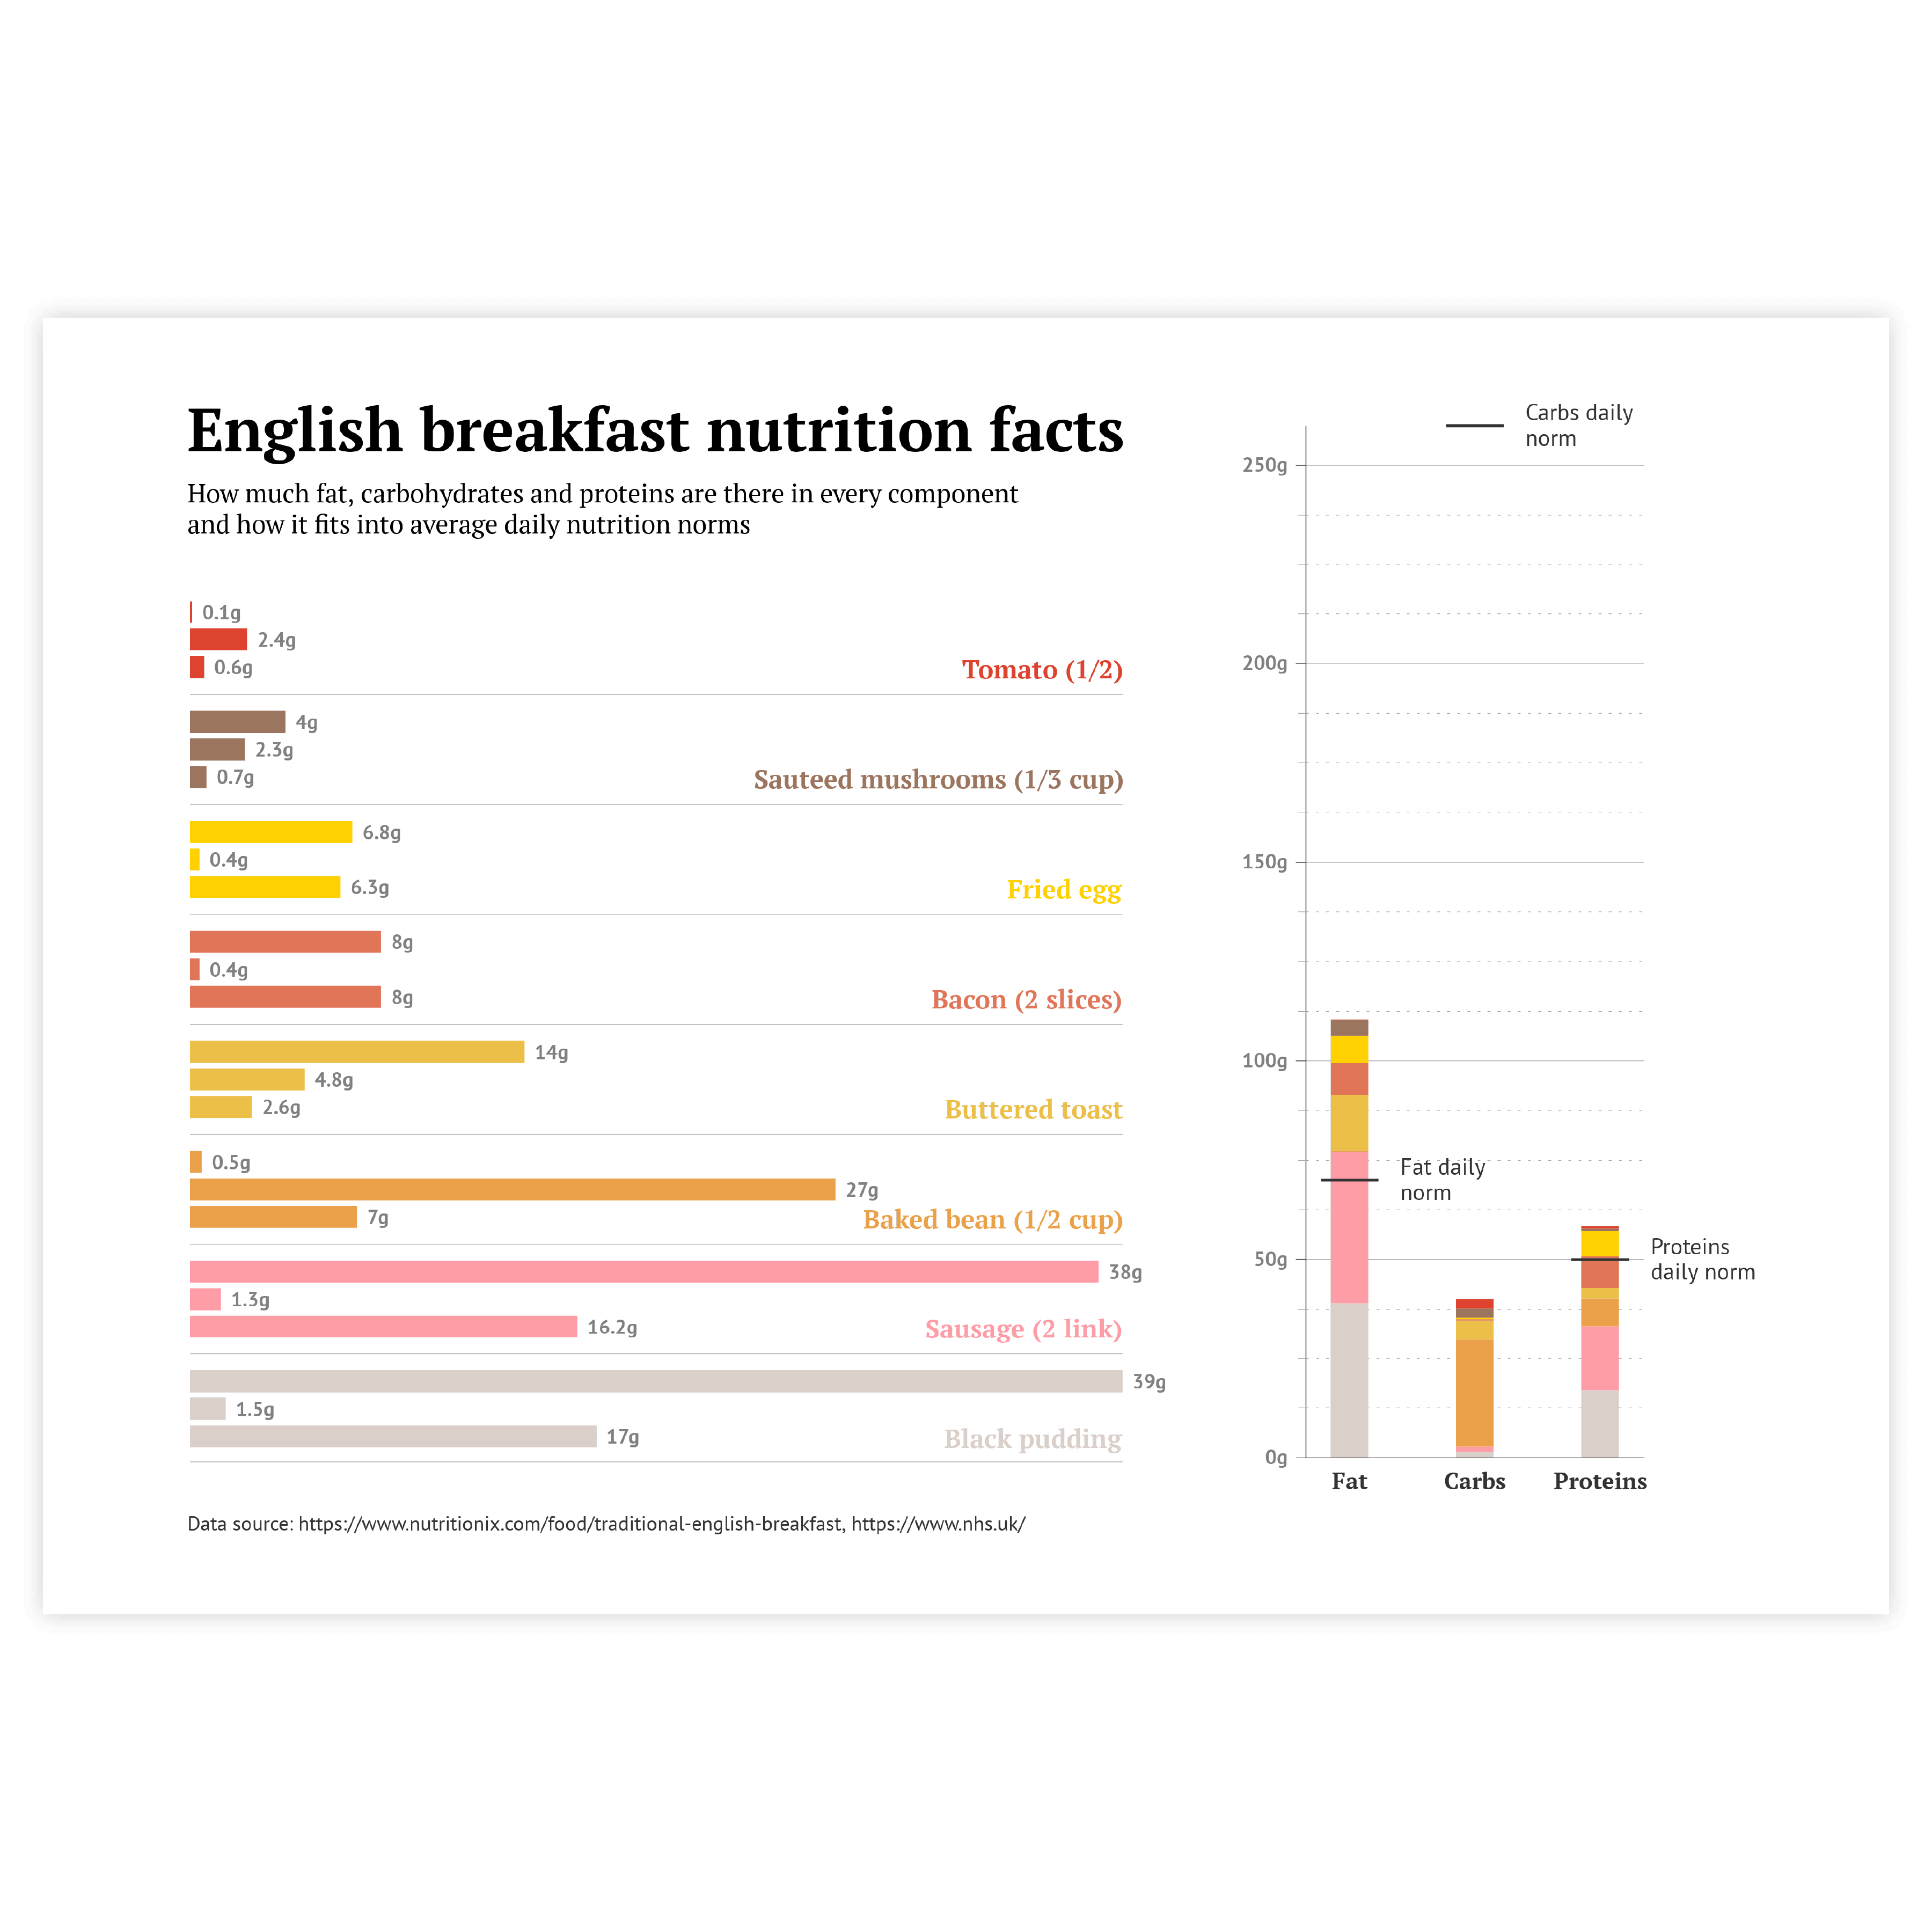
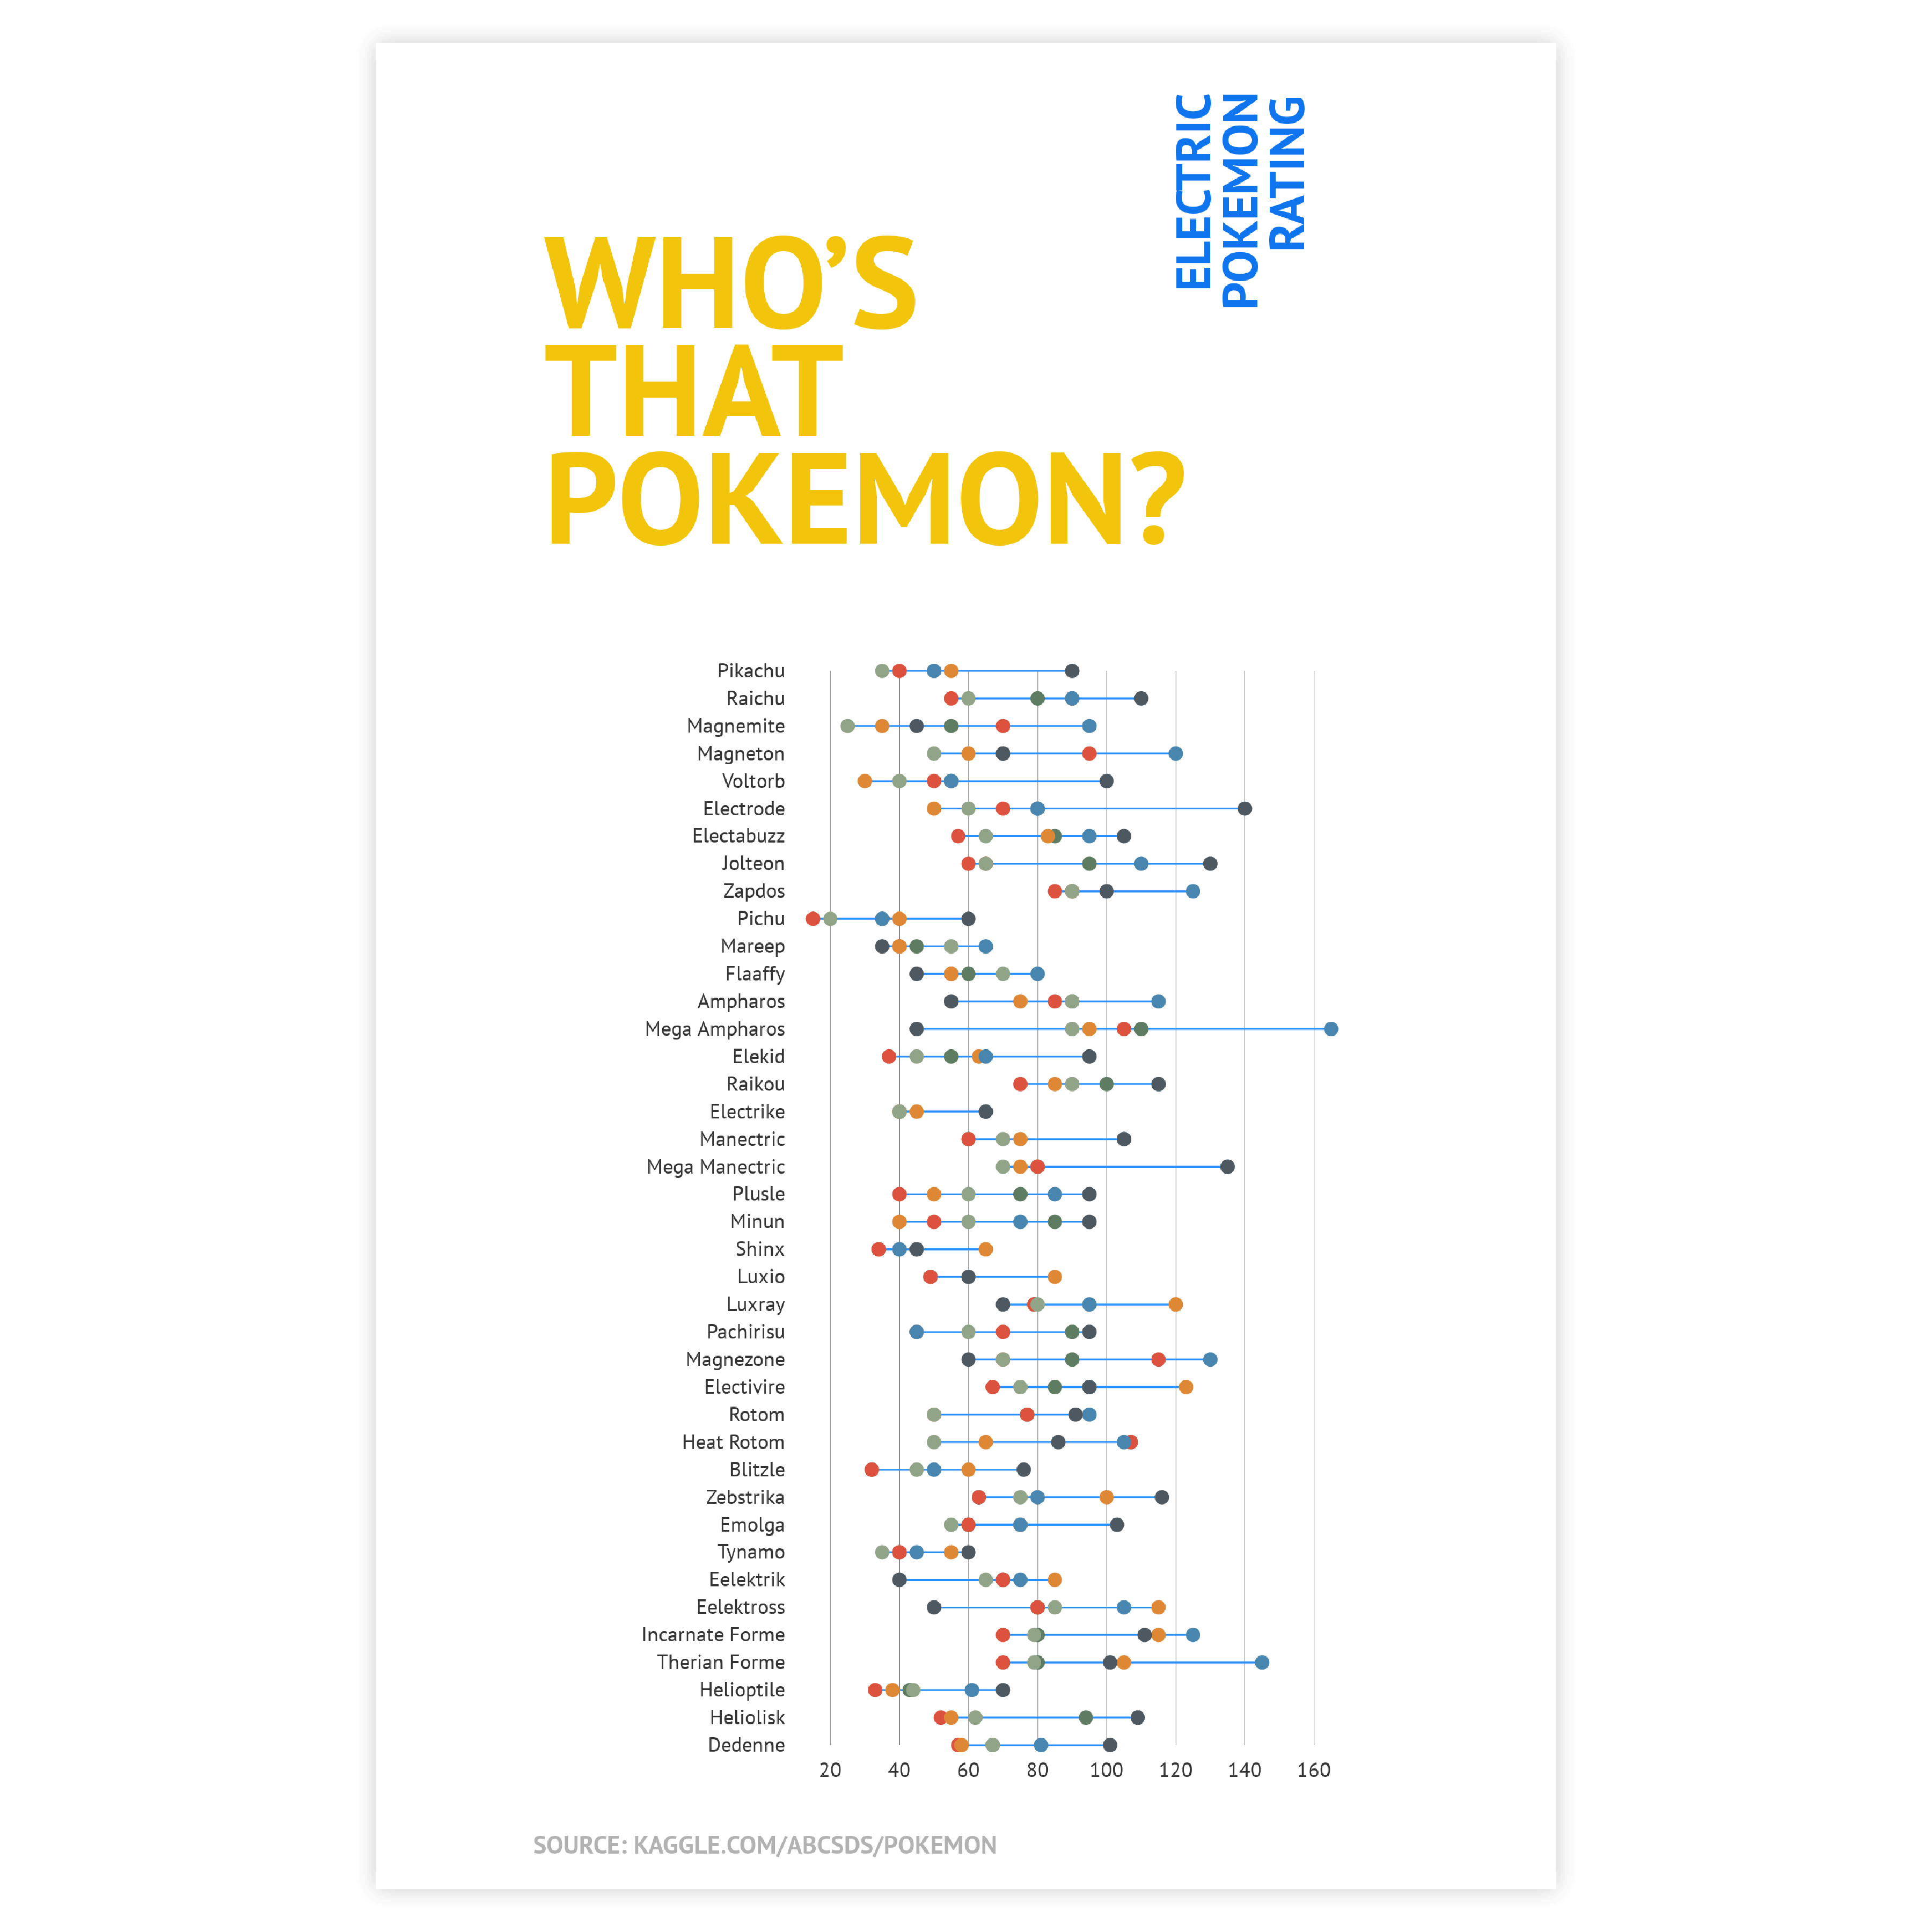


CHART LIBRARY
130+ chart templates
Unleash your creativity and gain time with a growing library of fully customizable charts. Jumpstart from one of our 130+ chart templates and express exactly the message your want to bring across. Or create your own chart template to become even more productive and stay on-brand.
See our complete chart library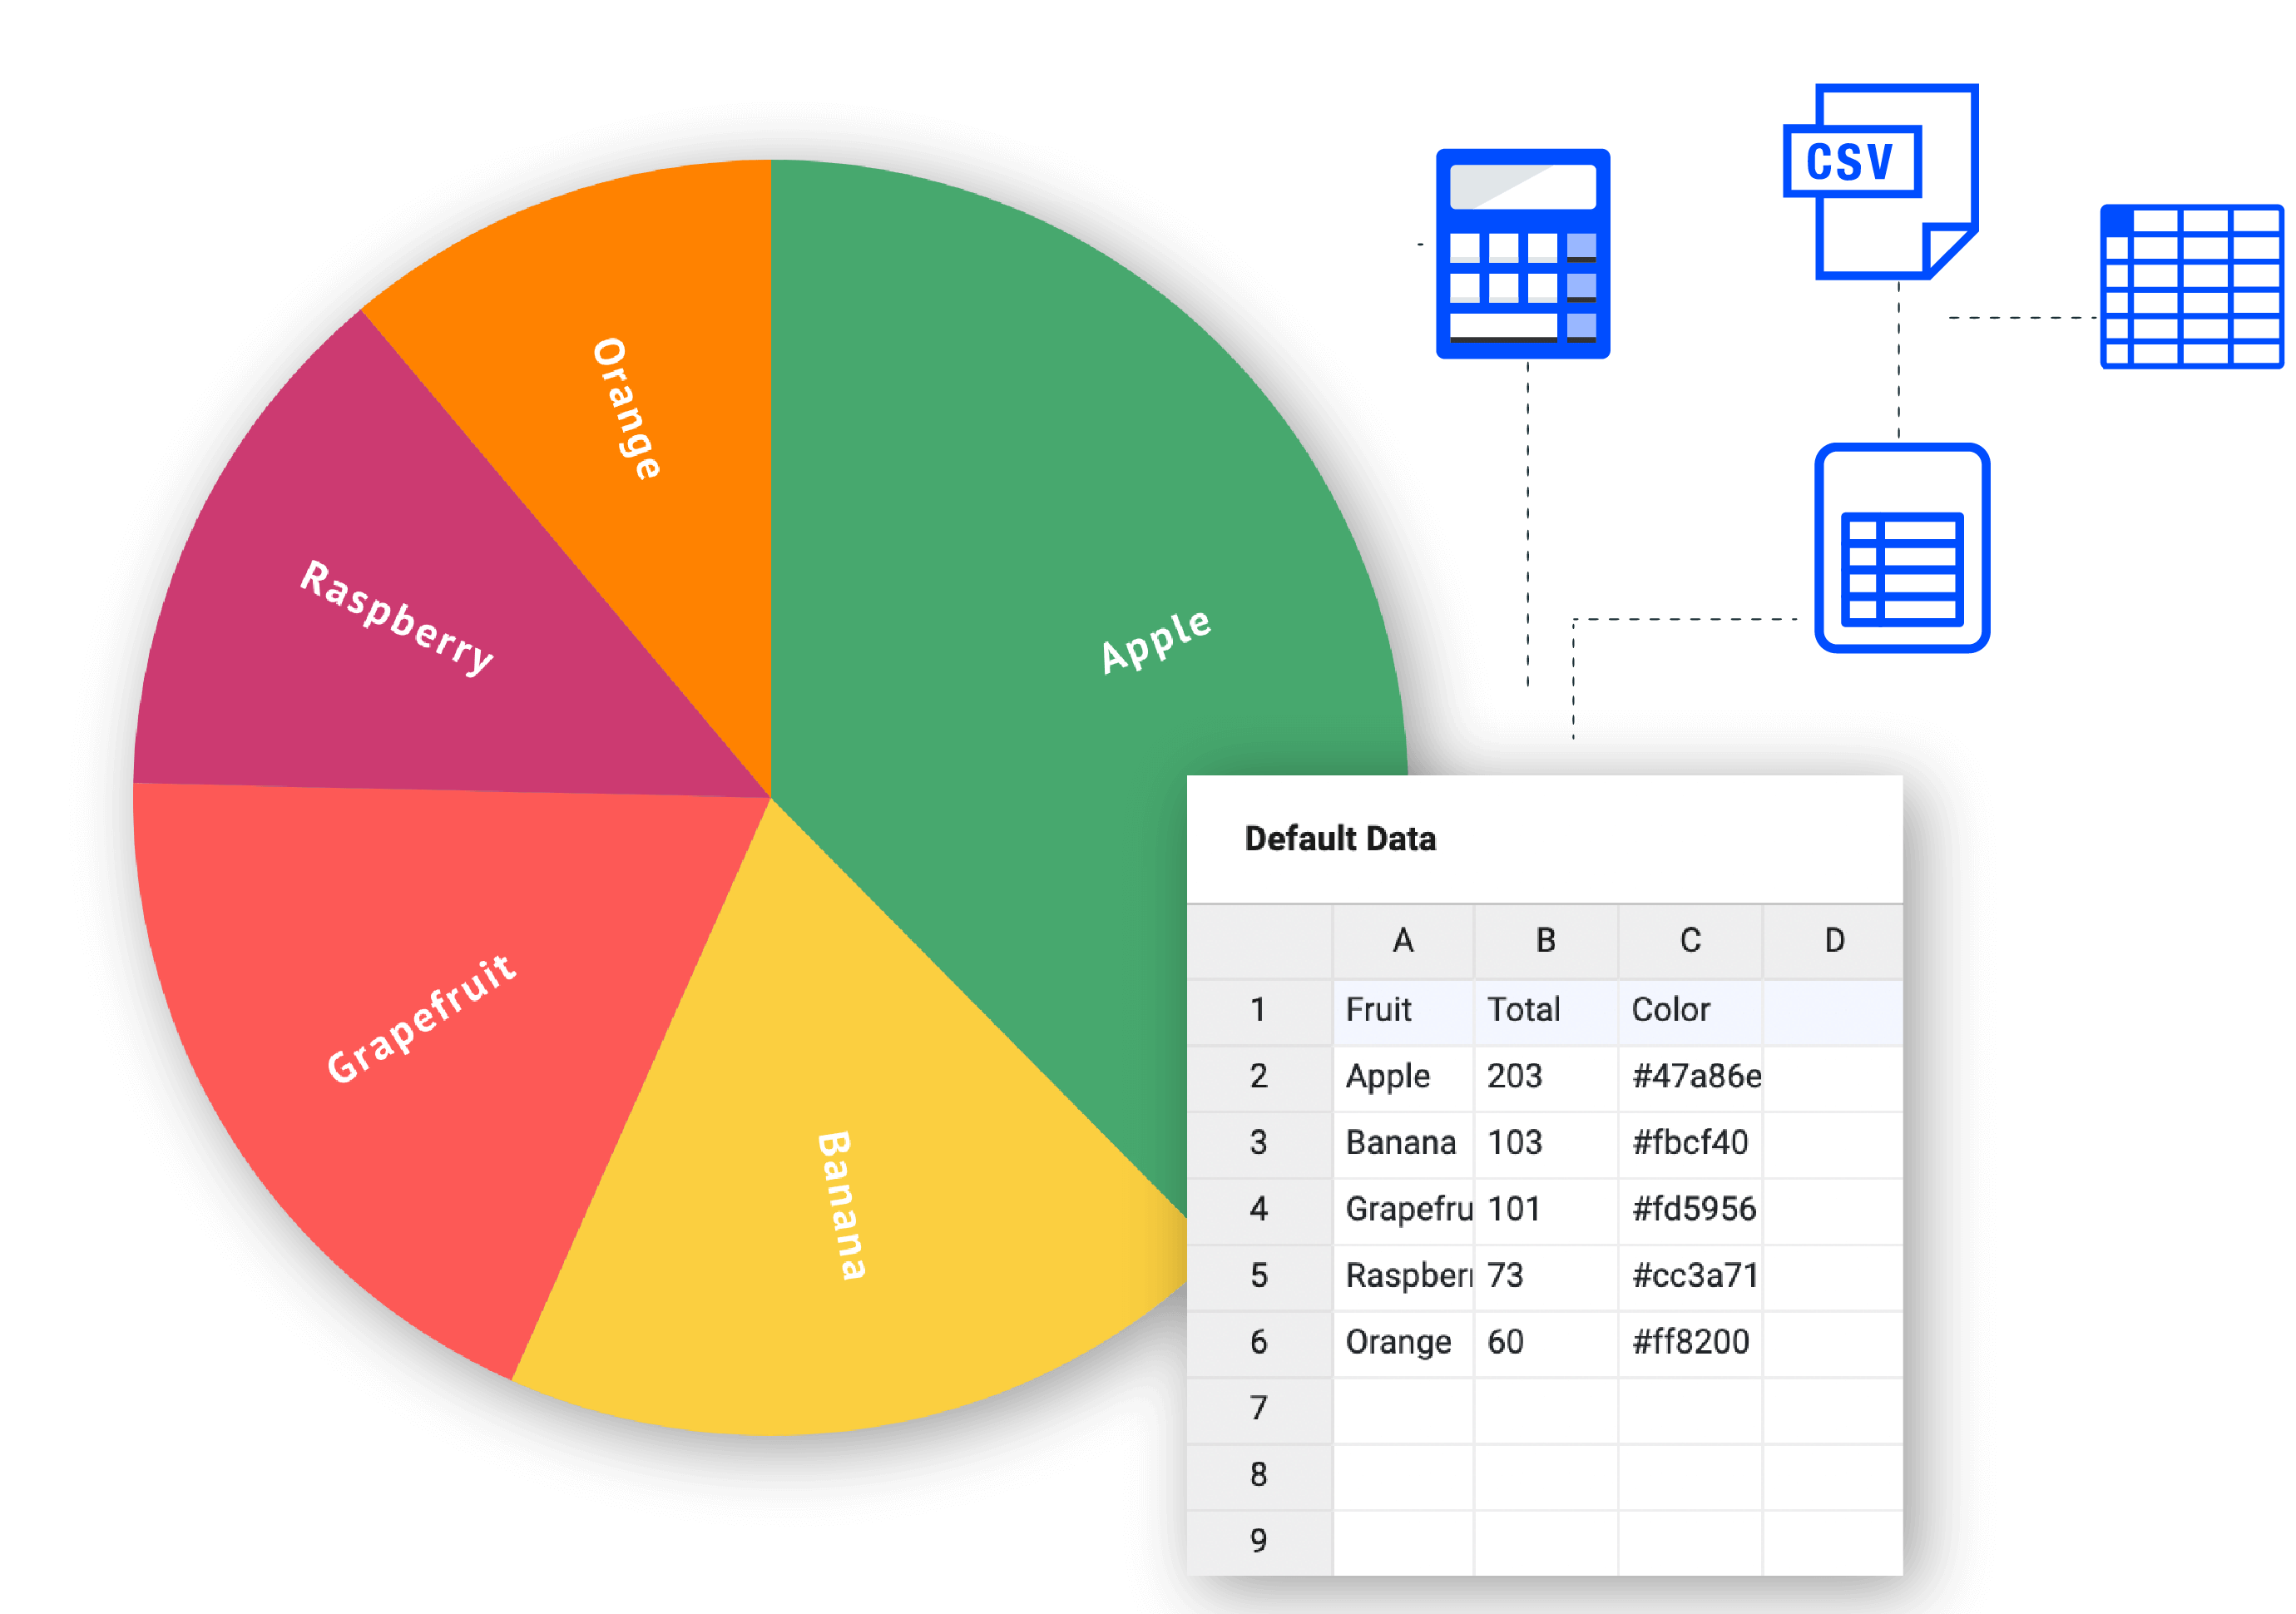
DATA MANAGEMENT
Organize & manage data
Keep your data organized and up to date with ease. Split the work and be more productive together. Load and store your xls, xlsx or csv data file into the Datylon chart maker. Manage your data sheets in workbooks and keep everything nicely organized.
Start making your own chart
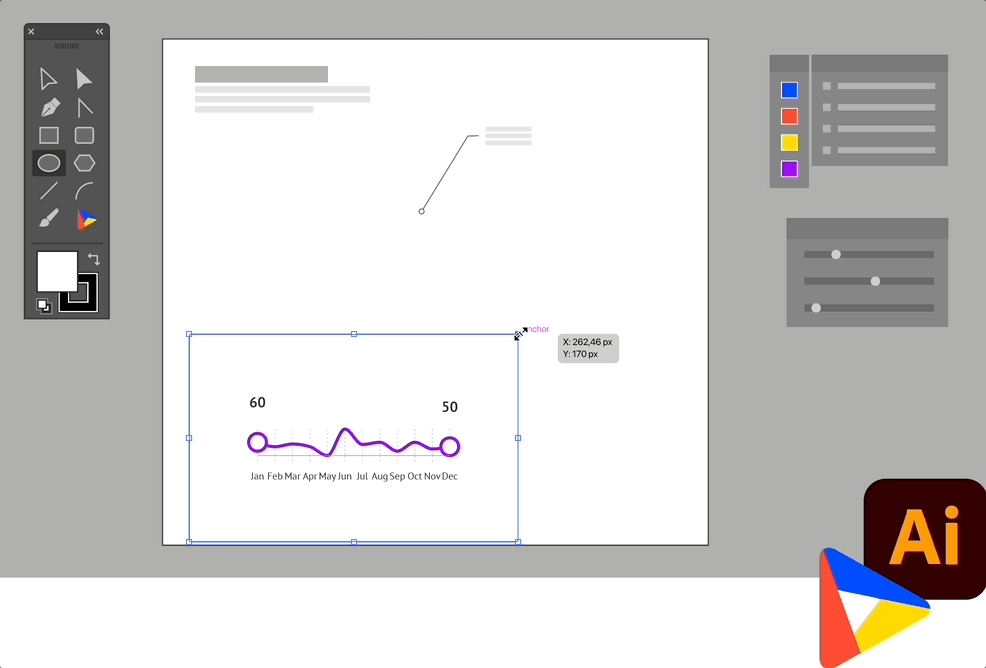
RE-USE & COLLABORATE
Design once, use often
Reduce production time considerably by re-using or re-purposing the charts you created. Build your own collection of on-brand chart templates and feed them with new data by the click of a button to create new charts. Easily adapt those charts to fit a new design or layout. All this saves you loads of time and helps teams to stay on brand.
Get started with our chart makerAdvanced styling options
Enjoy full freedom of design with our advanced styling options. Tweak all pie chart elements to perfection.
Data-driven styling
Style pie chart properties automatically based on data. Speed up production and let the data talk.
Export & publish
Use your pie charts in other applications and channels. Improve the impact of your communication.


What is a chart?
A chart is a visual representation of data in a worksheet. Charts are used to provide a better understanding of larger quantities of data or a correlation (relationship) between parts of data in a condensed and easy-to-understand manner. A chart is a form of a graphical representation of data, which supports data explanation and makes it easy and fast to digest by the brain. In other words, we use charts to convert data values from a datasheet into a nice visualization. Charts make it apparent to find hidden information and insights that are otherwise hard to find from a table with data. This process helps improve data communication. There are many different chart types, and many of them can be created with Datylon Chart Maker.
See chart types available in Datylon