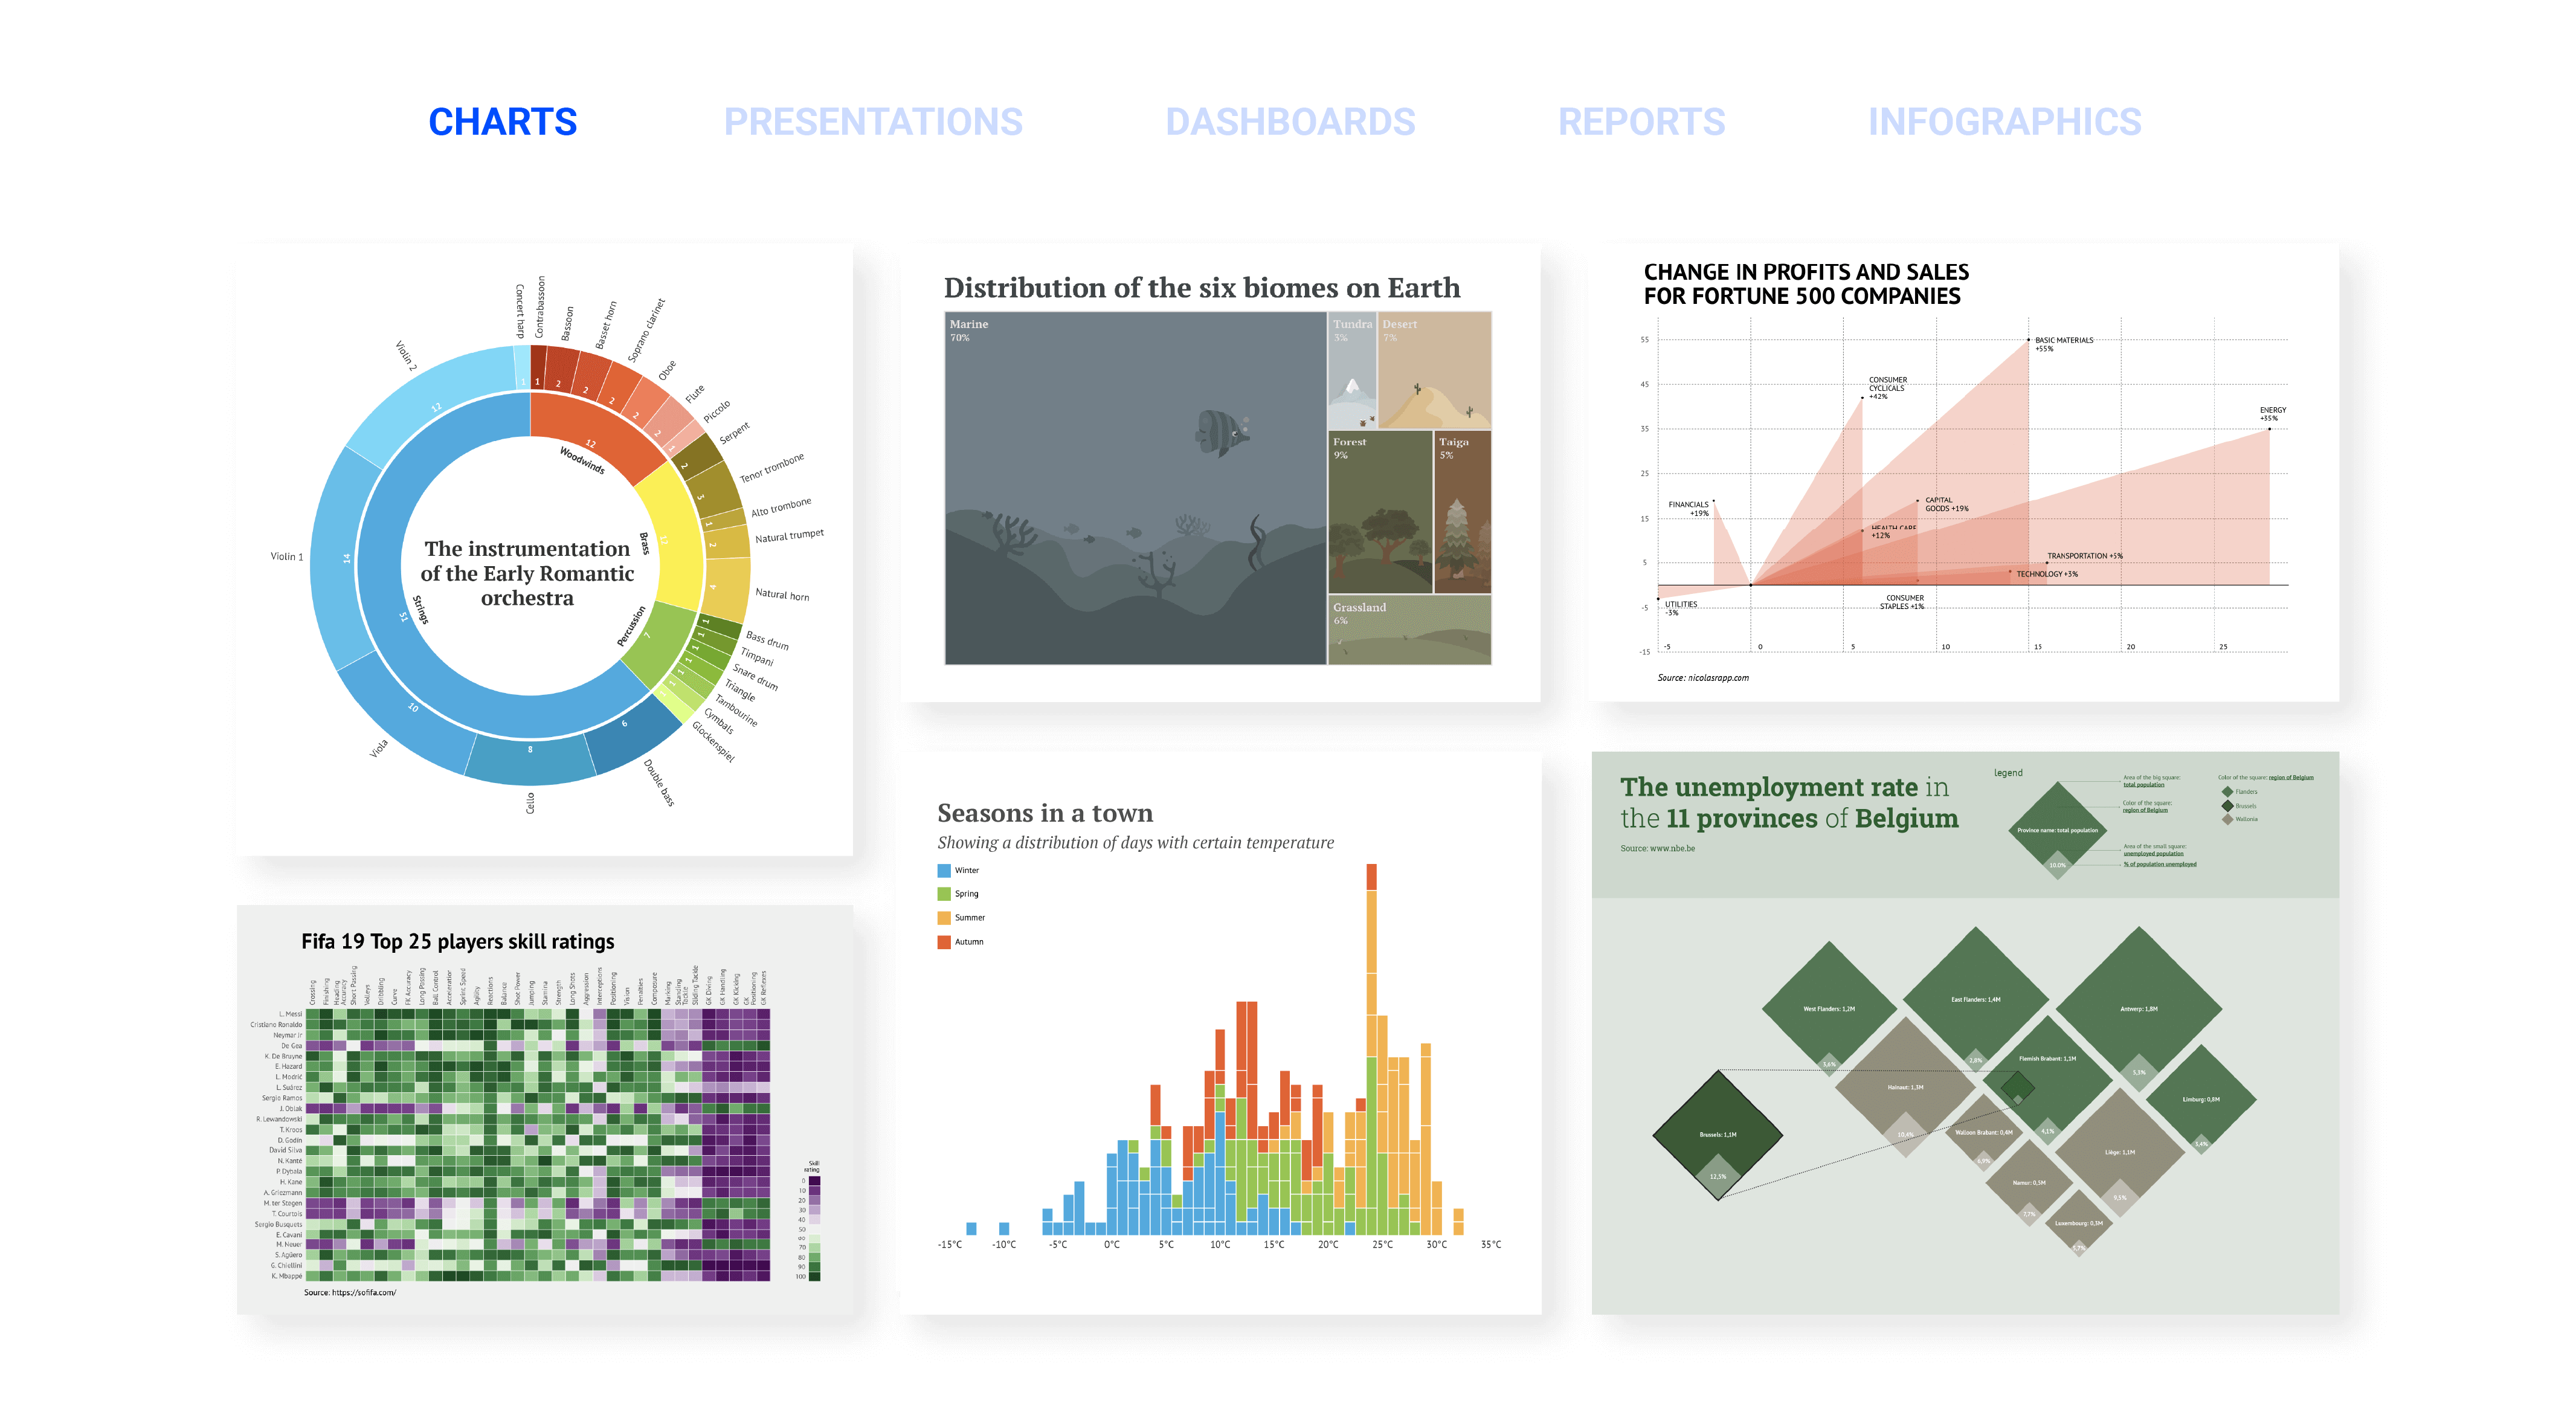
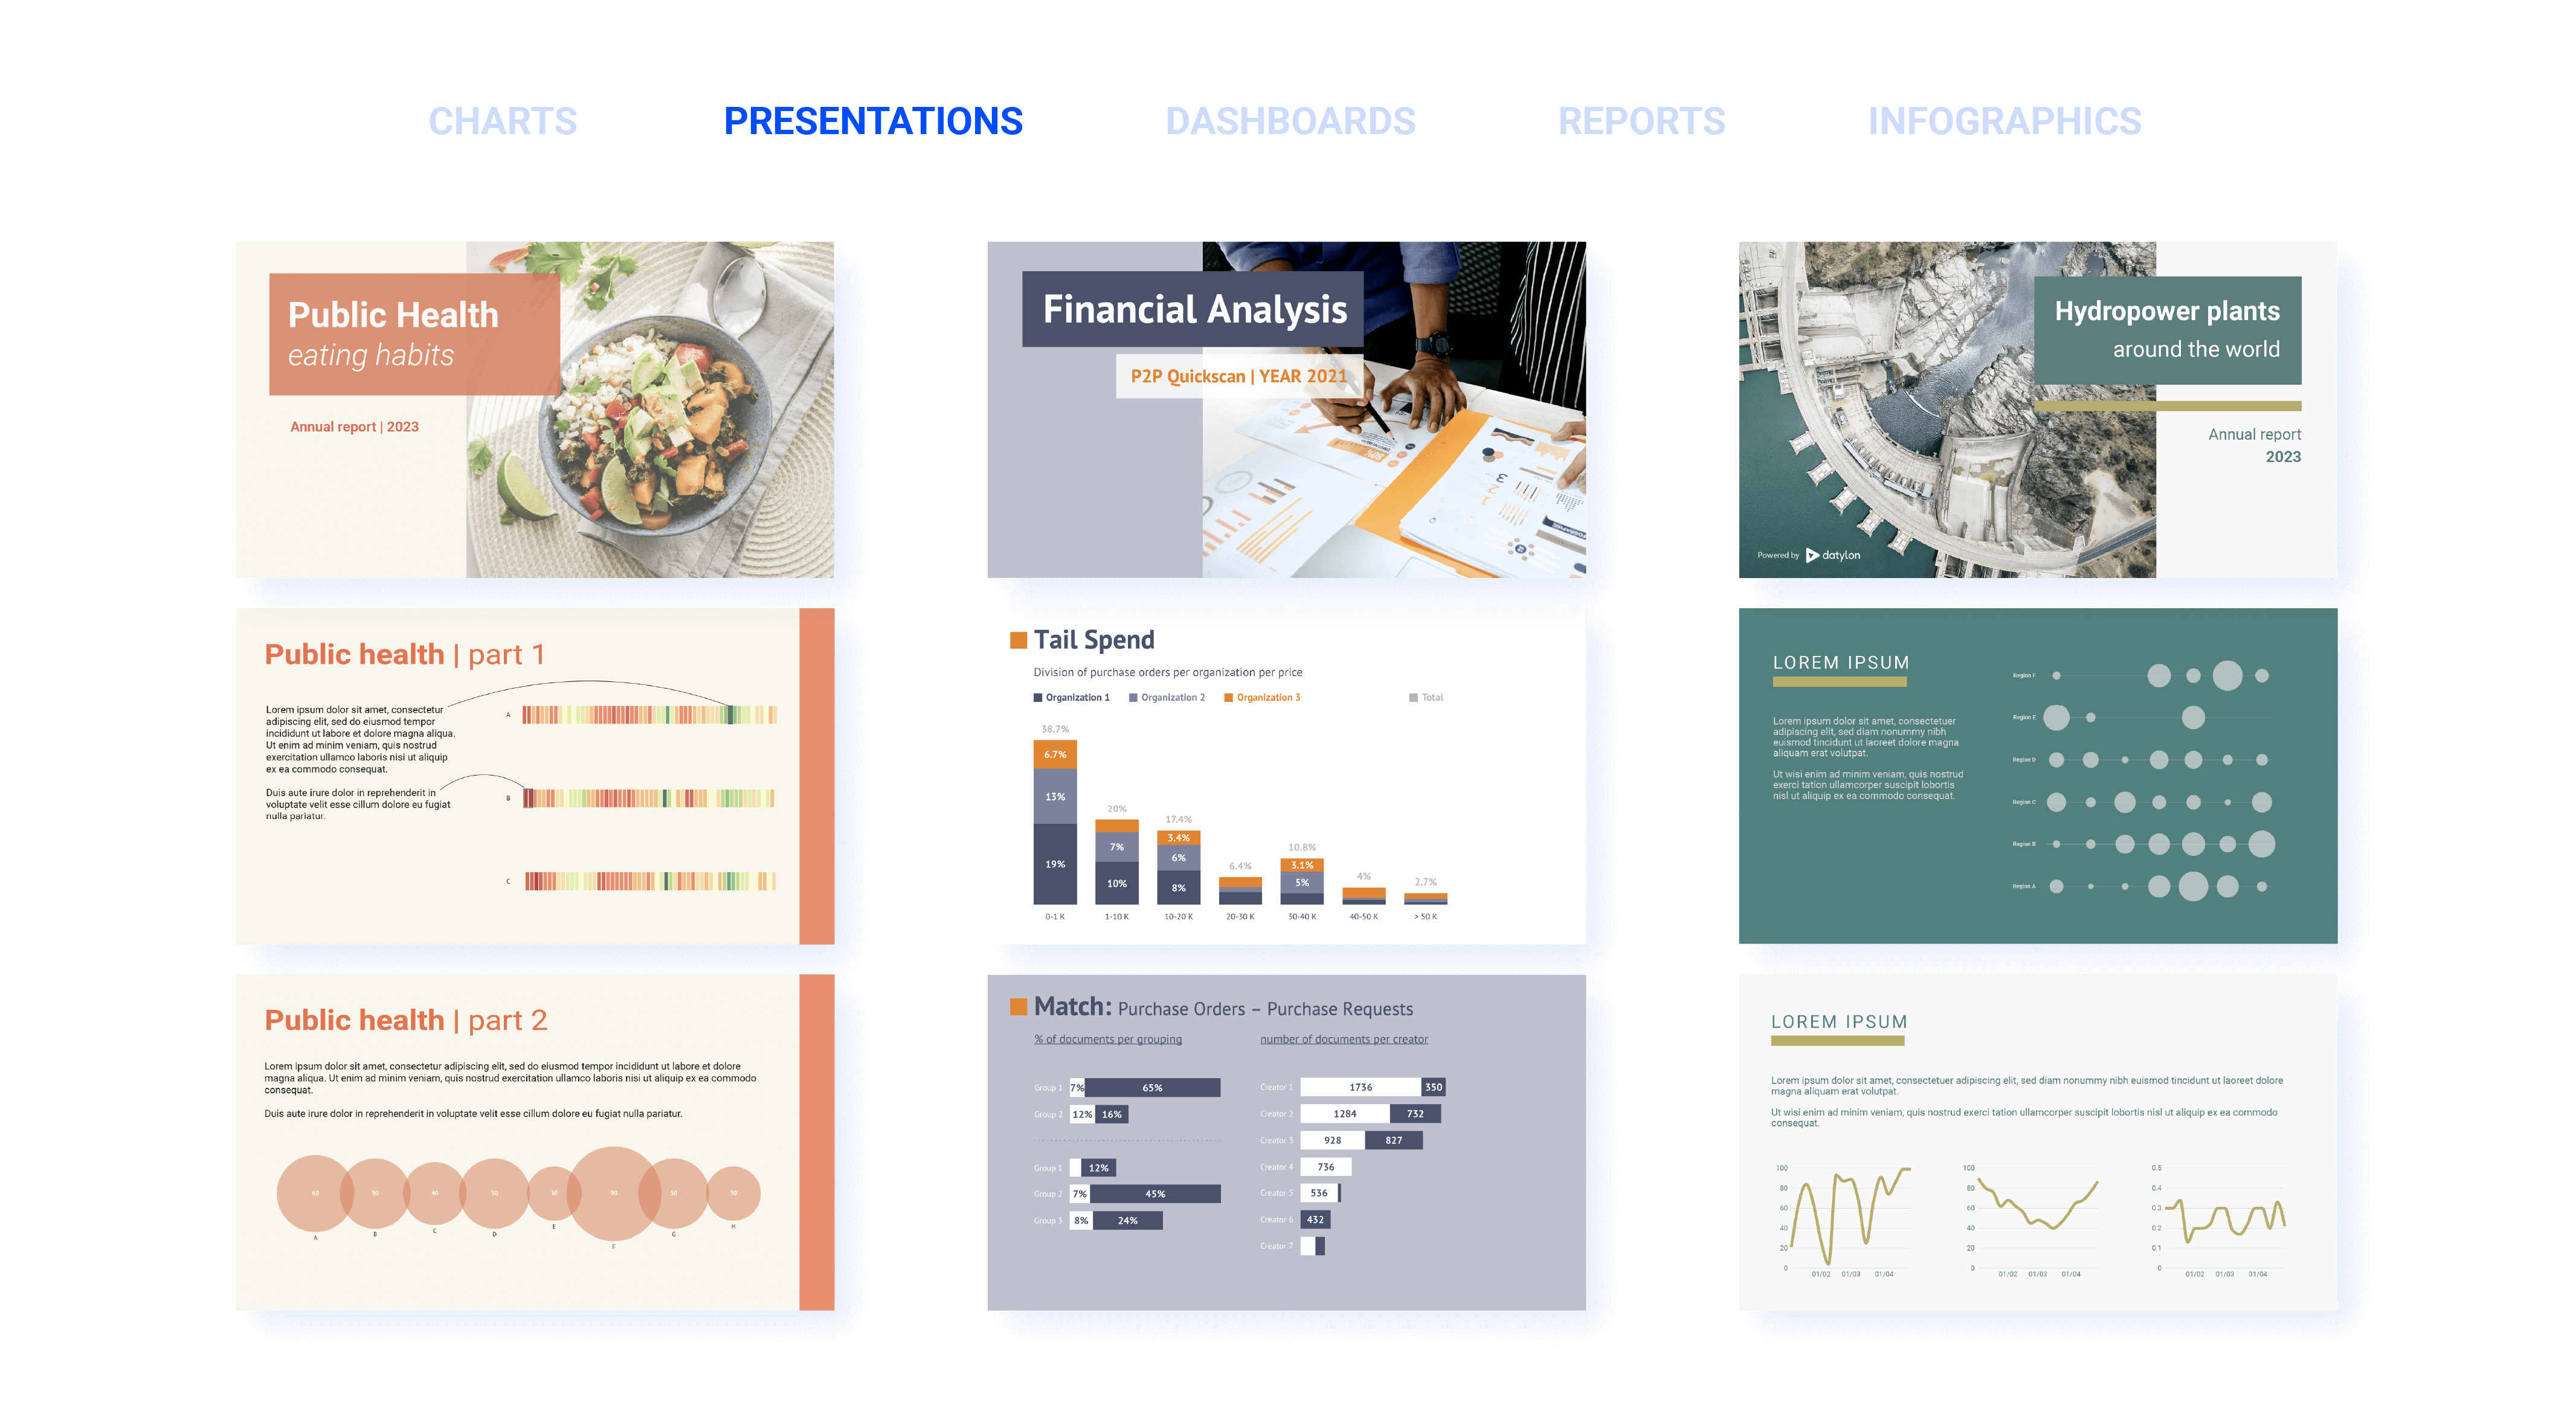
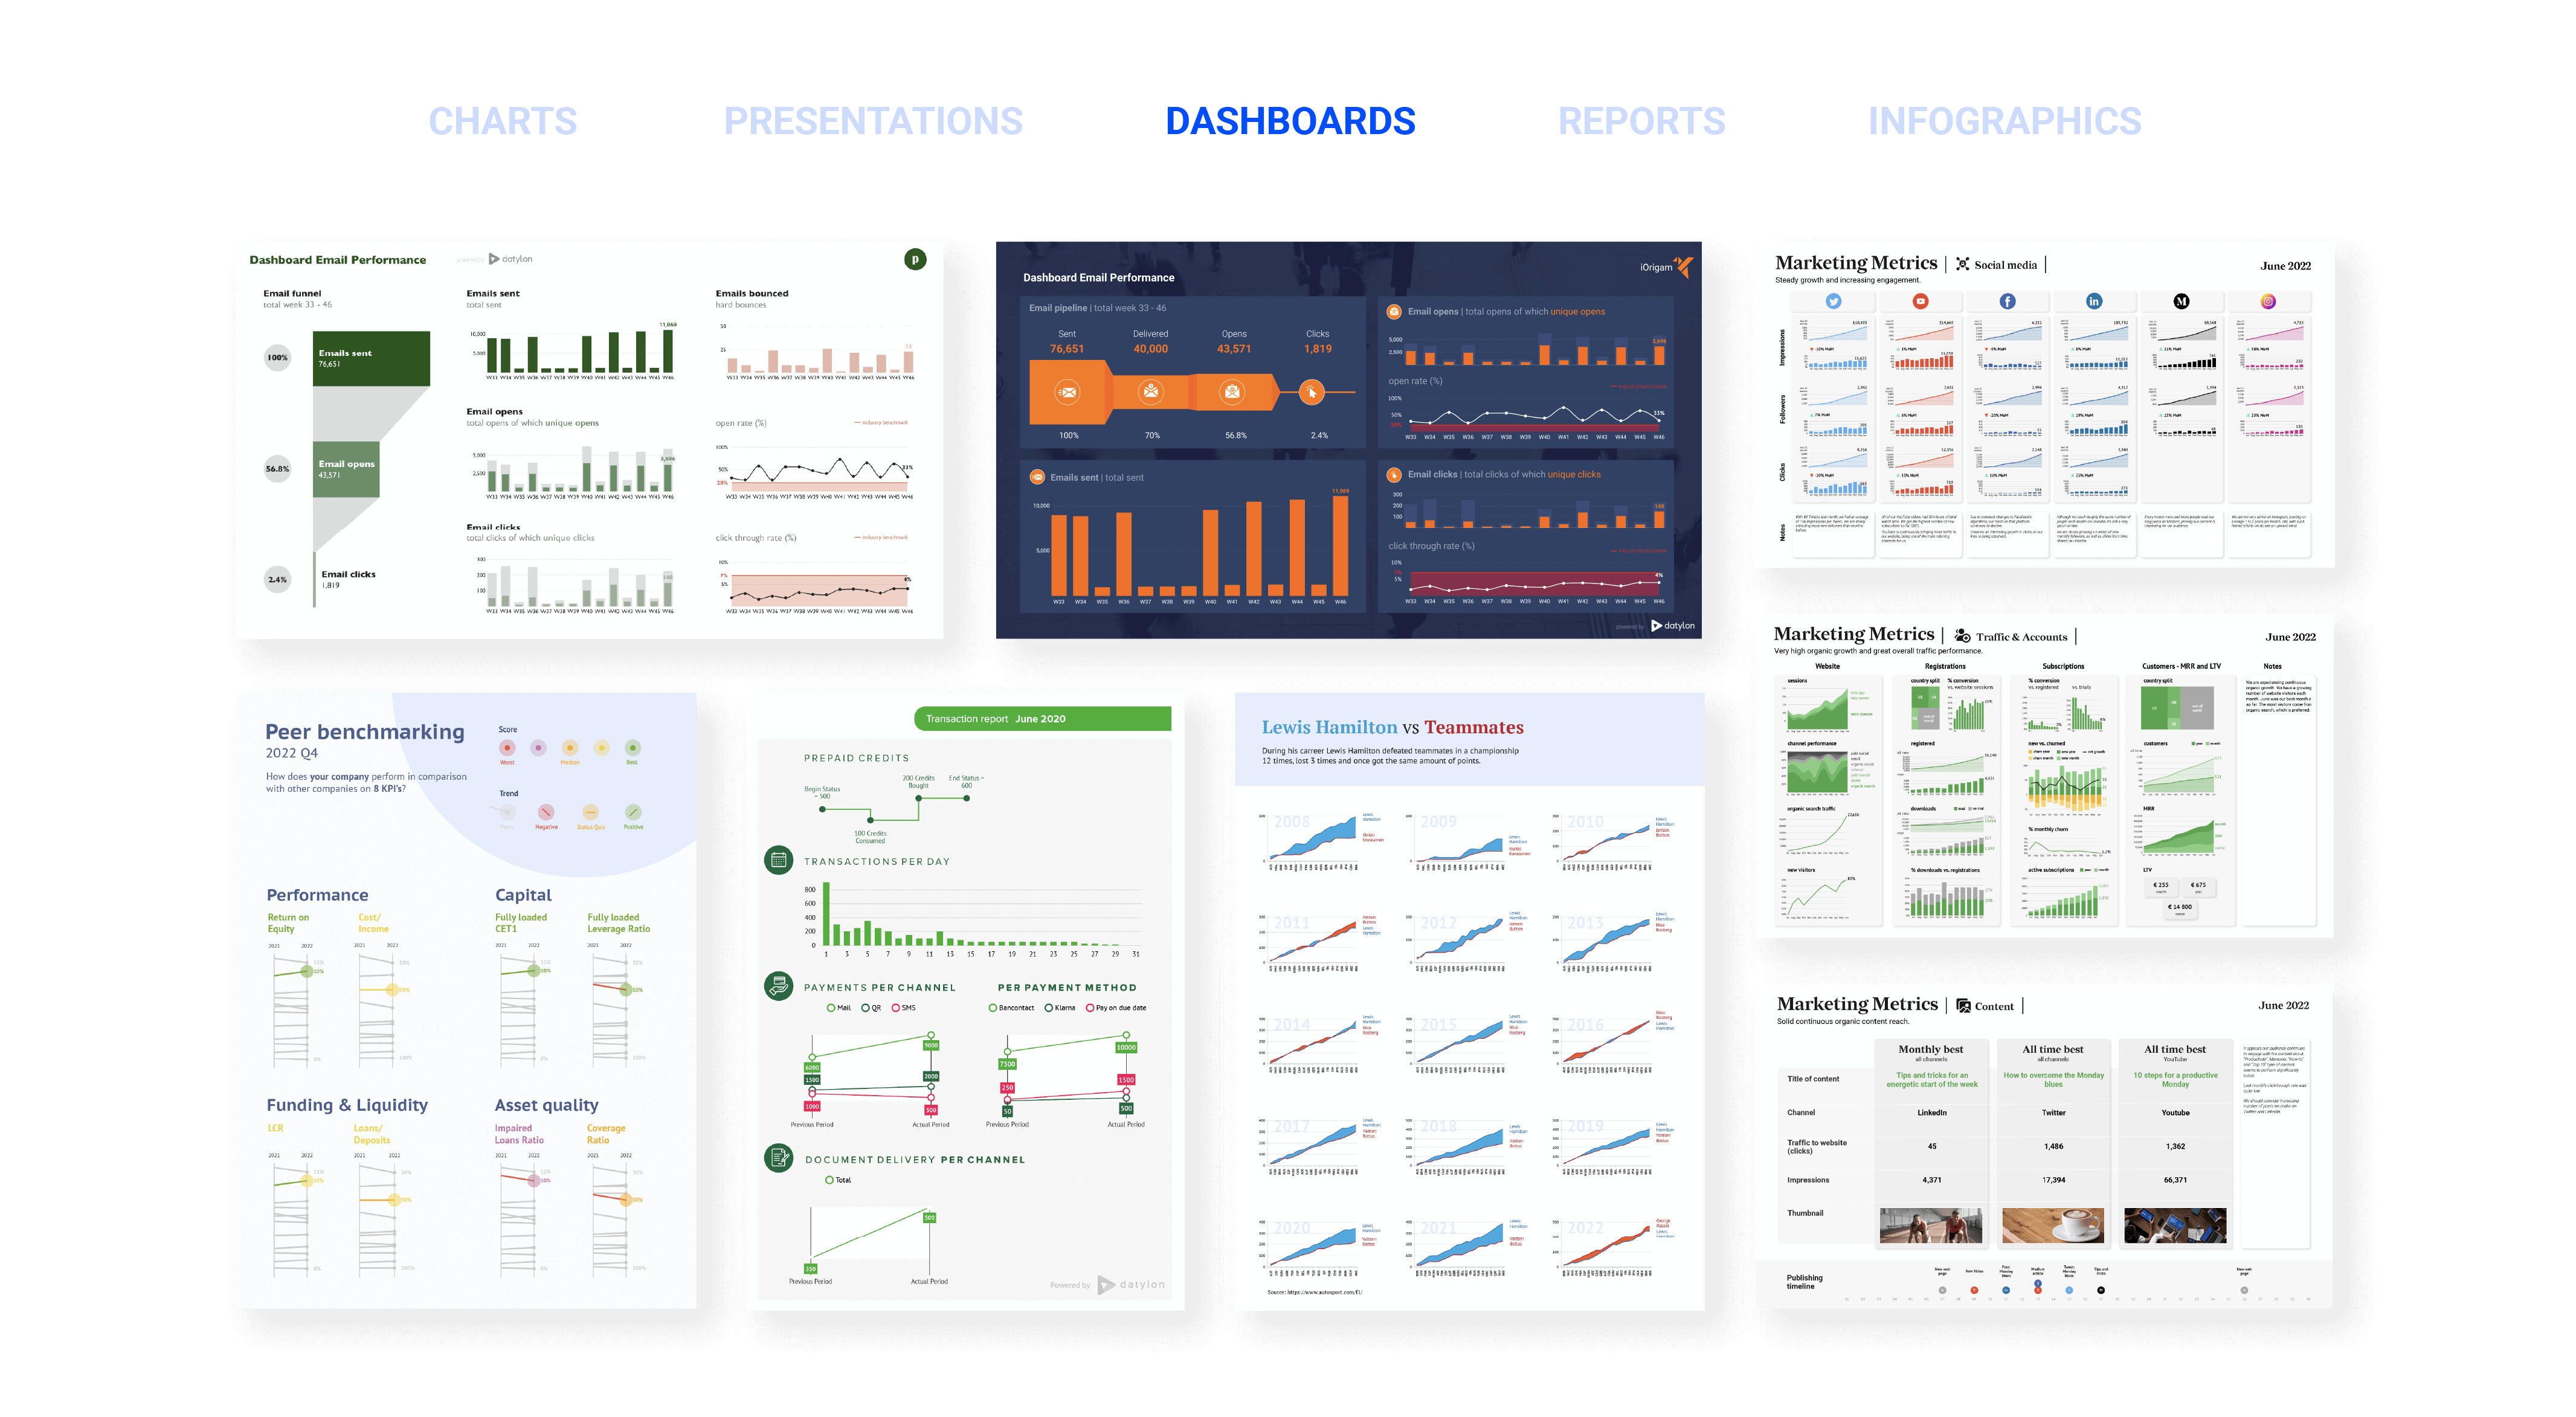
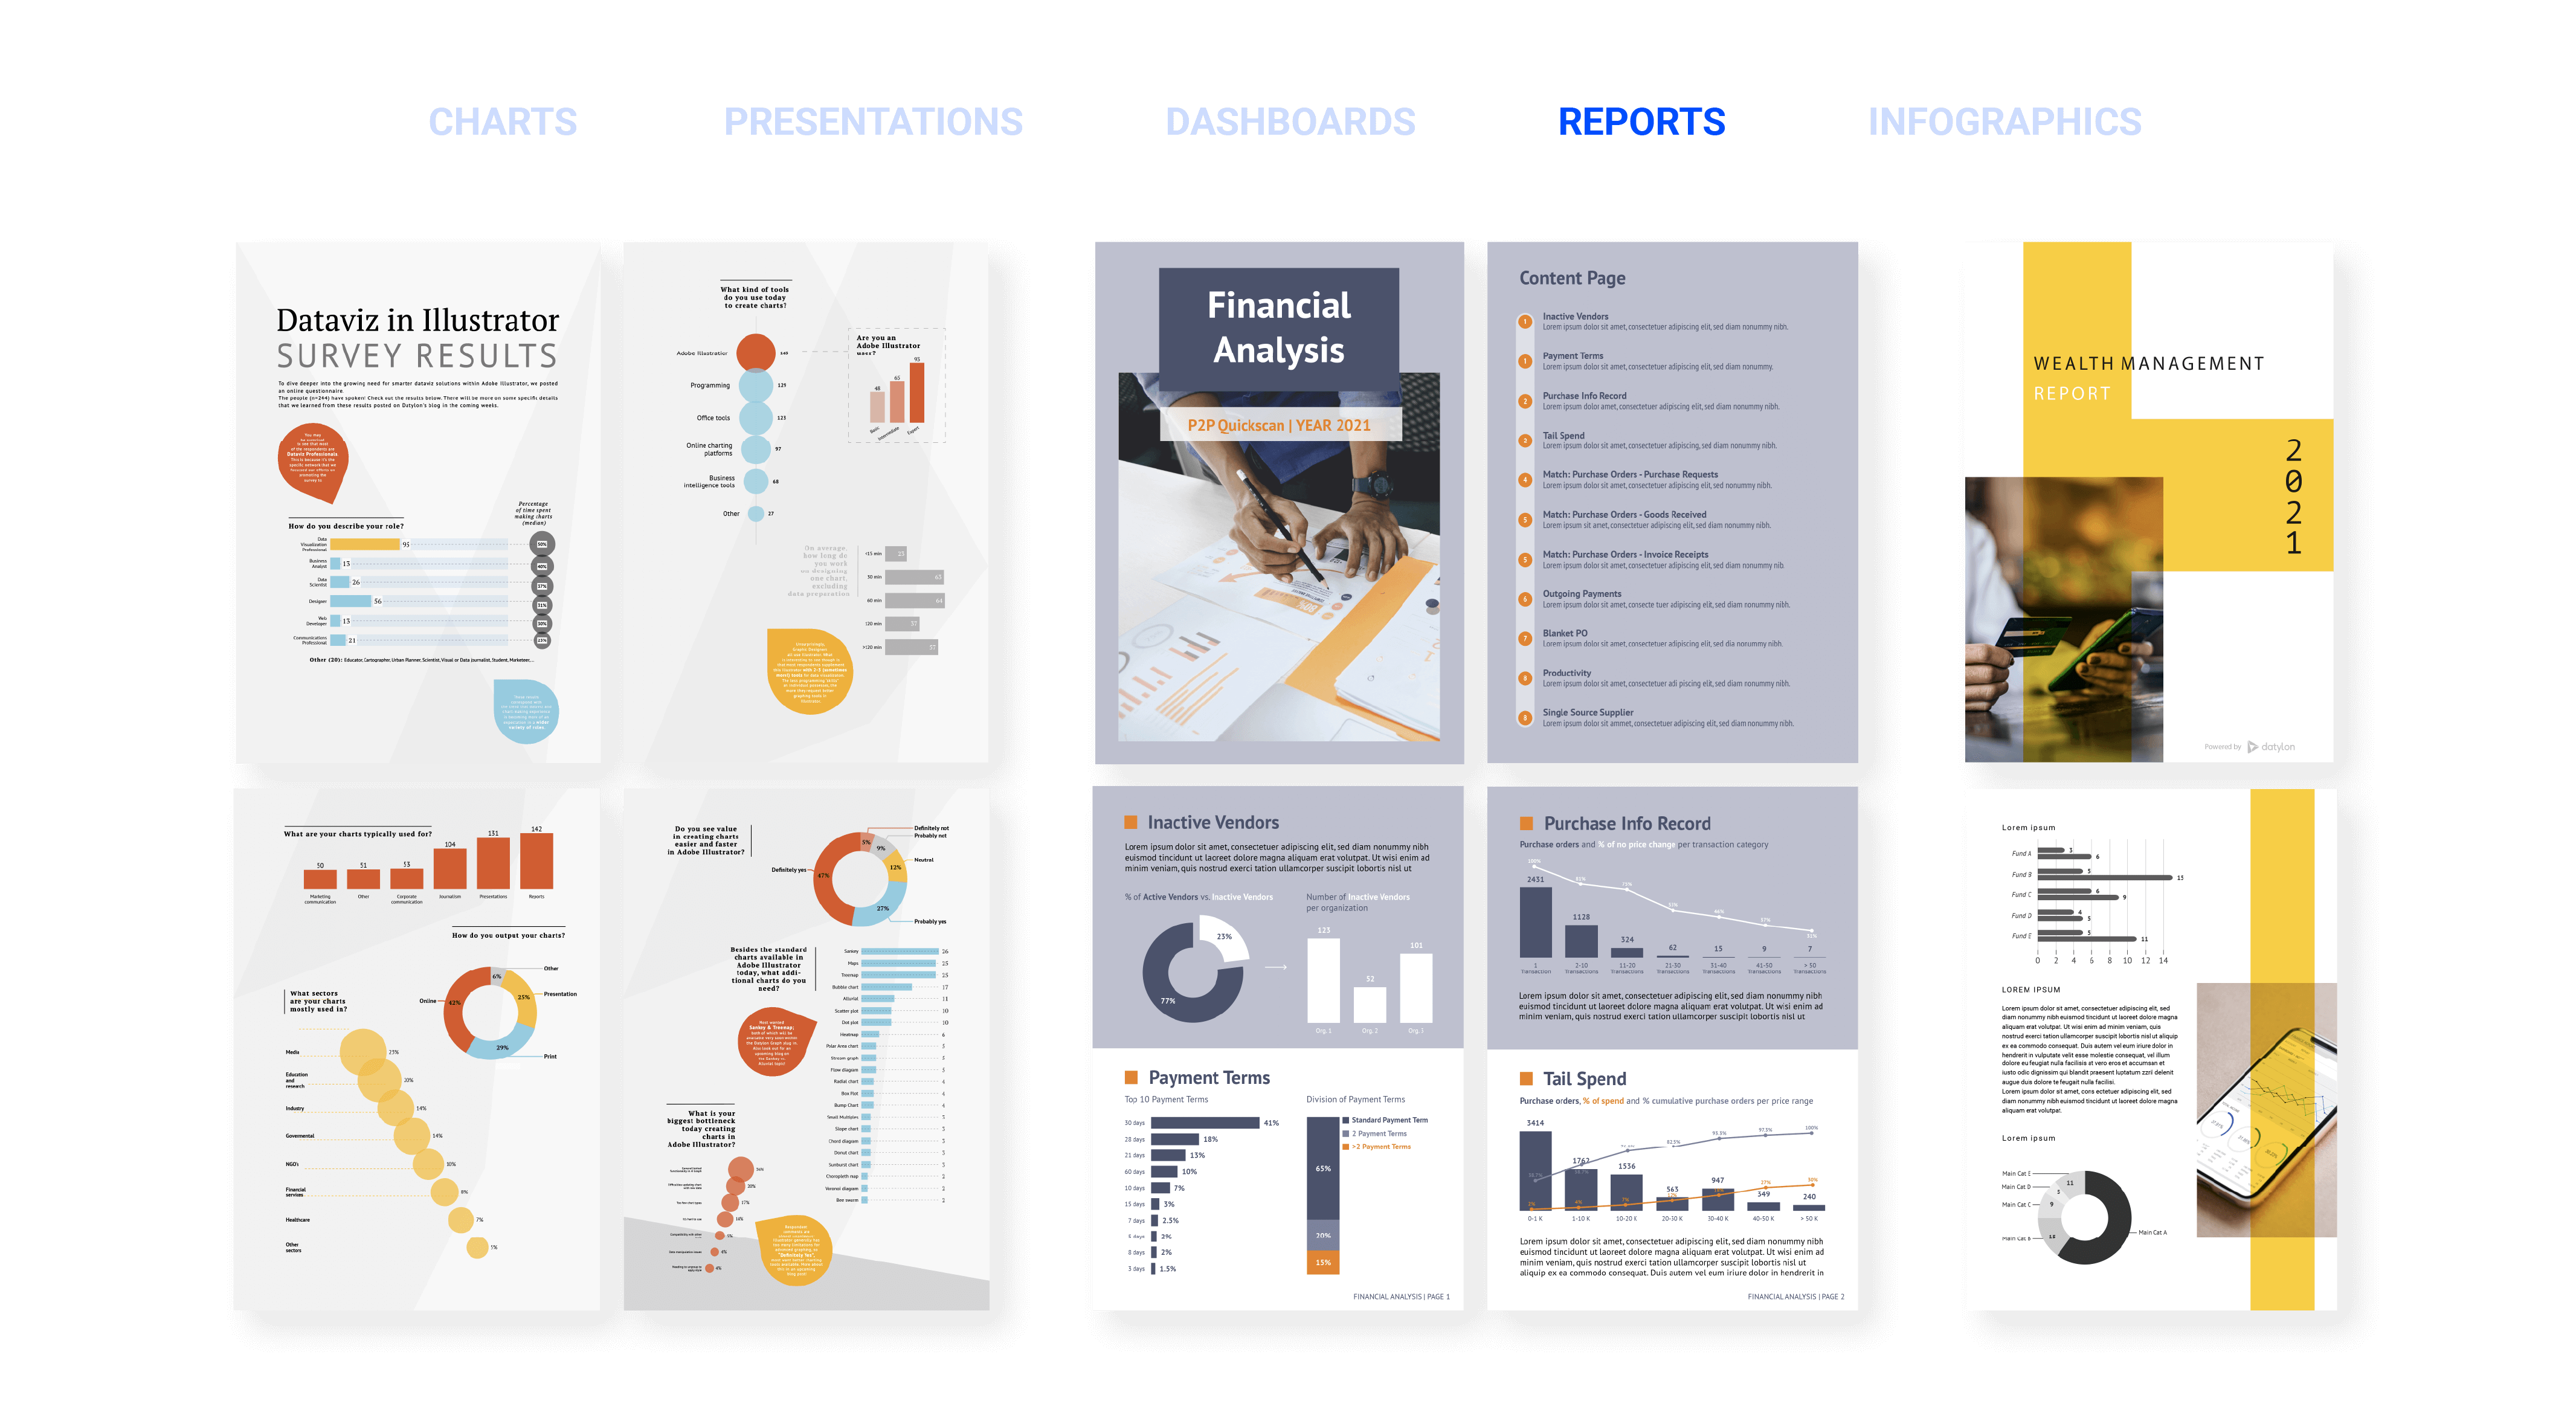
RESOURCES

Chart Library

Below you will find a selection of charts you can make with Datylon. Learn more about each chart and discover new design tips!

Datylon | Bar chart | Hardly an introduction needed. Perfect to compare size, show ranking, and much more

Bar chart

No introduction needed. Ideal for comparisons, rankings, and more. Read more
Datylon | Column chart | Similar to a bar chart and all its variants but this one is vertical

Column chart

Similar to a bar chart and its variants, but this one is vertical.

Read more
Datylon | Stacked column chart | Shows part to whole relationships in a column chart

Stacked column chart

Displays part-to-whole relationships in a column chart.

Read more
Datylon | Grouped column chart | Grouped (or paired) column chart is your friend if you wish to compare multiple series

Grouped column chart

Frequently used chart for comparing multiple series.

Read more
Datylon | Lollipop chart | Too many categories for a bar chart? Use a lollipop chart and focus on the data value

Lollipop chart

Too many categories for a bar chart? Use a lollipop chart and focus on the data value.

Explore more
Datylon | Diverging bar chart | Compare two sets of data. Up-down, left-right. Easy peasy

Diverging bar chart

Compare two sets of data. Up-down, left-right. Easy peasy.

Explore more
Datylon | Pyramid chart | Excellent for creating population pyramids

Pyramid chart

Excellent for creating population pyramids.

Explore more
Datylon | Histogram chart | Represents the distribution of numeric data. Smooth variation of a histogram

Histogram chart

Looks like a bar chart but fulfills other functions. It shows numerical data distributed into bins.
Explore more
Datylon | Line chart | A well-known standard. But can be styled to the smallest detail to add your own signature

Line chart

A well-known standard. But can be styled to the smallest detail to add your own signature.

Explore more
Datylon | Bump chart | A variant of a line chart. Ideal to show changes in rank over time

Bump chart

A variant of a line chart. Ideal to show changes in rank over time. 

Explore more
Datylon | Slope chart | Compare two data points. Or show

Slope chart

Compare two data points. Or show "before and after". Slope charts are easy to read and ideal to convince. 

Explore more
Datylon | Dot plot | Visualizing numerical values per category in a very space-efficient way

Dot plot

Visualizing numerical values per category in a very space-efficient way.

Explore more
Datylon | Area chart | Emphasize the area between axis and line with colors

Area chart

Emphasize the area between axis and line with colors.

Explore more
Datylon | Stacked area chart | A type of an area chart showing a part-to-whole relationship

Stacked area chart

A type of an area chart showing a part-to-whole relationship.

Explore more
Datylon | Stream graph | A beautiful variation of a stacked area chart with a central baseline instead of a fixed axis

Stream graph

A beautiful variation of a stacked area chart with a central baseline instead of a fixed axis.

Explore more
Datylon | Density plot | Represents the distribution of a numeric value. Kind of a smooth histogram.

Density plot

Represents the distribution of a numeric value. Kind of a smooth histogram.

Explore more
Datylon | Scatter plot | The swiss knife of data visualization. Used to find correlations and identify patterns

Scatter plot

The swiss knife of data visualization. Used to find correlations and identify patterns.

Explore more
Datylon | Bubble chart | Add a third dimension to a scatter plot. Enjoy the bubbles

Bubble chart

Add a third dimension to a scatter plot. Enjoy the bubbles.

Explore more
Datylon | Categorical scatter plot | Visualizes the distribution of several categorical variables

Categorical scatter plot

Visualizes the distribution of several categorical variables.

Explore more
Datylon | Heatmap | Show data variances by color, hue or intensity unveiling obvious visual cues

Heatmap

Show data variances by color, hue or intensity unveiling obvious visual cues.

Explore more
Datylon | Pie chart | A circular graph that visualizes a part-to-whole relationship

Pie chart

A circular graph that visualizes a part-to-whole relationship.

Explore more
Datylon | Donut chart | Similar to a pie chart, but with center space to include more information

Donut chart

Similar to a pie chart, but with center space to include more information.

Explore more
Datylon | Semicircle donut chart | Often used as a more stylish alternative for a gauge

Semicircle donut chart

Often used as a more stylish alternative for a gauge.  

Explore more
Datylon | Nightingale chart | Florence Nightingale's heritage. Kind of a stacked bar chart wrapped in a pie chart

Nightingale chart

Florence Nightingale's heritage. Kind of a stacked bar chart wrapped in a pie chart.

Explore more
Datylon | Arrow chart | Shows a range between two values as well as the direction of the changes

Arrow chart

Shows a range between two values as well as the direction of the changes.

Explore more
Datylon | Range plot | Shows a range between two values for a number of different categories

Range plot

Shows a range between two values for a number of different categories.

Explore more
Datylon | Icon chart | Great for comparing wide-ranged variables. Different icon types and data-driven coloring can add a different dimension

Icon chart

Great for comparing wide-ranged variables. Different icon types and data-driven coloring can add a different dimension.

Explore more
Datylon | Icon array chart | An easy to interpret chart with sorted multiple icons representing the same value

Icon array

An easy to interpret chart with sorted multiple icons representing the same value.

Explore more
Datylon | Bullet chart | A bar in a bar. Designed to benchmark against a target value and ranges. Versatile and so space efficient

Bullet chart

A bar in a bar. Designed to benchmark against a target value and ranges. Versatile and so space efficient. 

Explore more
Datylon | Treemap | Treemap is perfect for visualizing hierarchical structures in a compact way

Treemap

Treemap is perfect for visualizing hierarchical structures in a compact way.

Explore more
Datylon | Text object | Make your chart re-usable and add titles,  annotations or complete text blocks driven by data

Text object

Make your chart reusable and add titles, annotations, or complete text blocks driven by data.

Explore more
Datylon | Your own chart | Some data deserves special attention. Contact us for custom charts

Your own chart?

Some data deserves special attention. Contact us for custom charts.

Contact us

Supercharge your chart designs

Datylon gives you tools to design and share beautiful and impactful data stories. Create a free account and get started with your design today.

Find your next chart inspiration

Below you will find examples of charts, reports, infographics, and other data stories created with Datylon tools. Get a taste of what Datylon can do for you.