


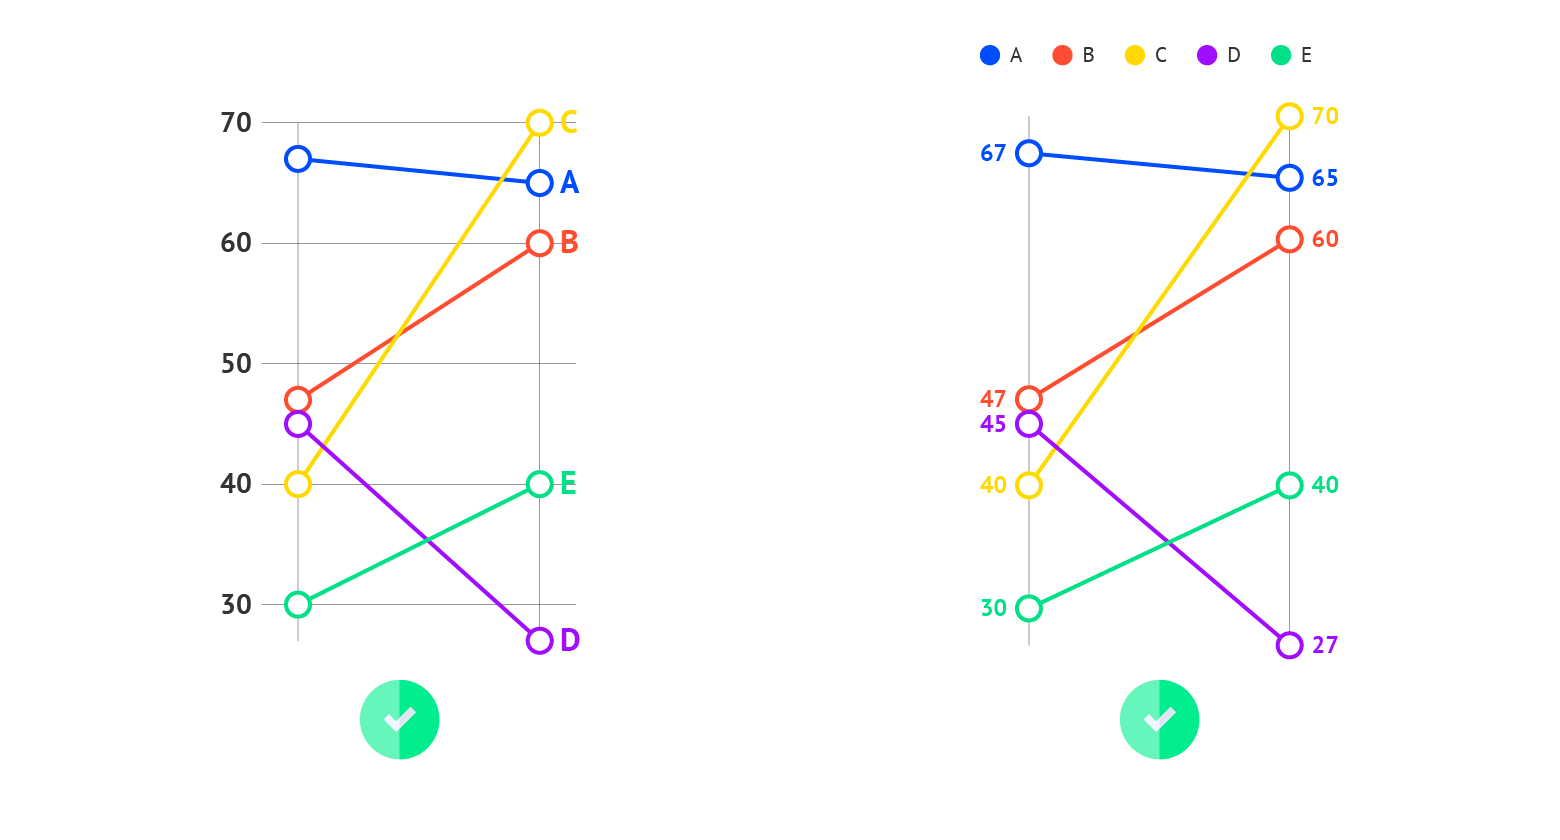
Labeling
You can label the data in your slope chart directly or via a legend. In general, direct labeling is preferred. This is more beneficial as the viewer does not have to switch between the chart and the legend to learn which lines correspond to which category. Moreover, it makes it easier to read the chart by color blind people or readers of the chart printed in greyscale. To make it even easier for your viewer, color-code the label with the same color as the corresponding line. In Datylon chart maker you can use the color link option to make the colors of the Direct Labels the same as the corresponding lines.
Read more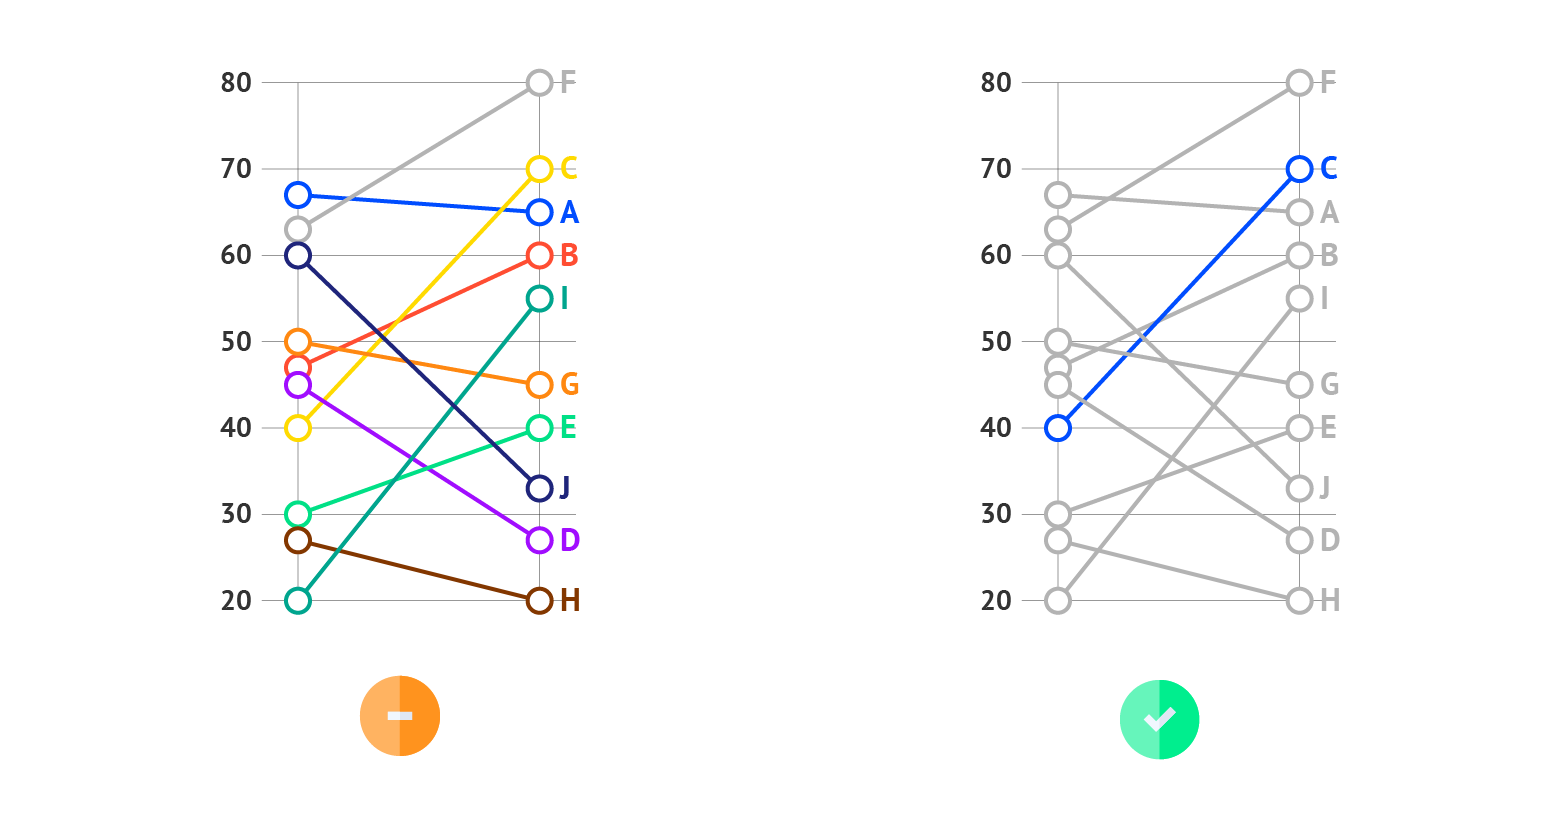
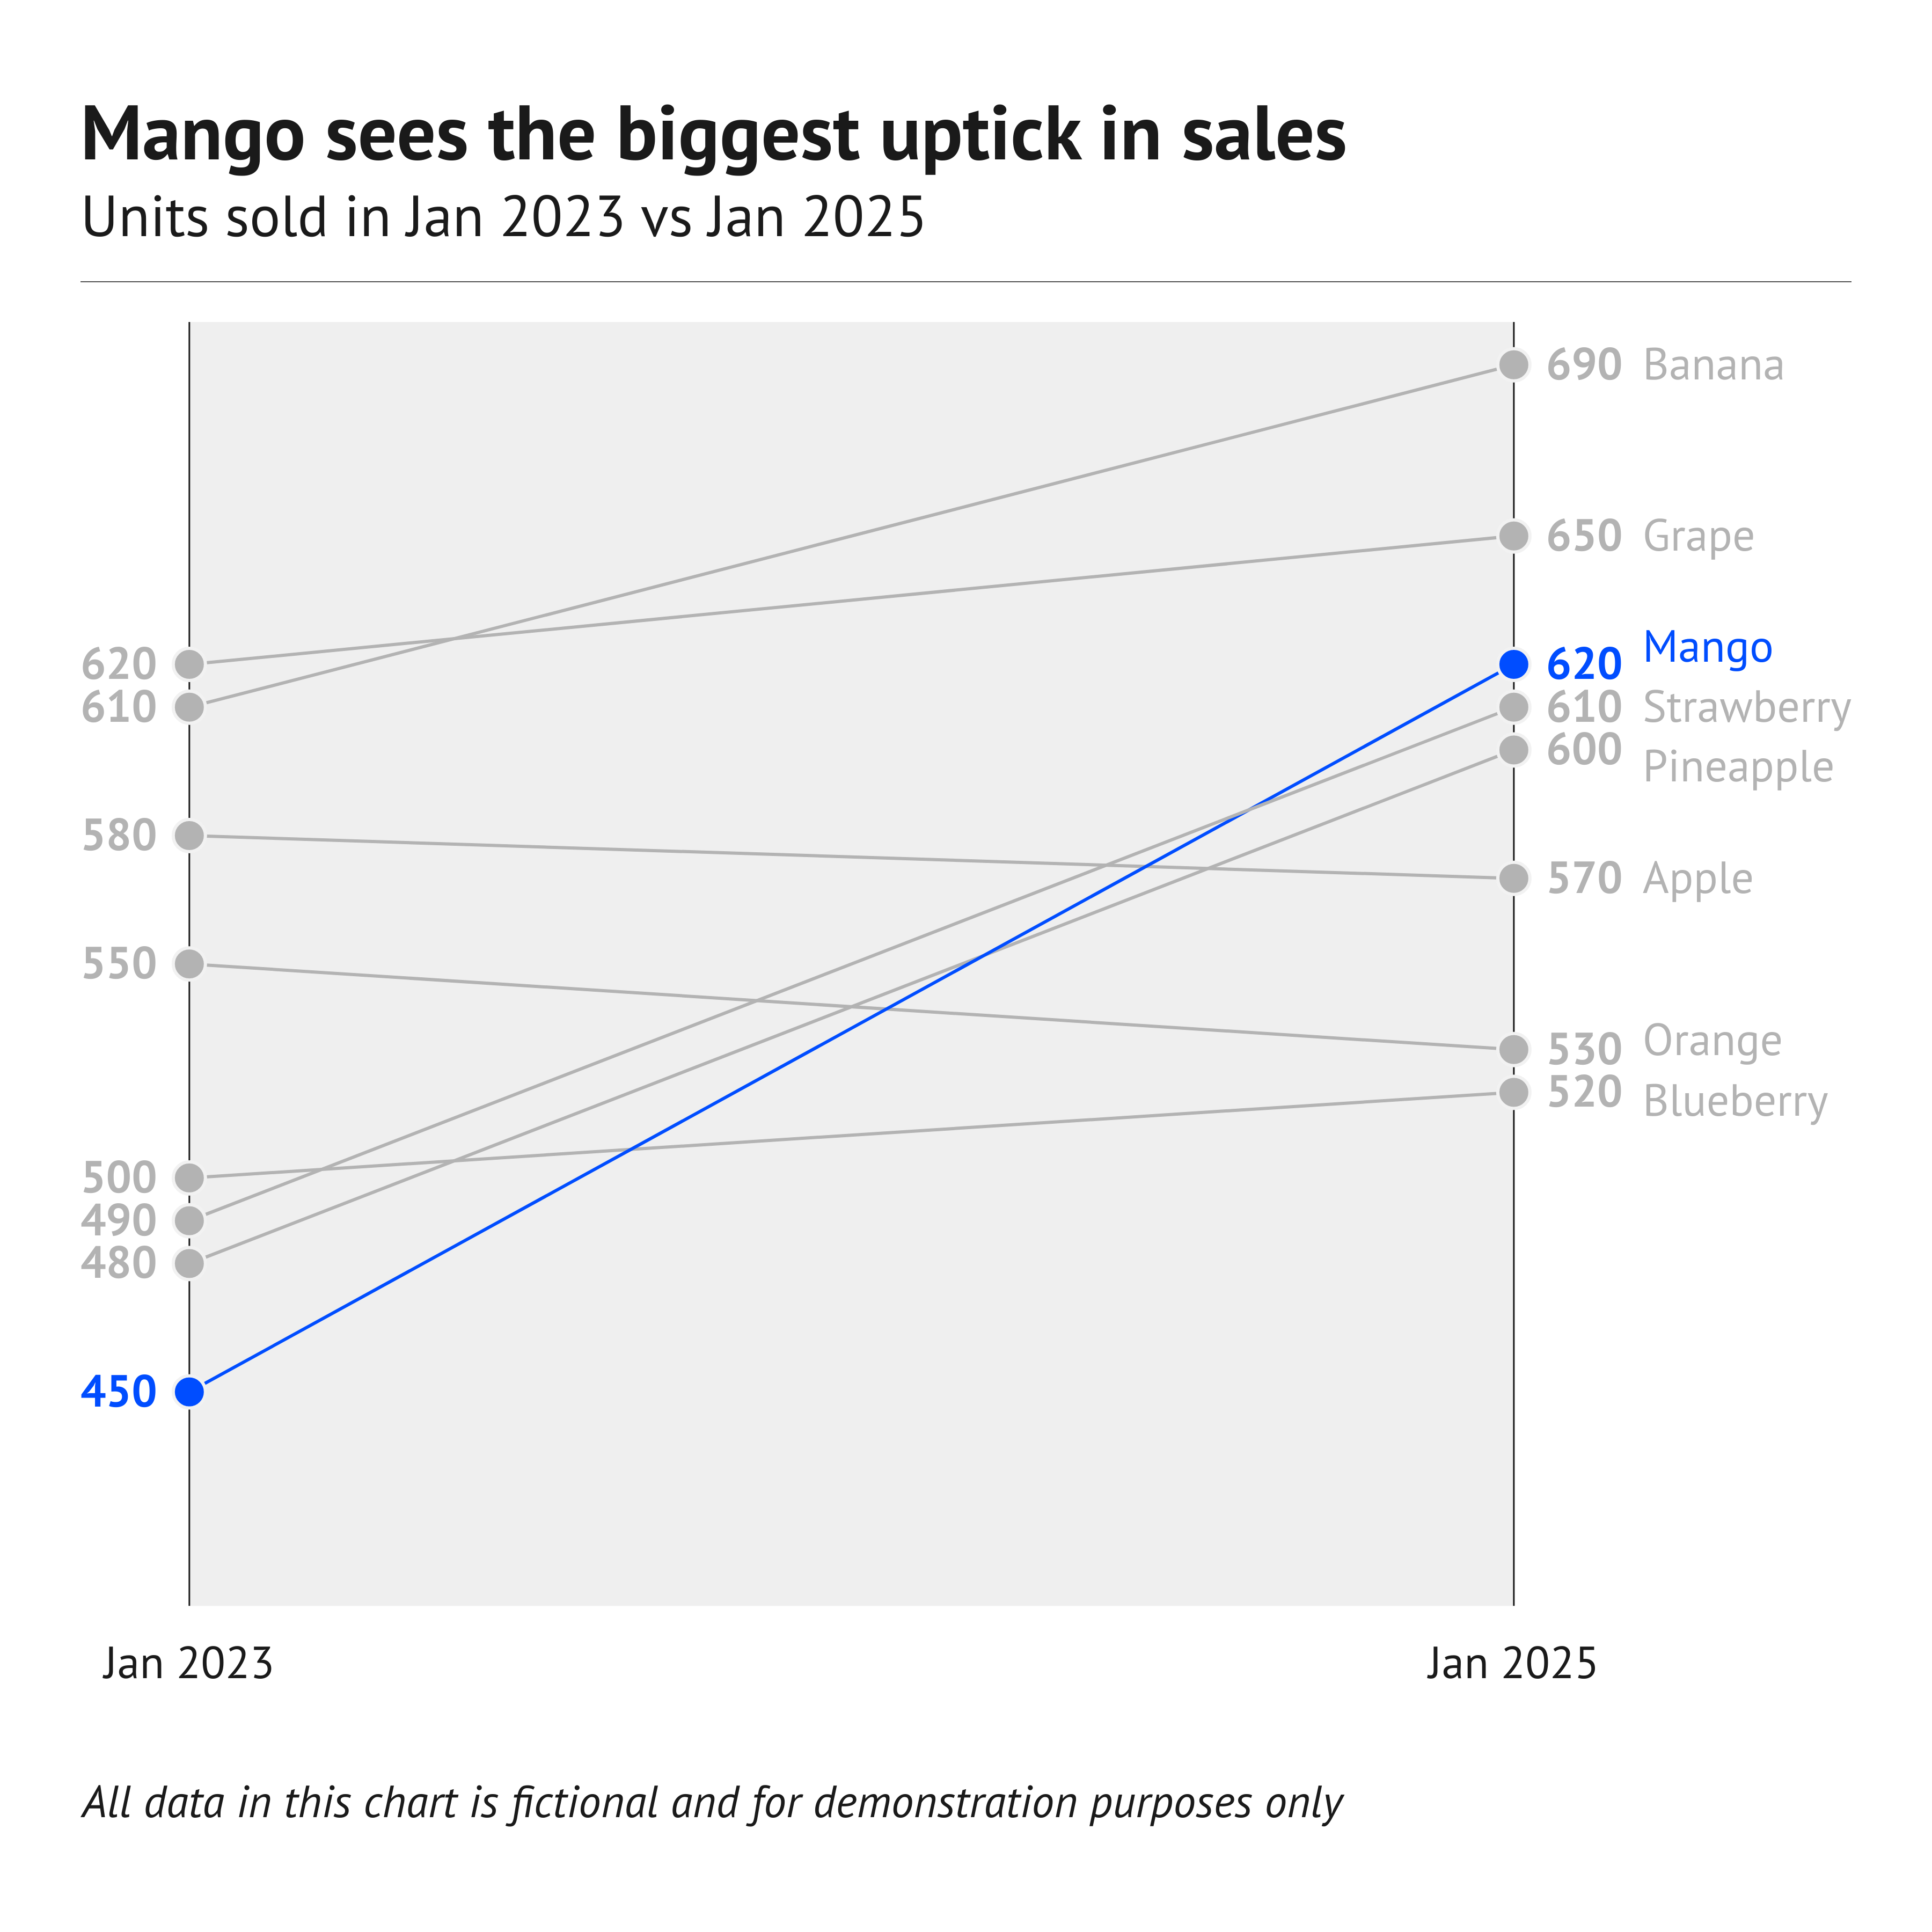
Highlighting
To draw attention to the most important categories of the slope chart, a good solution is to highlight one line and color all the other lines the same way in a basic color. Our brain is programmed to notice deviations instantly. This can be done, for example, by applying changes in size, movement, or color. This way, highlighting a specific line will help catch the reader’s eye immediately.
Read more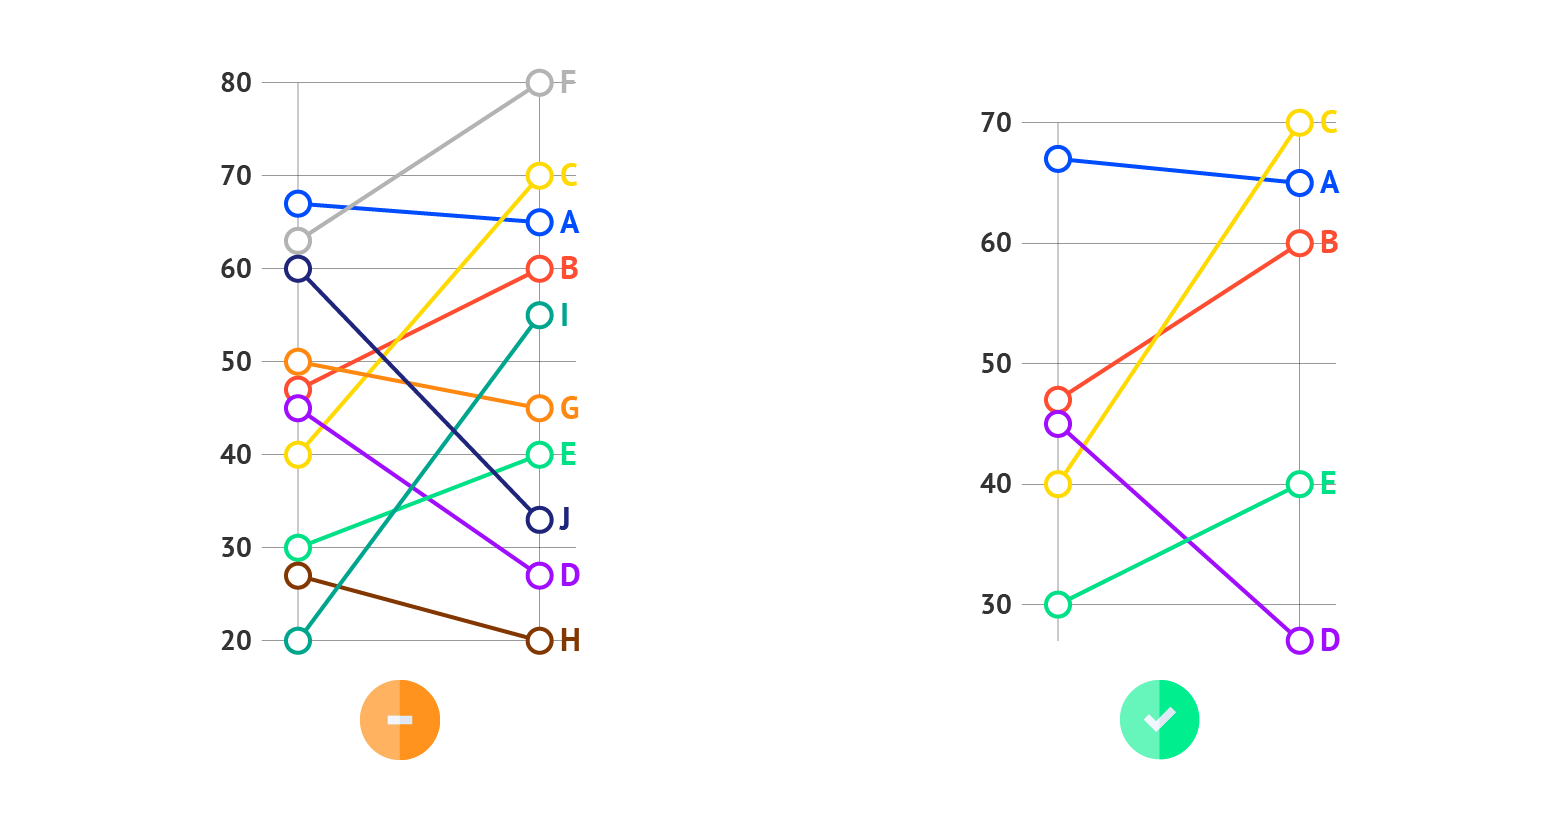
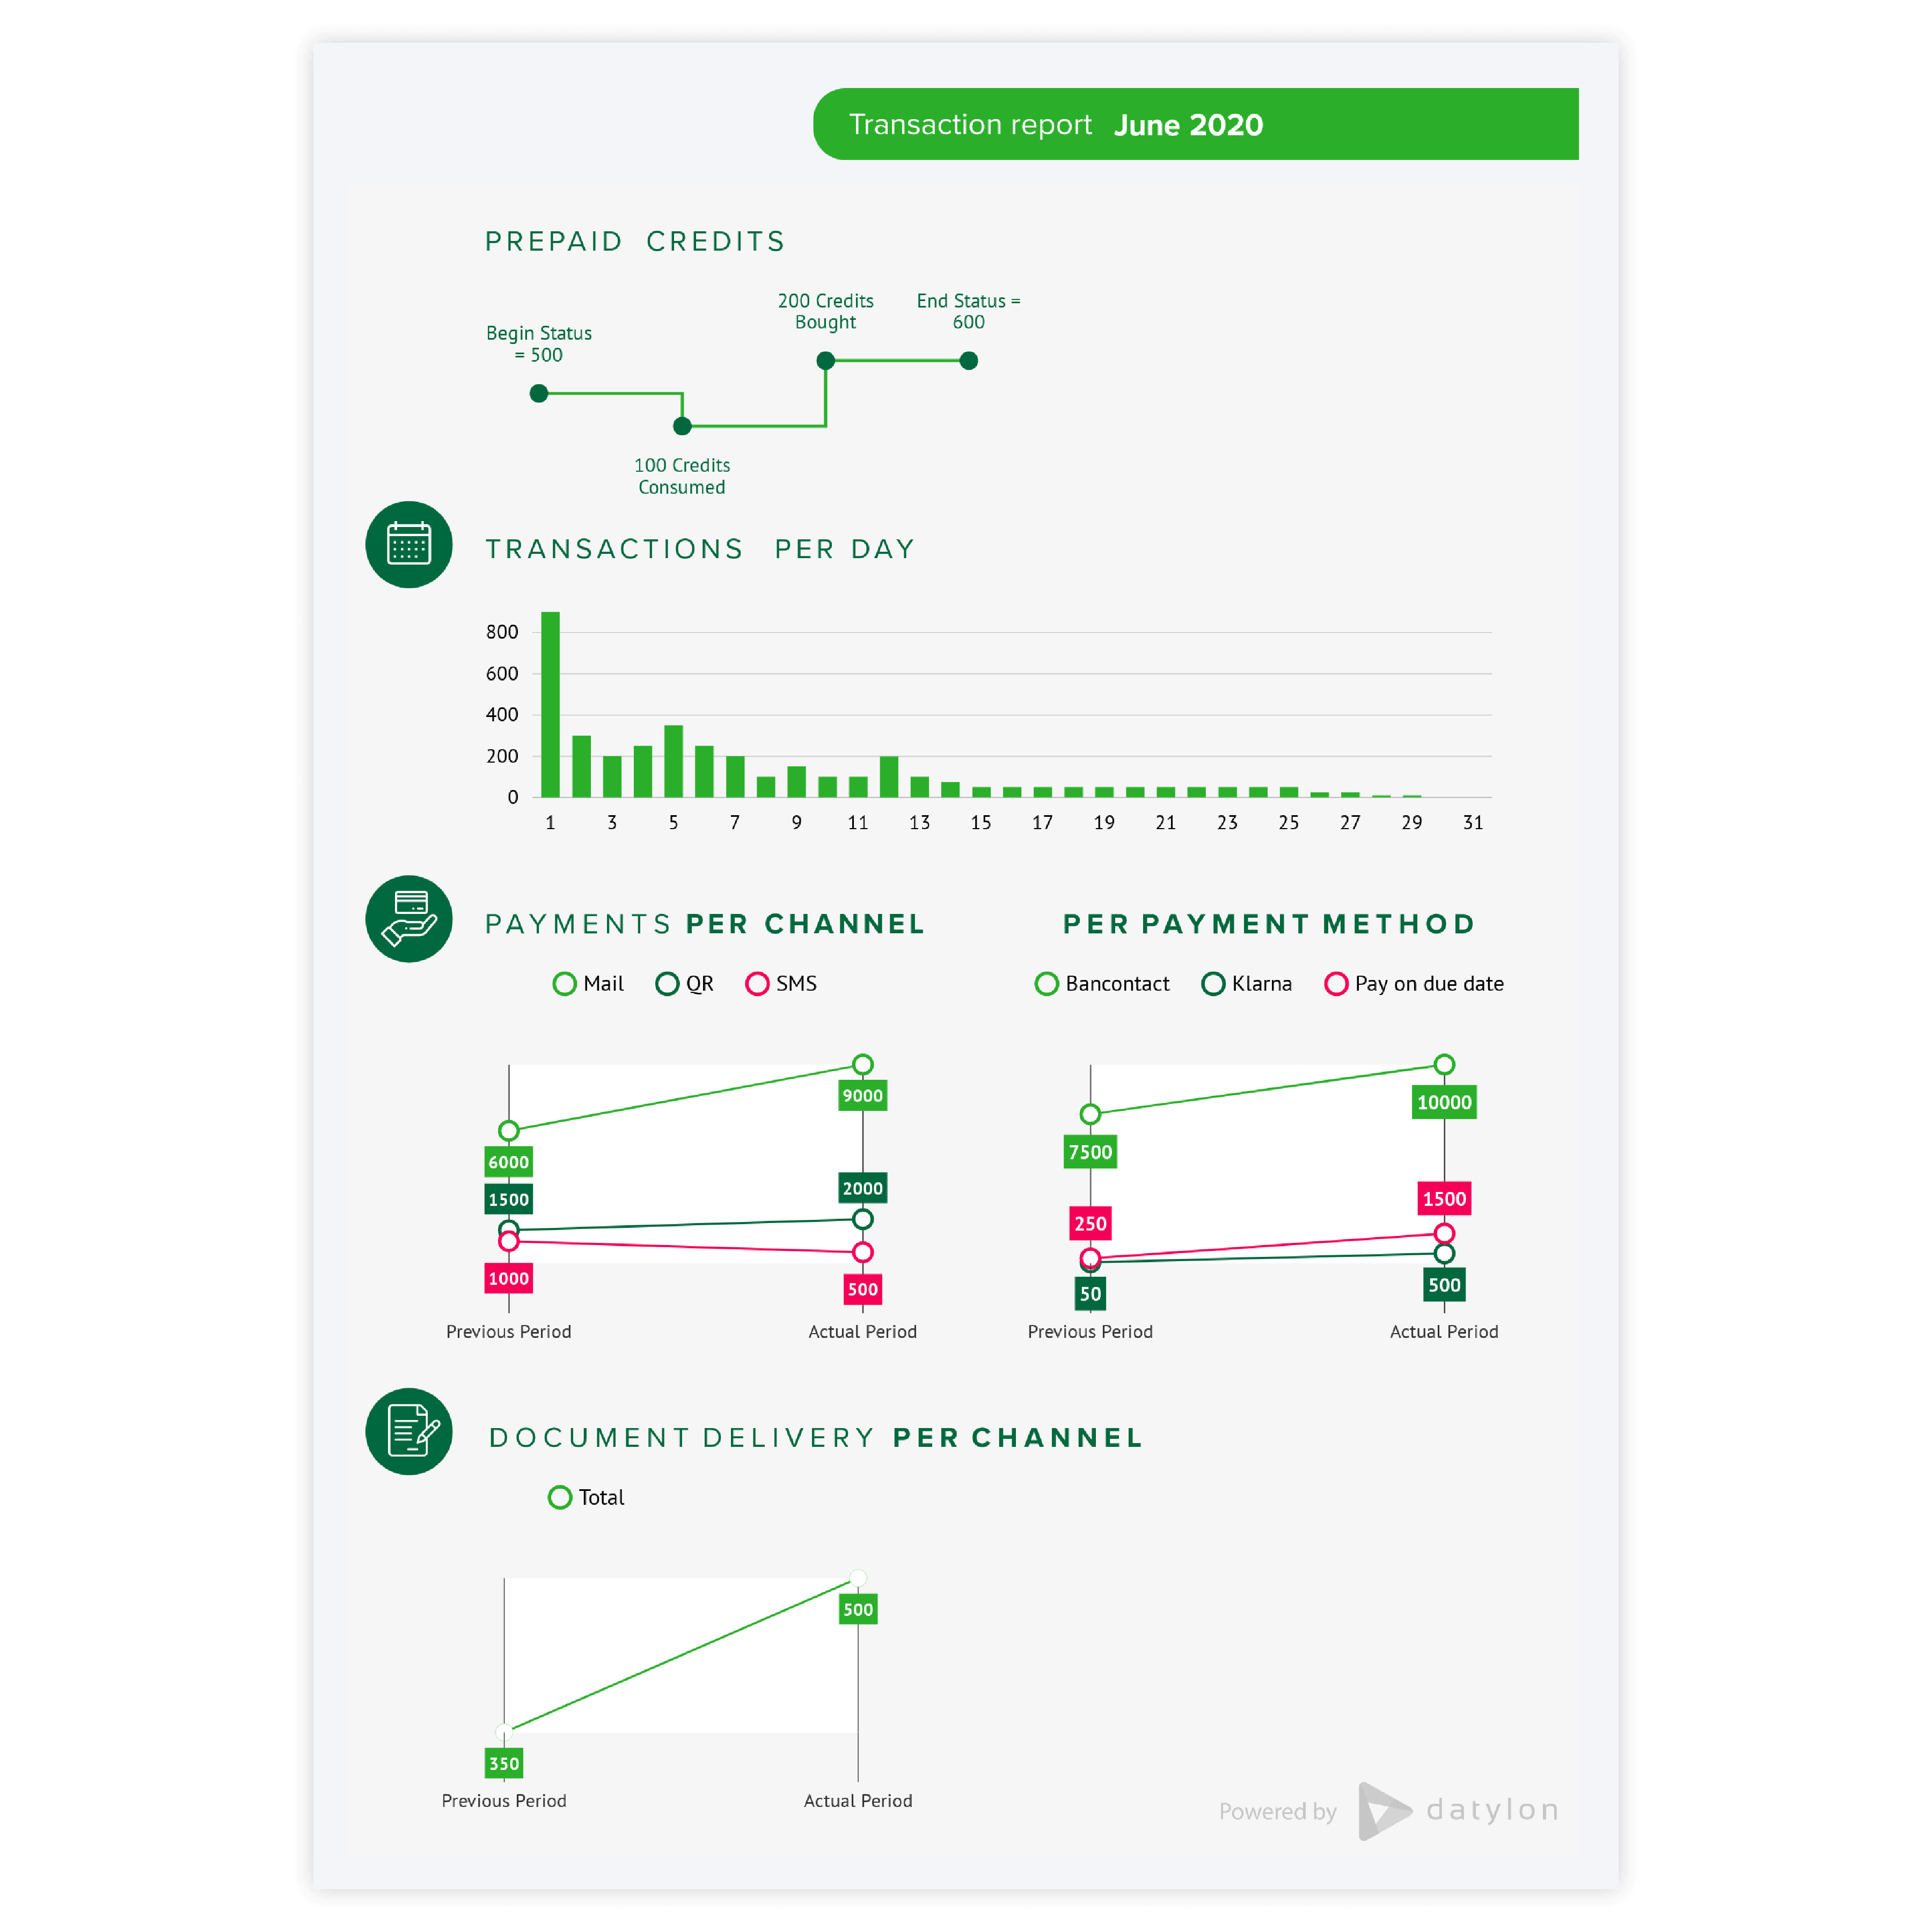
Number of lines
To avoid an overflowing chart, try to minimize colored lines to a maximum number of five lines. Too many lines are really hard to compare and trends become less visible. When it is not possible to minimize the number of lines to a maximum of five lines, highlight the most important lines in your chart.
Read more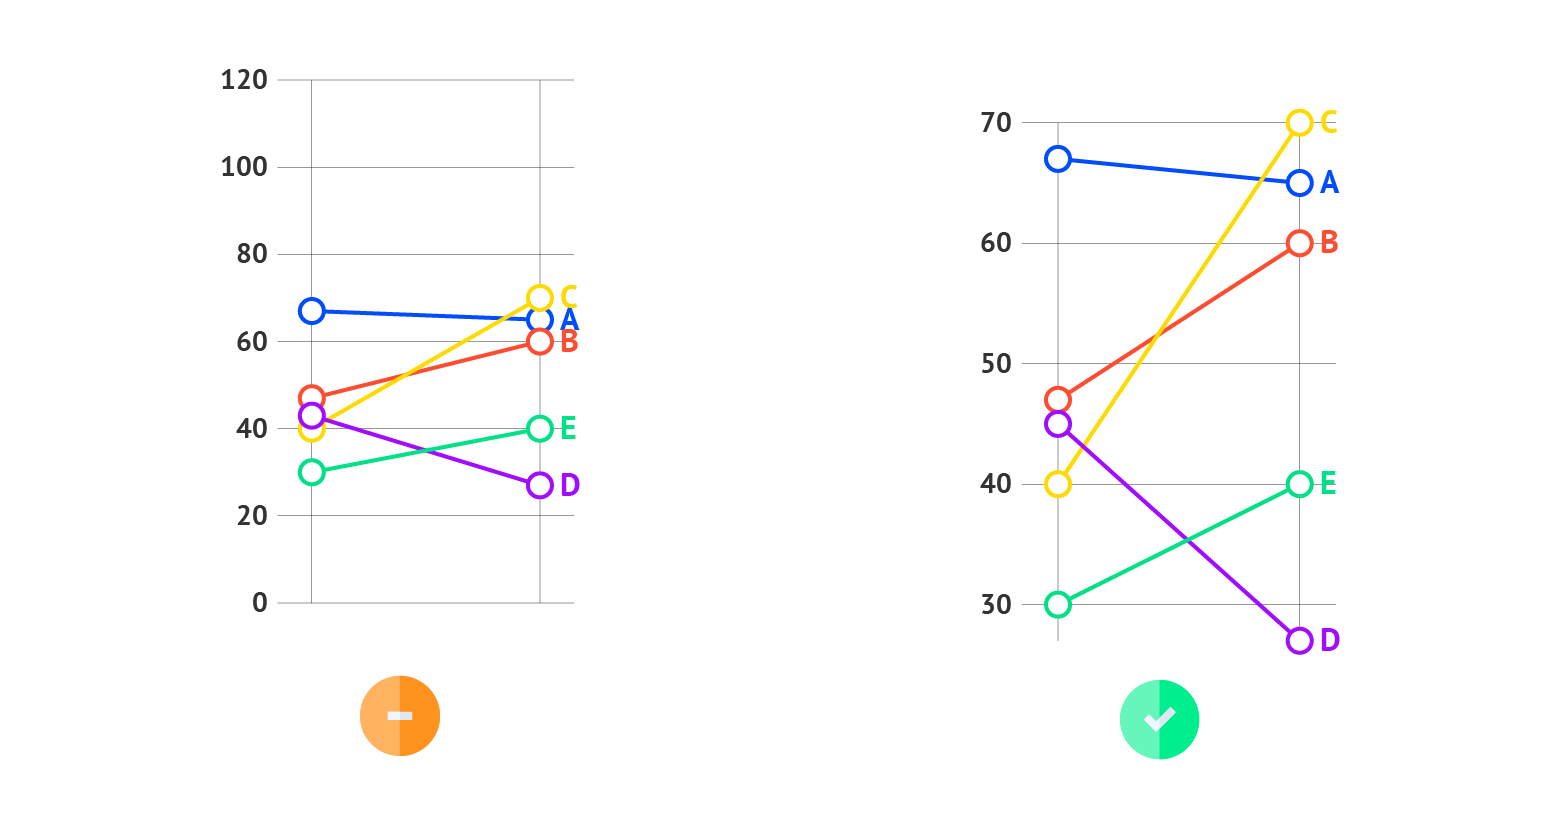
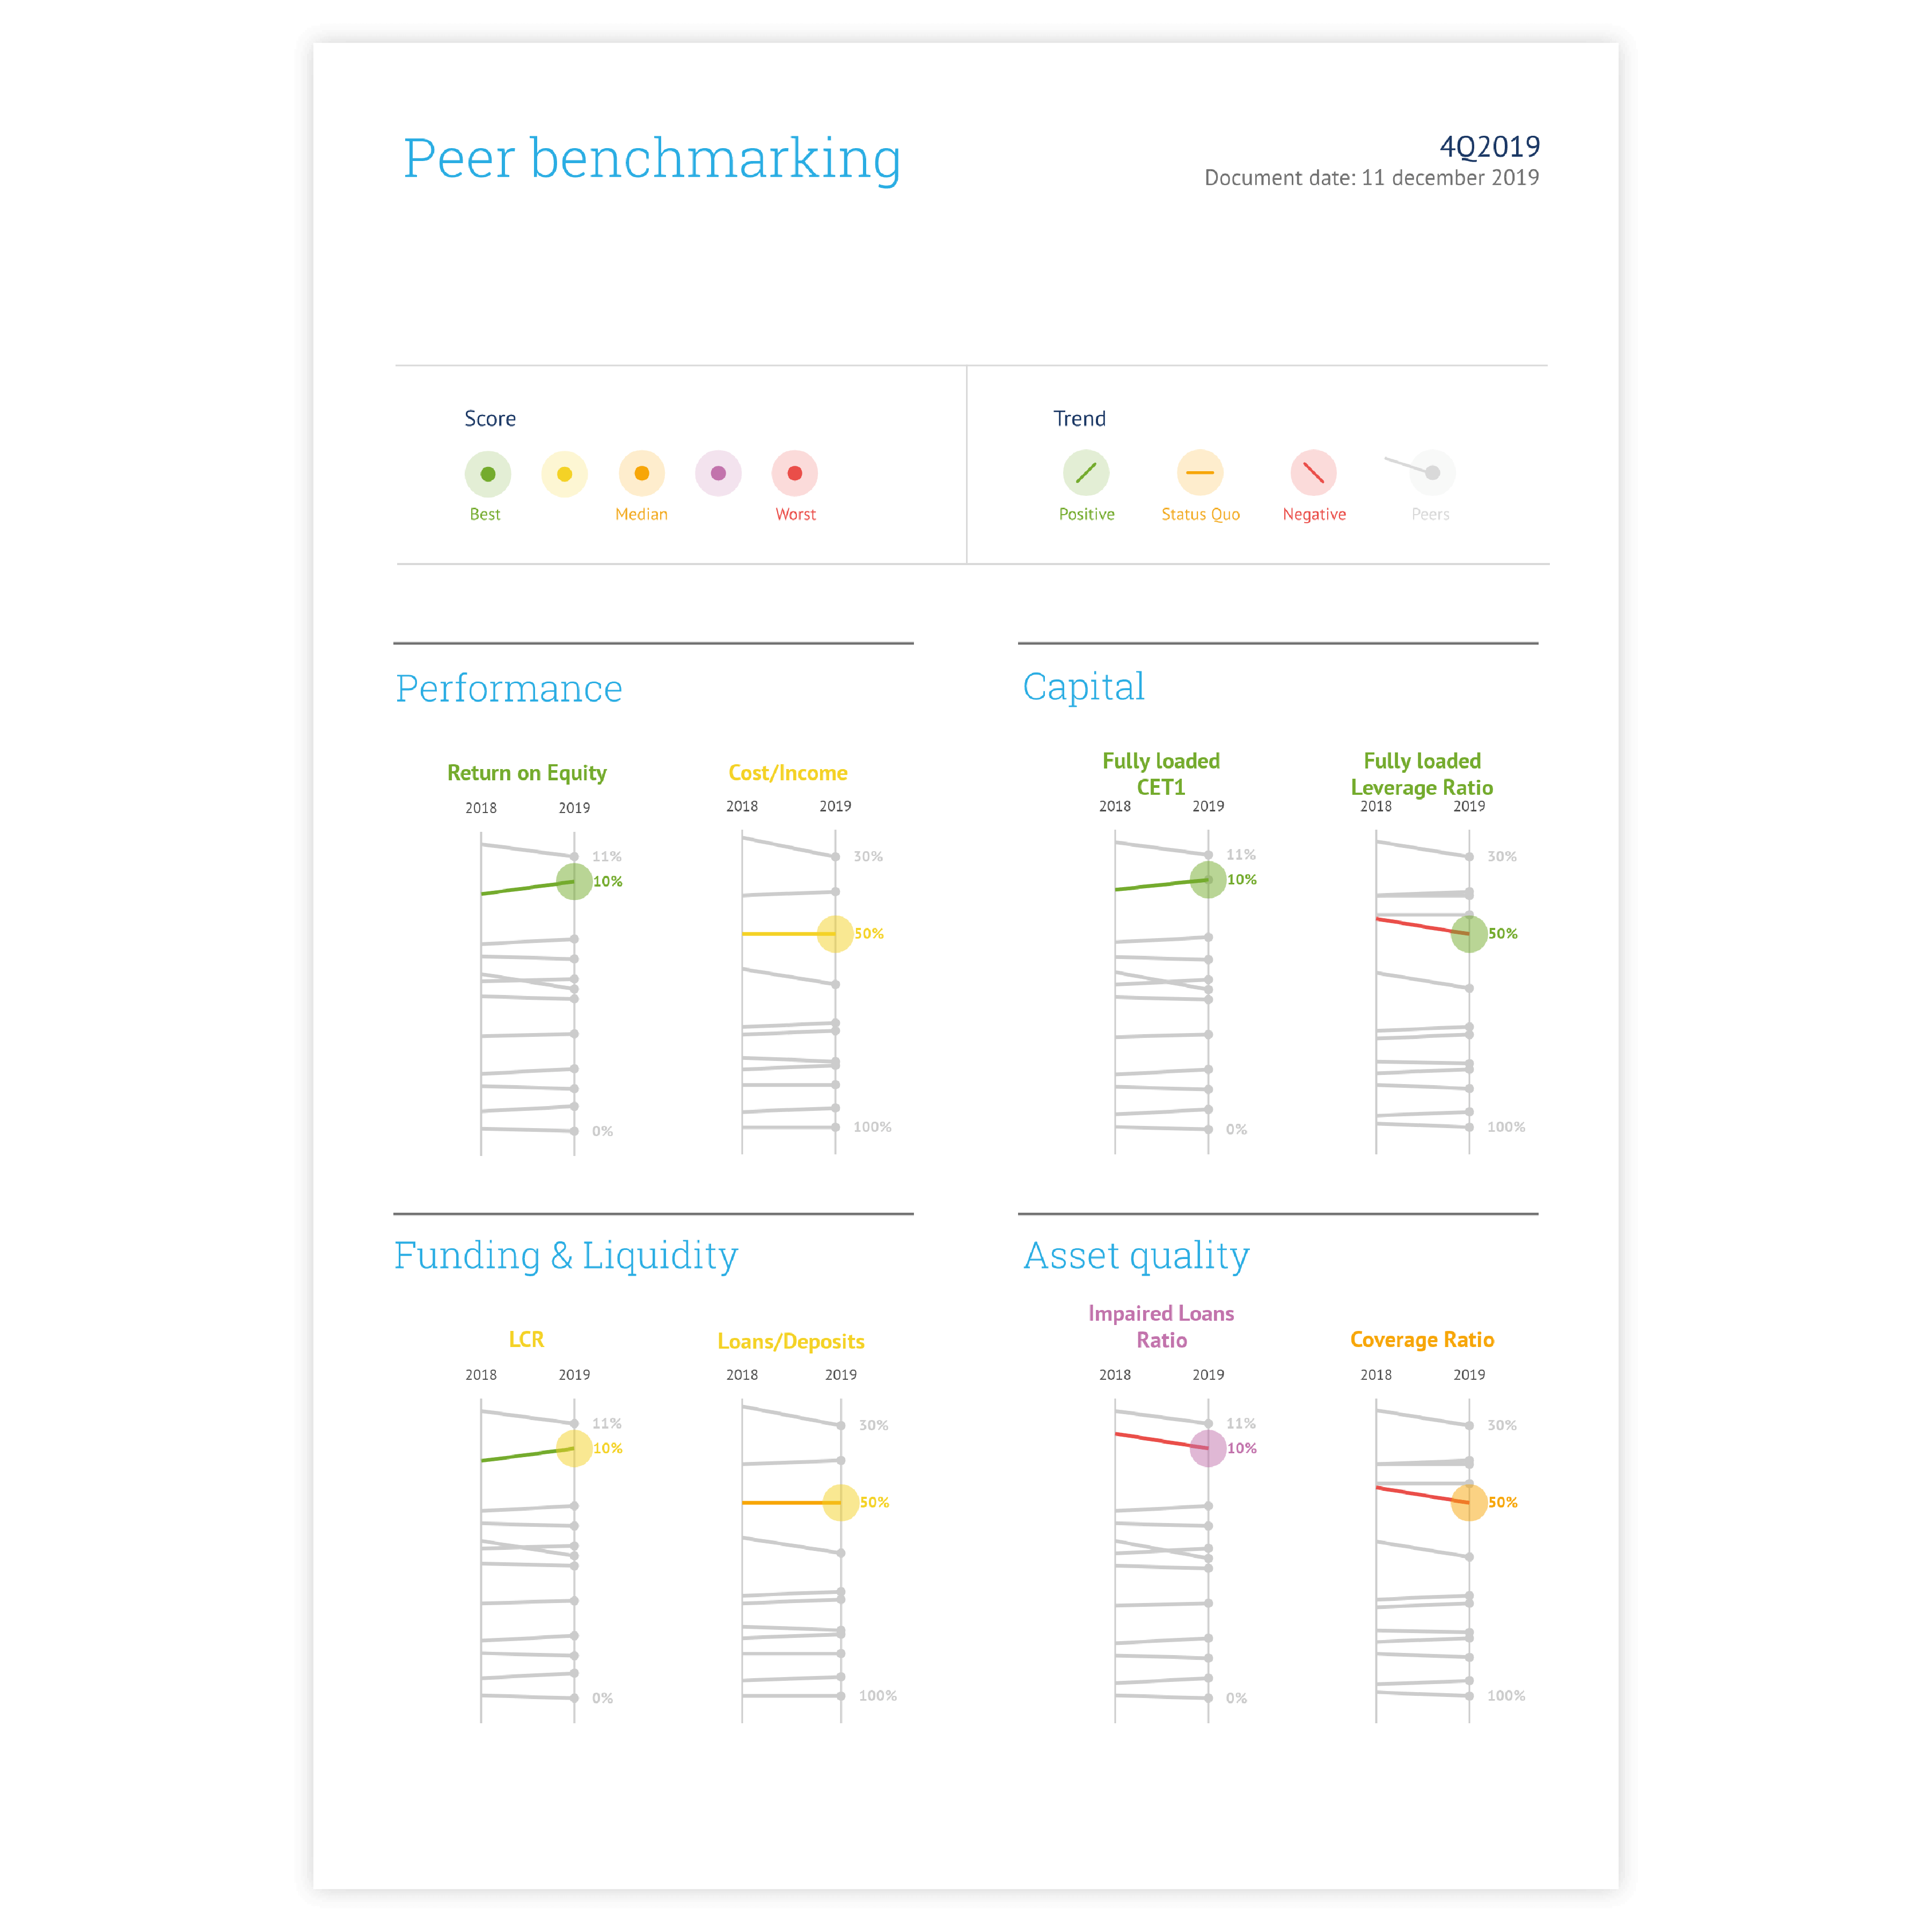
Using the right scale
For almost all charts it is absolutely recommended to start the x-axis at zero to avoid misleading the audience. However, for a slope chart, the most important goal is to show the changes in data and to emphasize what’s relevant in your data. Therefore, it is not always necessary to start the axis at zero as sometimes a trend will be more visible and easier to interpret when zooming in on the data.
Read more