


Report Design, Food For Thought, ESG Reporting
The Ultimate Guide to ESG Reporting
You may agree that environmental, social, and governance (ESG) reporting can feel complicated. You...
Report Design, Reporting
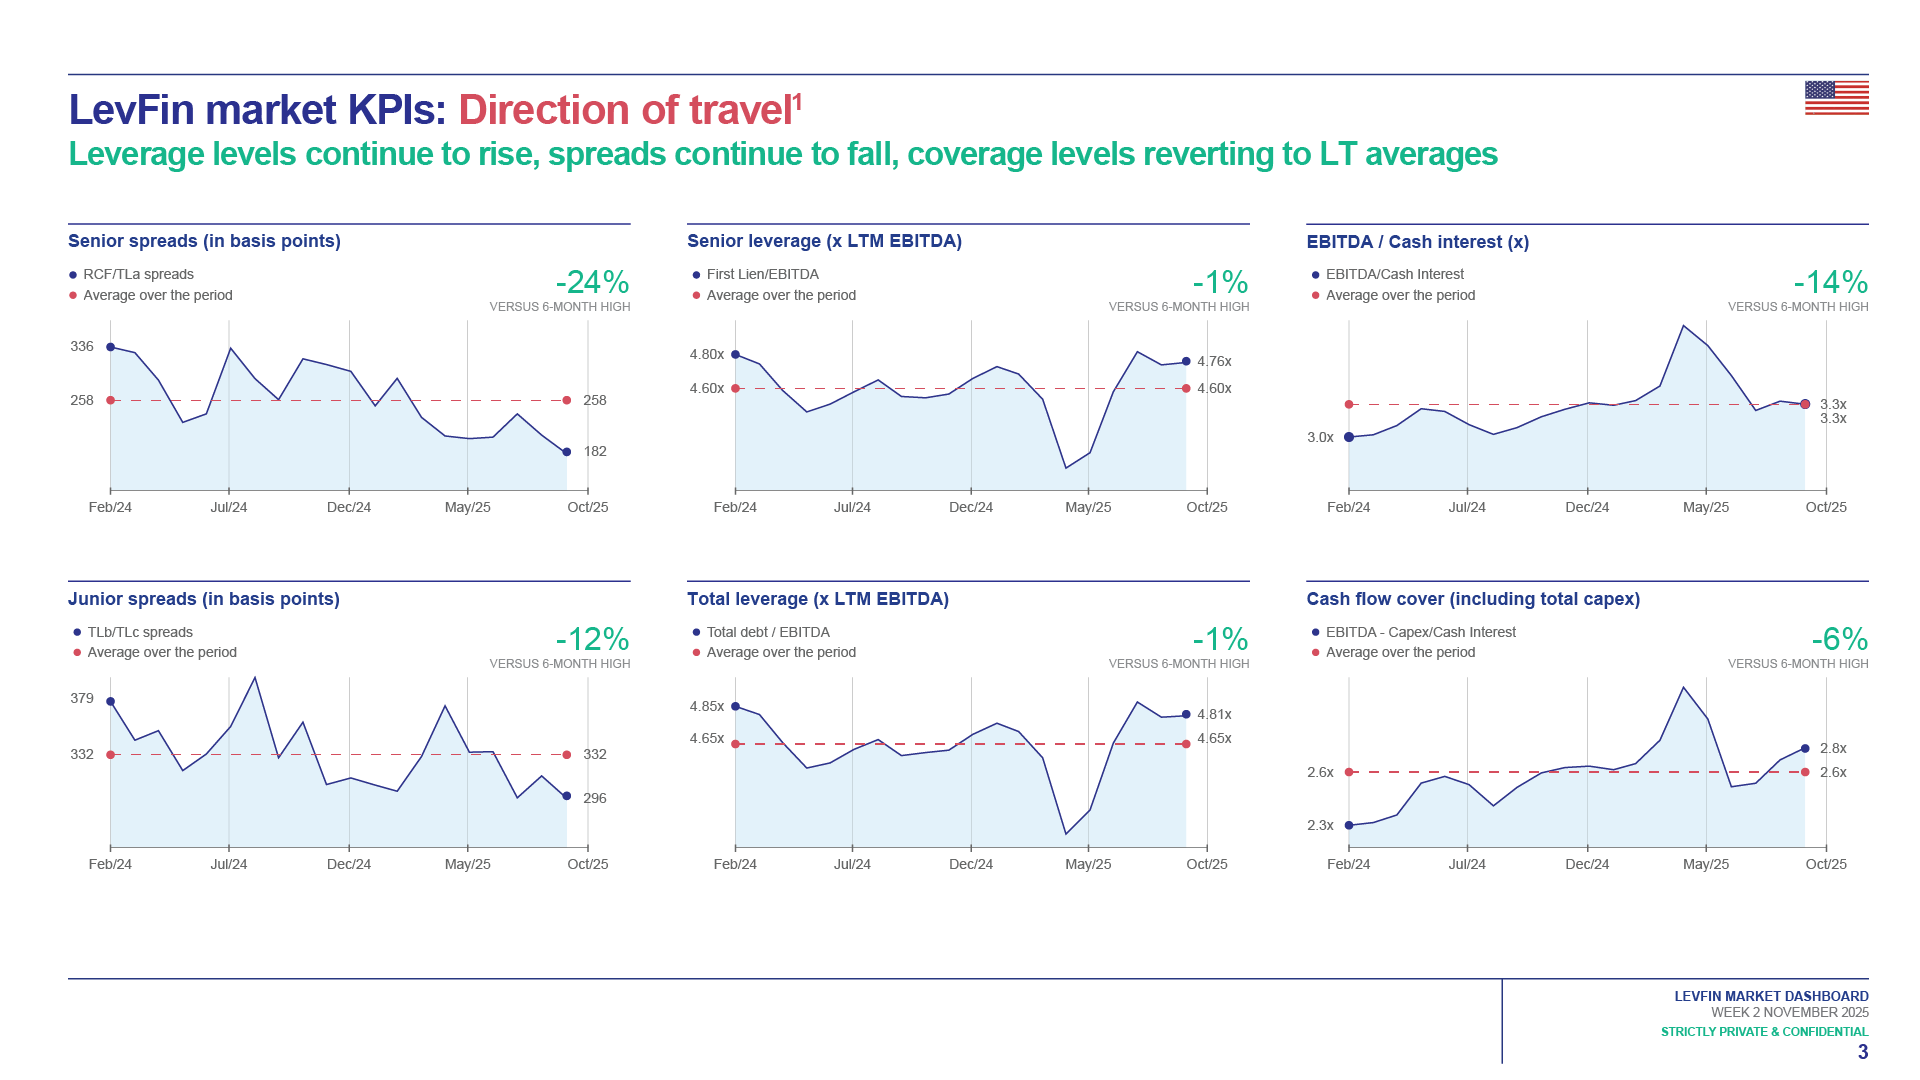
Top 7 charting add-ons for Excel
For professionals working with Excel, the need for advanced charting and visualization...
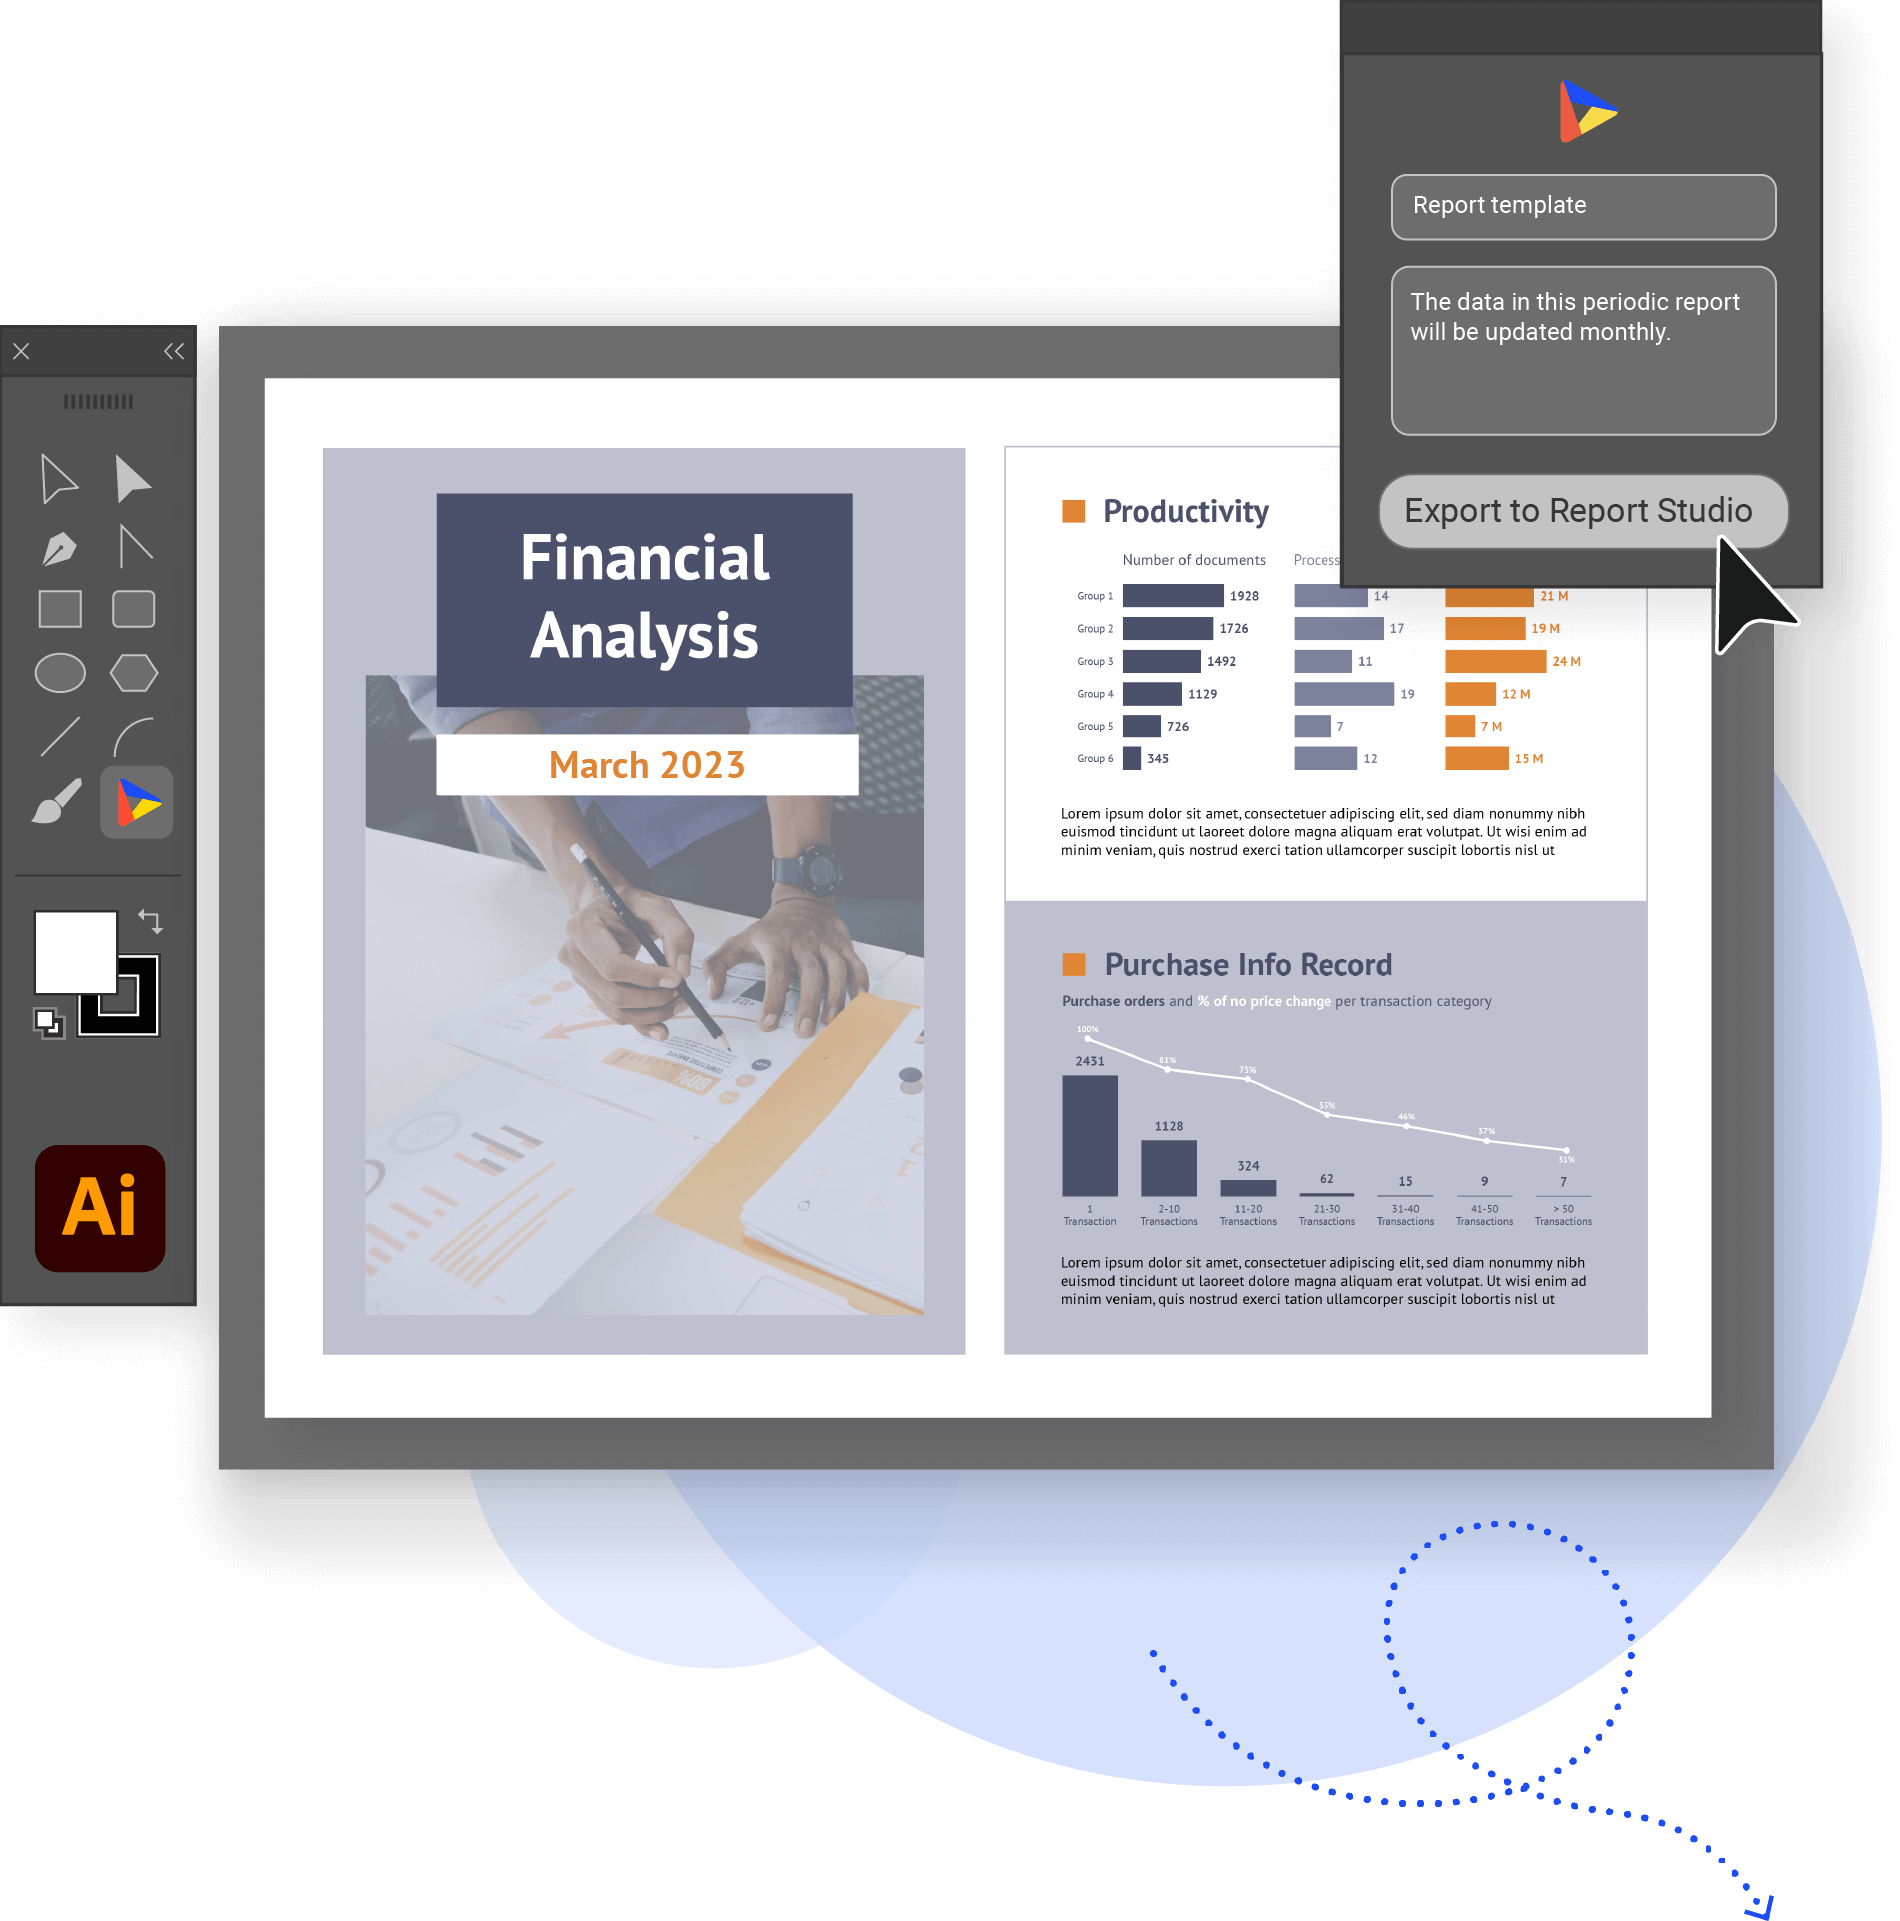
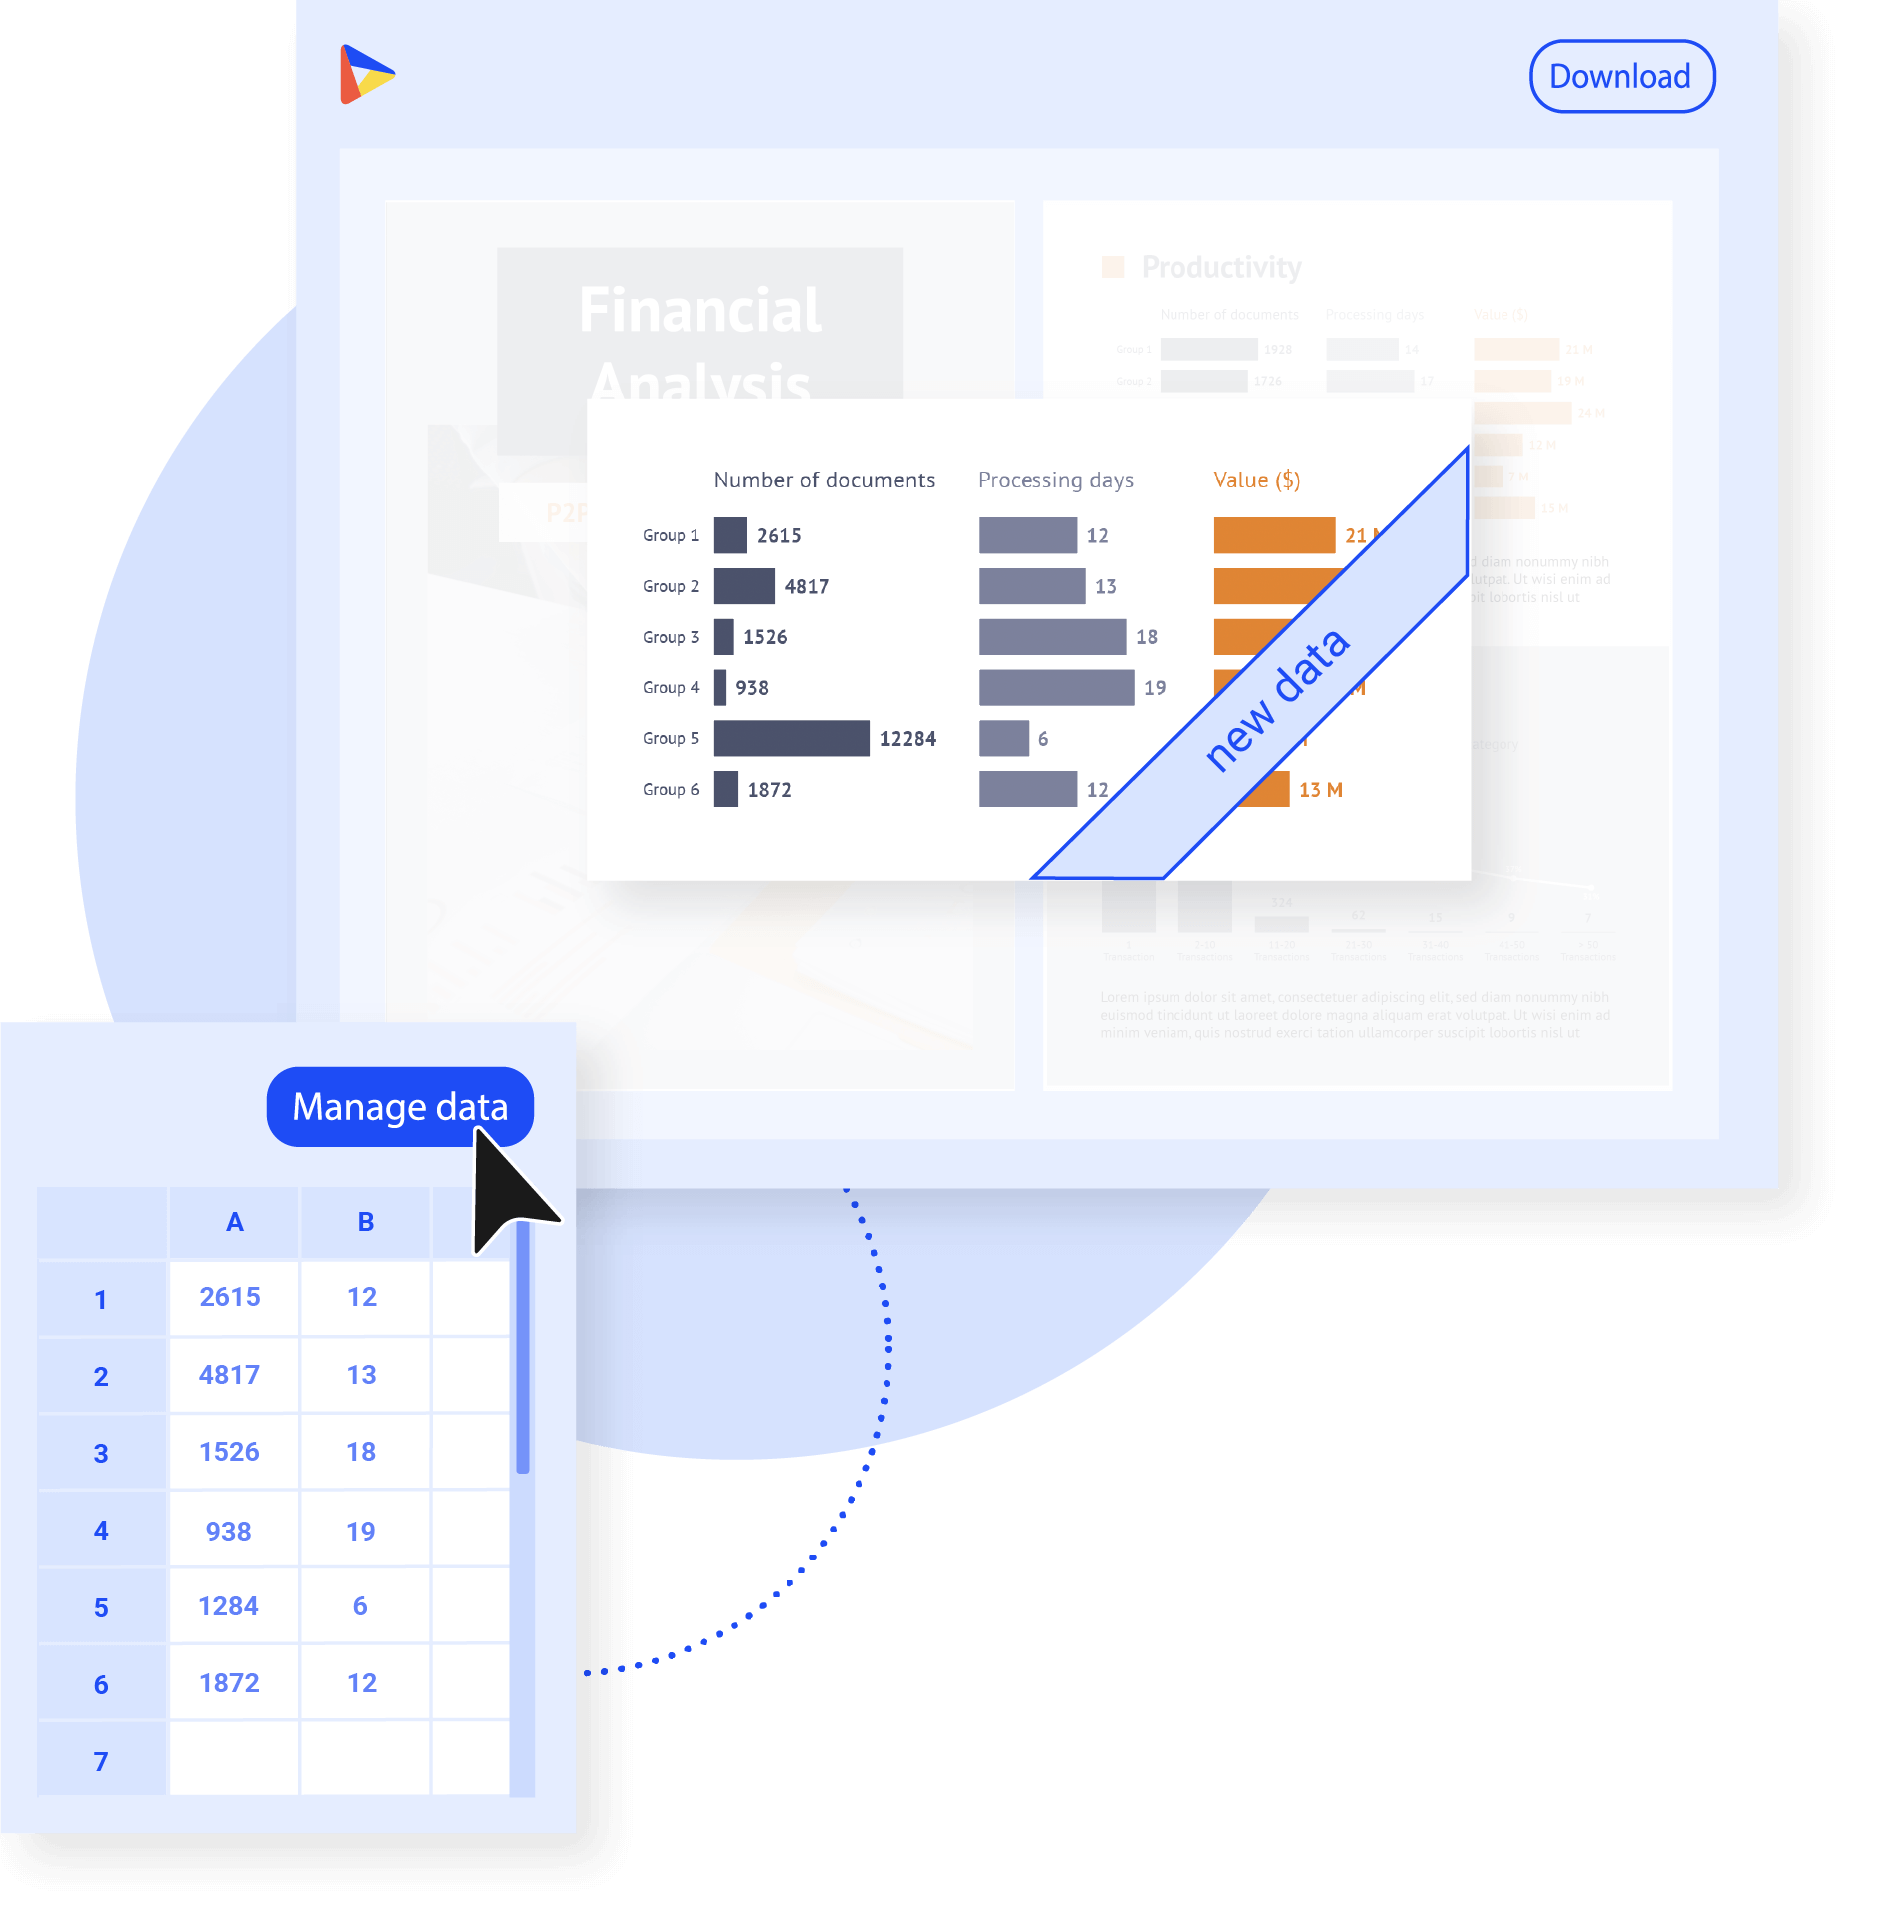
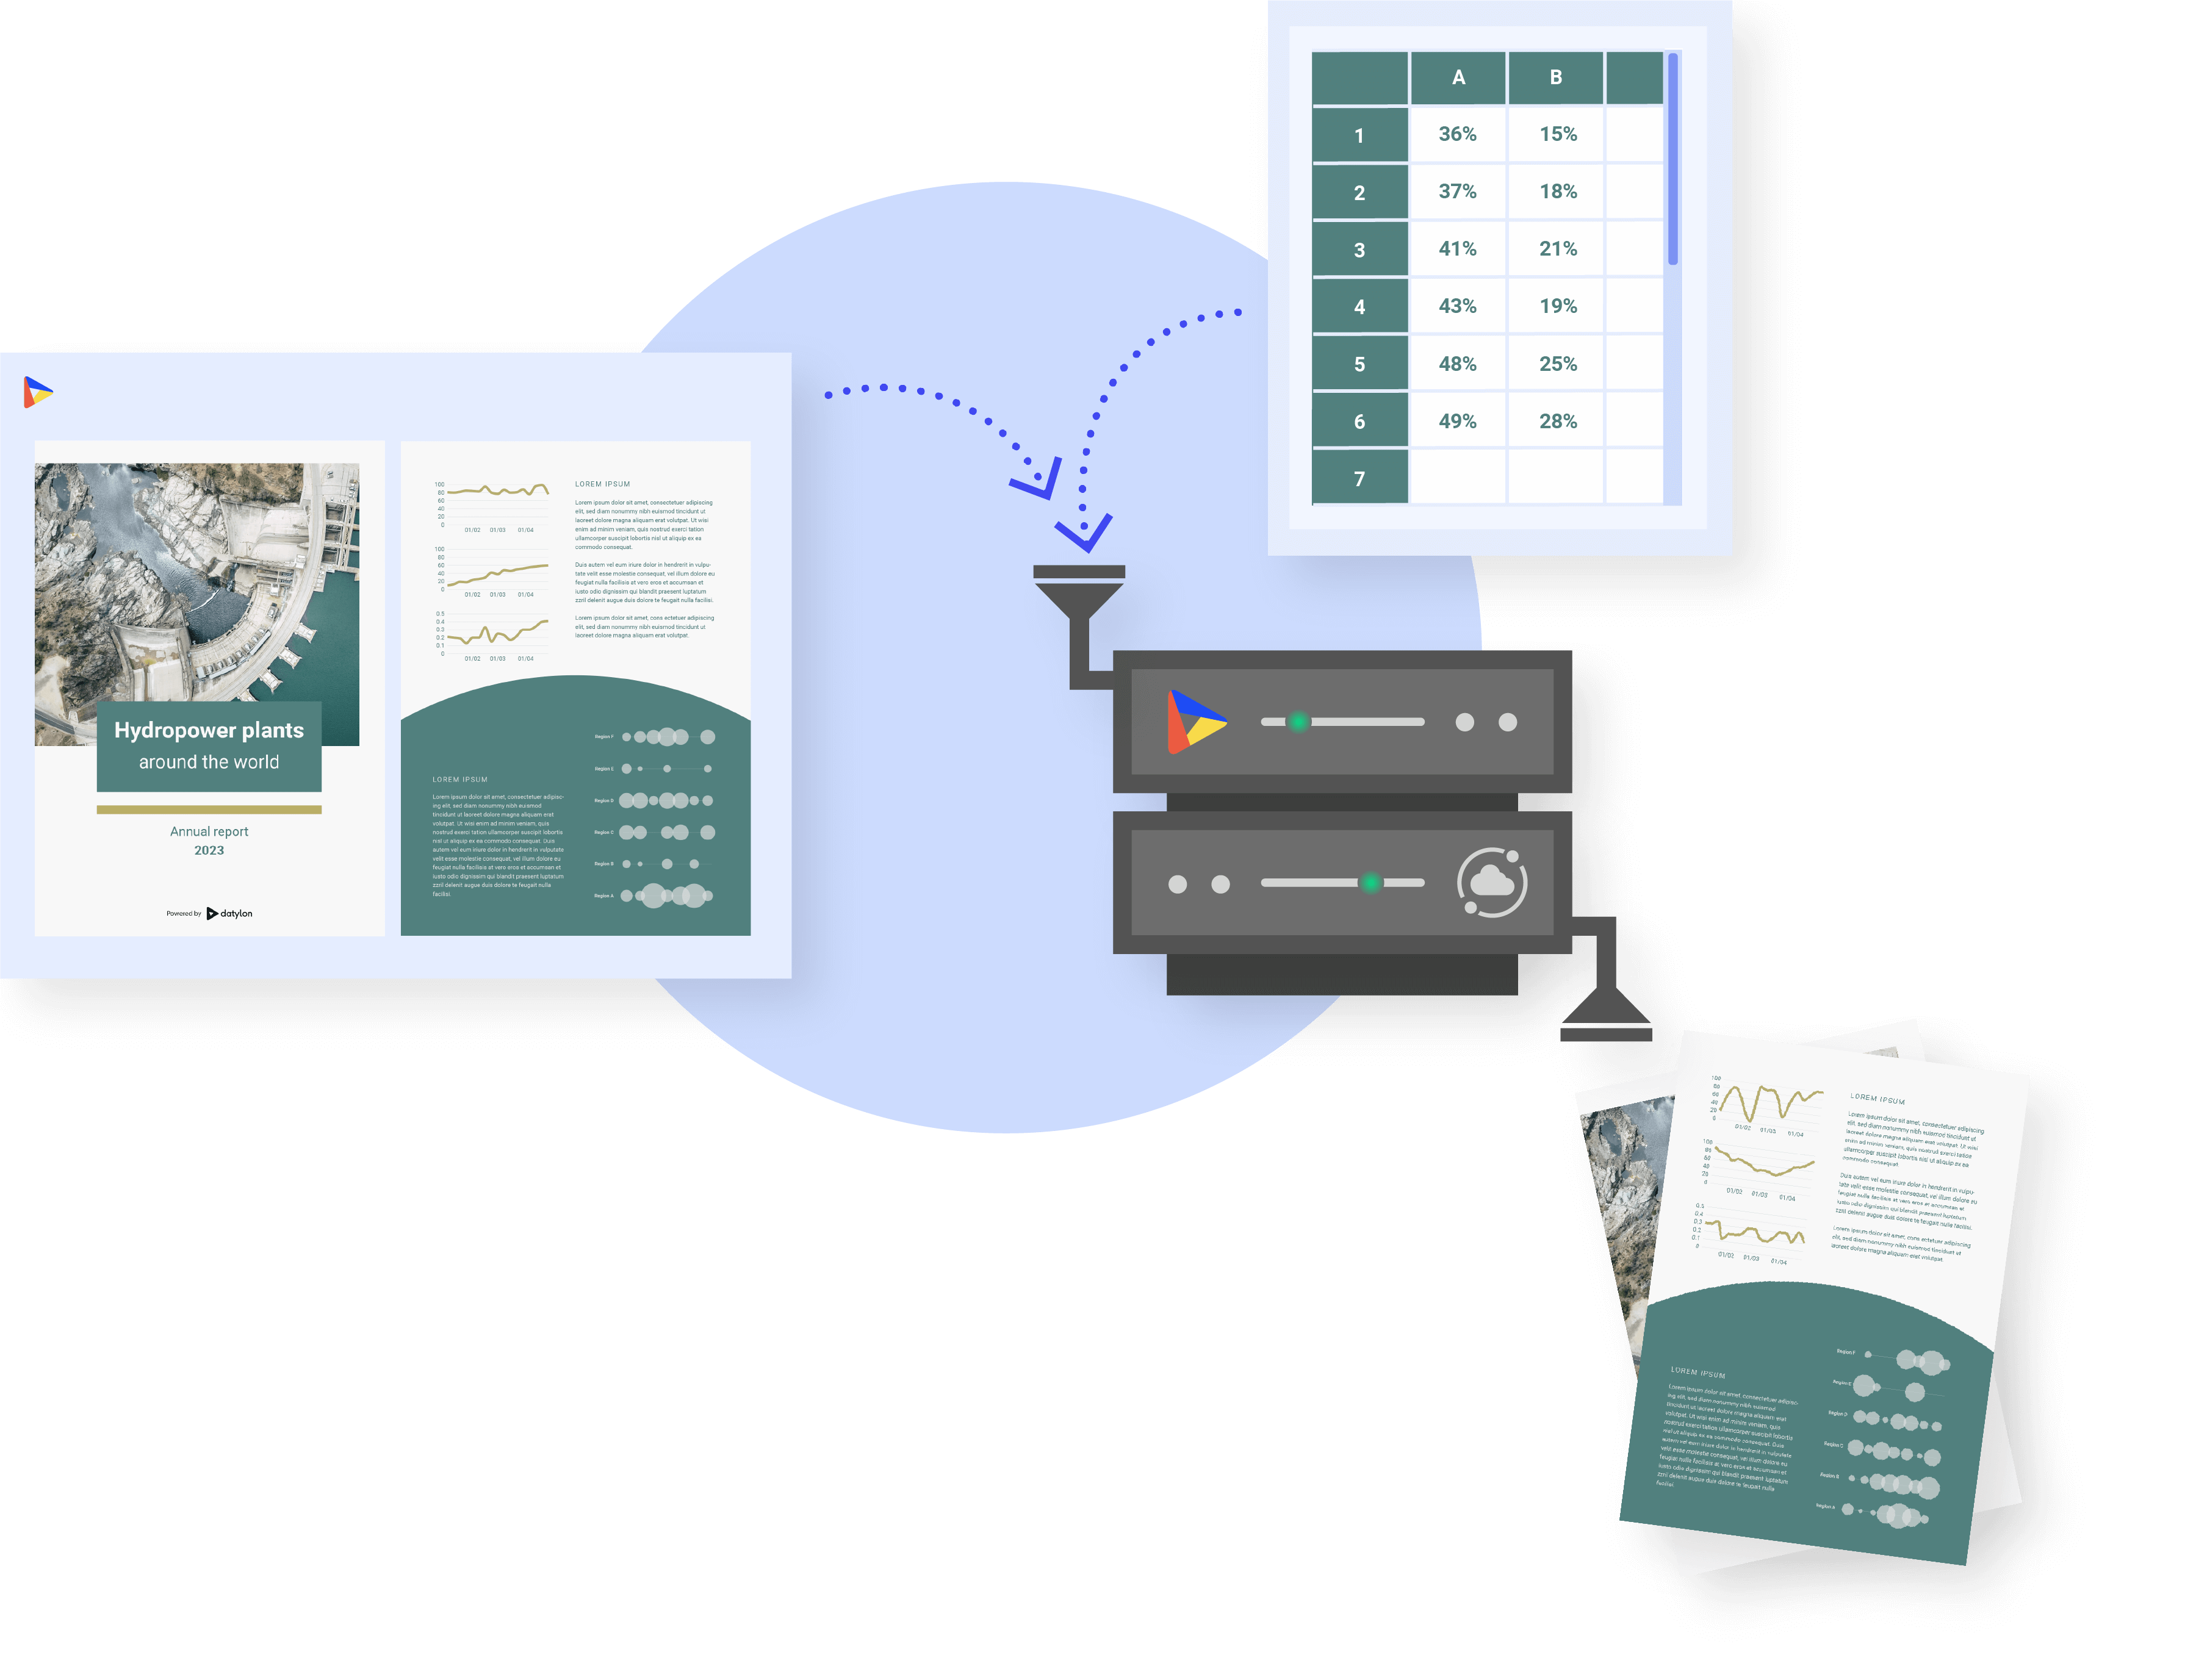
Report Design, Dataviz Resources, Report Server, Automated Reporting
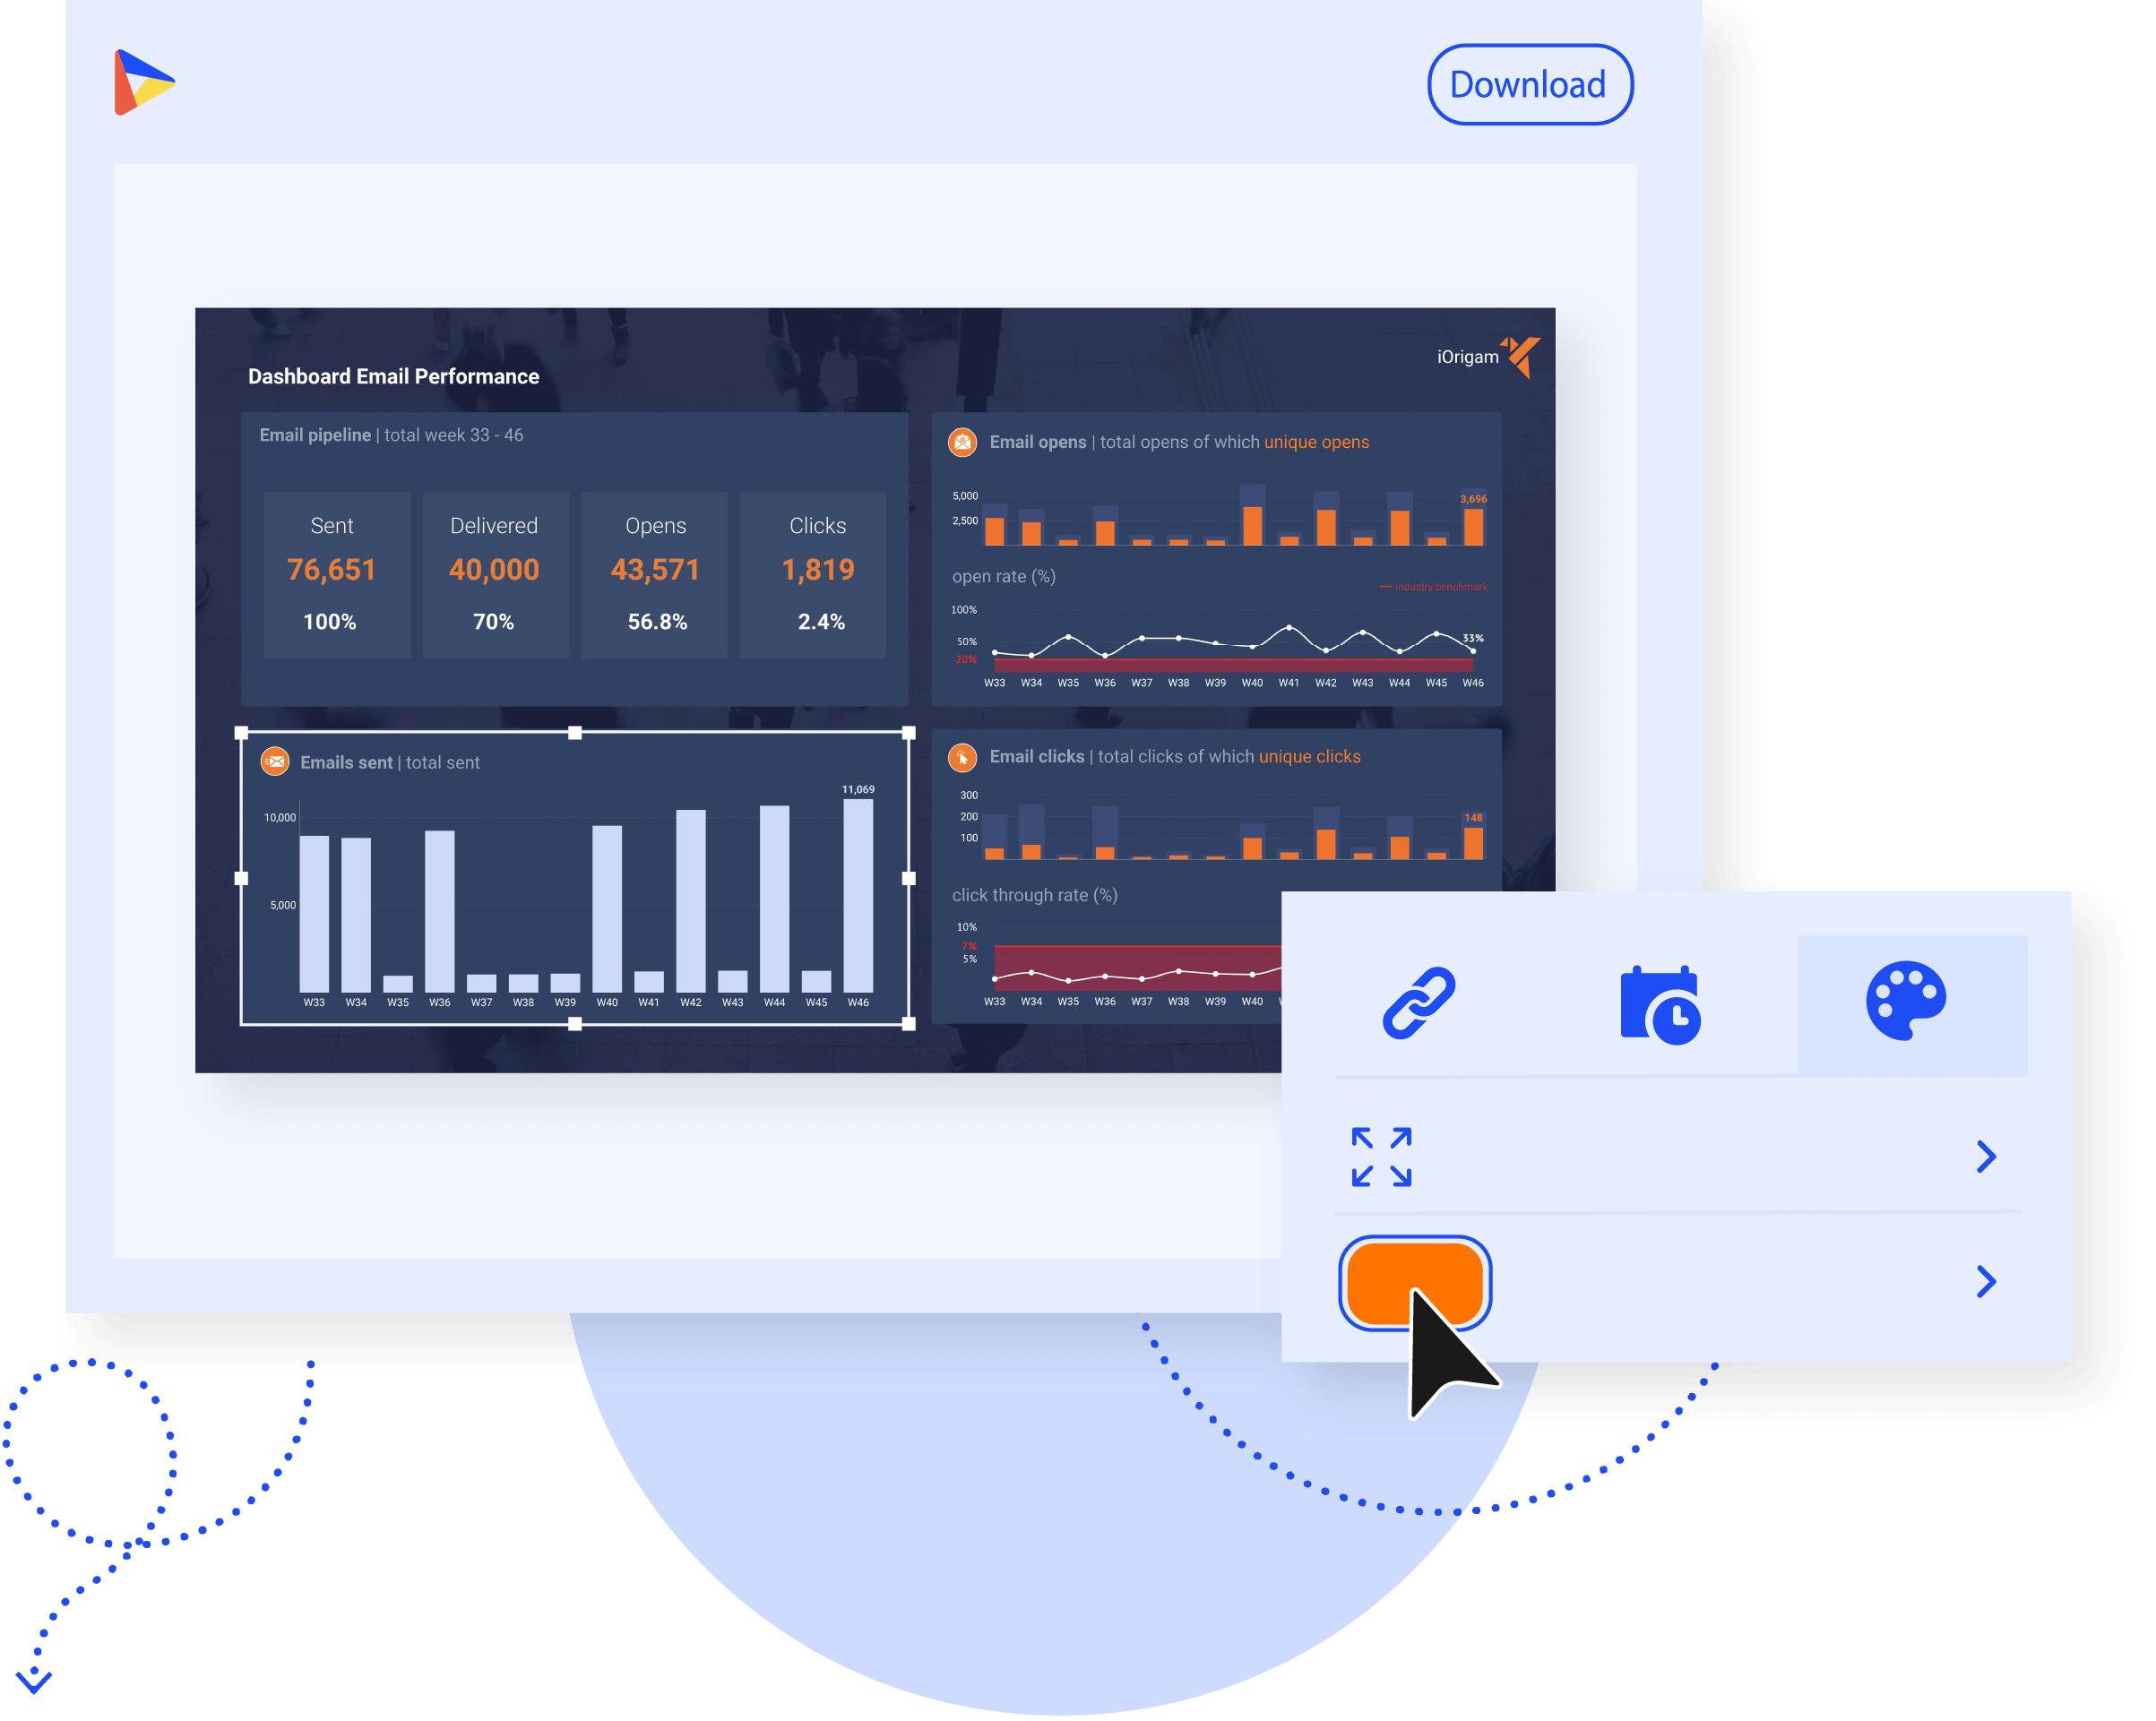
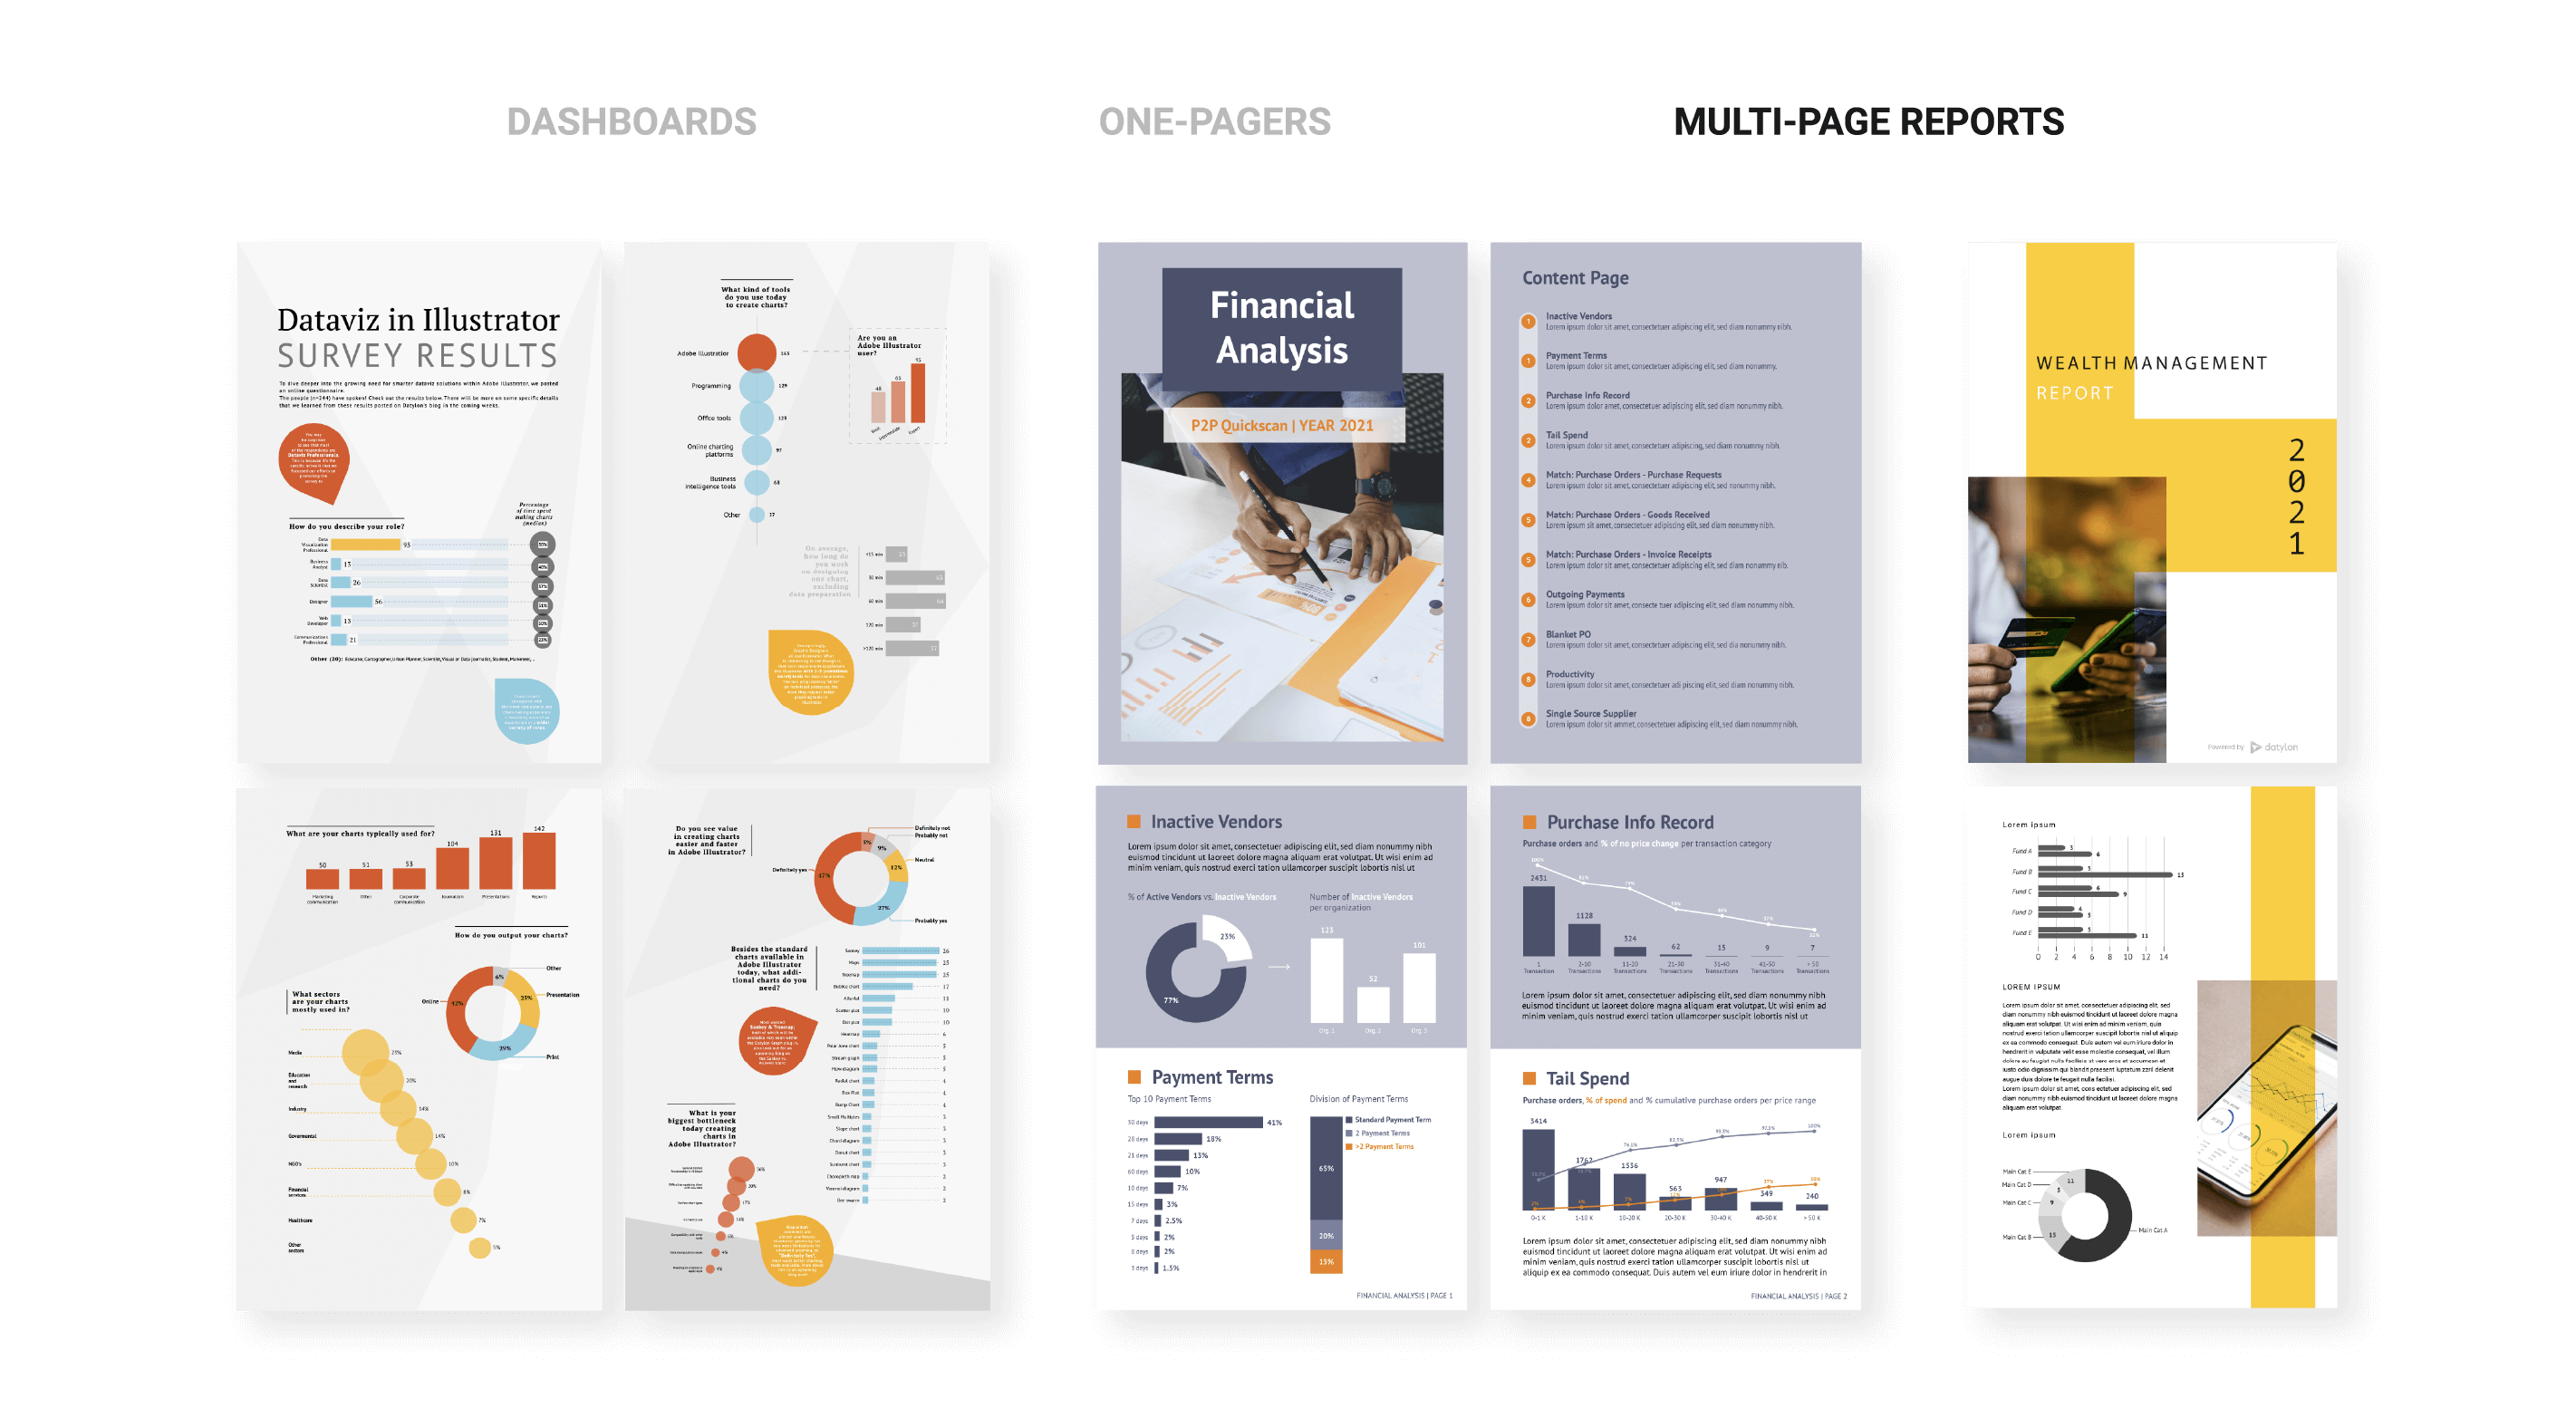
Support Your Executives: Optimize Reporting for Strategic Success
Executive reports are crucial for supporting decision-makers to quickly understand the most...