Reporting, Automated Reporting
Data Visualization Automation Tools for Non-Techies
In today’s data-driven world, the ability to turn raw data into visually engaging insights is...
Reporting, Automated Reporting
Top Excel Essential Automation Tools
Excel is a staple in the world of data analysis, offering an impressive array of features to...
Subscribe to our newsletter
Receive inspiration, practical advice, customer stories and news right in your mailbox

Report Design, Reporting
Top 7 charting add-ons for Excel
For professionals working with Excel, the need for advanced charting and visualization...
DataViz Best Practices, Report Design, Food For Thought, Reporting
Datylon vs Power BI for automated reporting
In the dynamic landscape of business intelligence, Datylon and Power BI stand out as premier tools...
Product, Report Server, Reporting, Automated Reporting
Climbing the Ladder of Automated Reporting Solutions with Datylon
The arrival of report season can feel like encountering kryptonite for many office workers. Hours...
Financial Services, Report Server, Reporting, Automated Reporting
Top financial data visualization tools to create automated multi-page reports
In the finance industry, report generation is a crucial aspect of operations. Manually creating...
Dataviz Resources, Report Server, Reporting, Automated Reporting
Automated Data Visualization Trends: What to Look for in Report Server Tools
In today's data-driven world, manually creating reports and charts is a time-consuming and...
Dataviz Resources, Report Server, Reporting, Automated Reporting
The Great Report Debate: Manual, Automated, or Interactive?
Let's face it, crunching numbers in spreadsheets isn't exactly thrilling. But when it comes to...
Report Server, Reporting, Automated Reporting
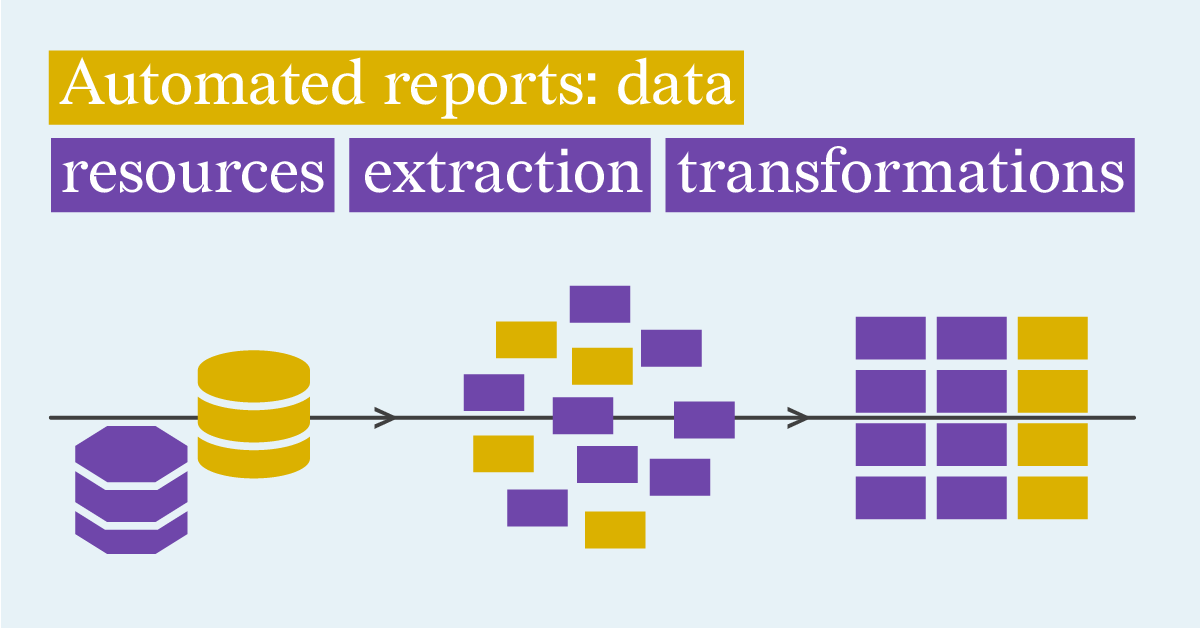
Automated reports: Defining Data Resources, Data Extraction and Transformation Options
In today’s fast-paced business environment, making timely and informed decisions requires more...
Report Server, Reporting, Automated Reporting
Boosting Efficiency: How Automated Reporting Transforms Associations
The business world remains data-driven, making effective automated reporting for associations...