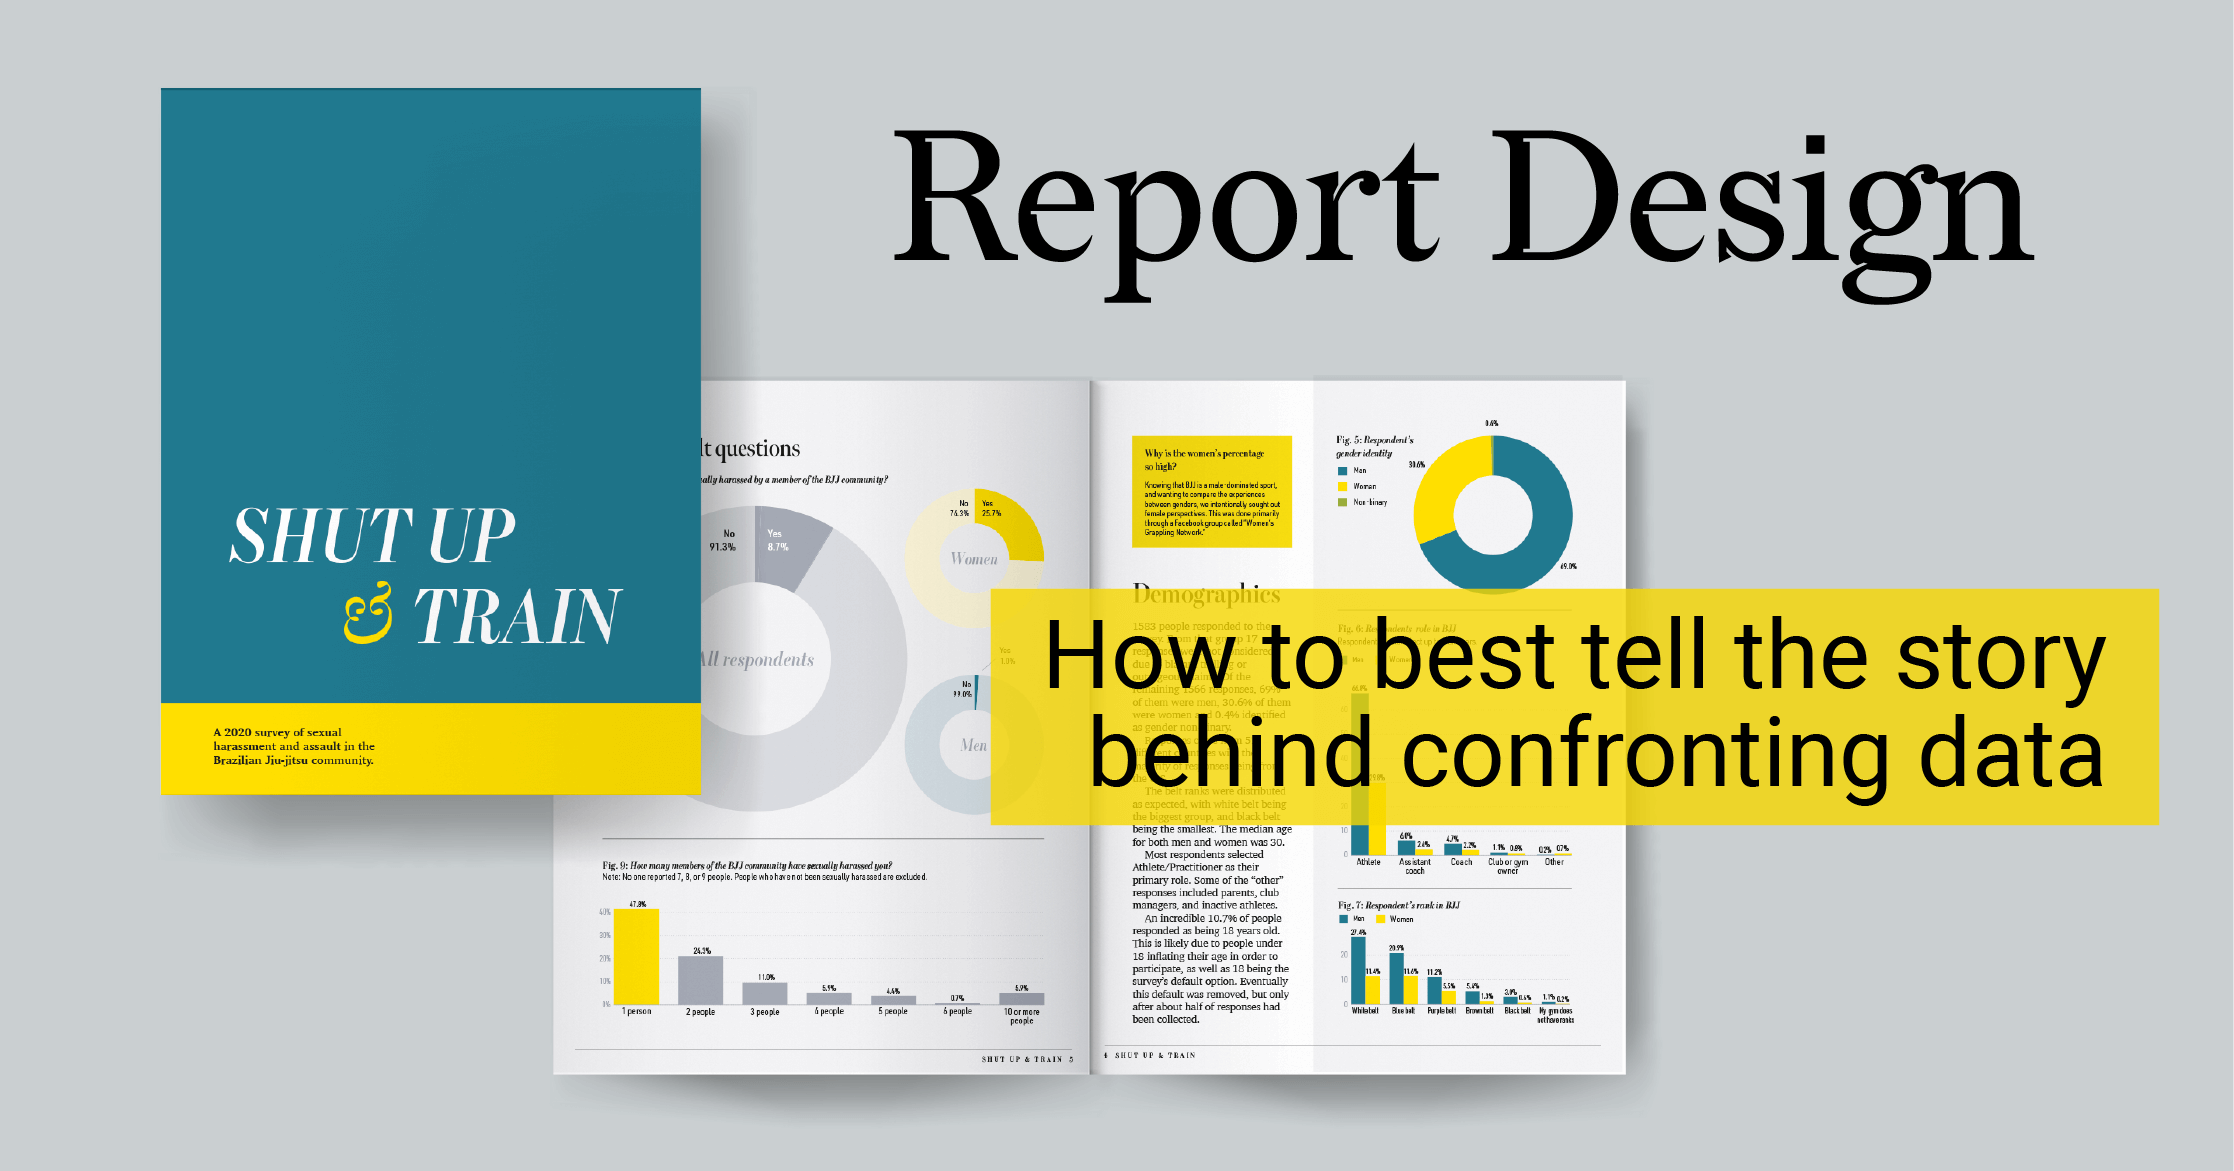
Report Design,Report Server,Reporting,Automated Reporting
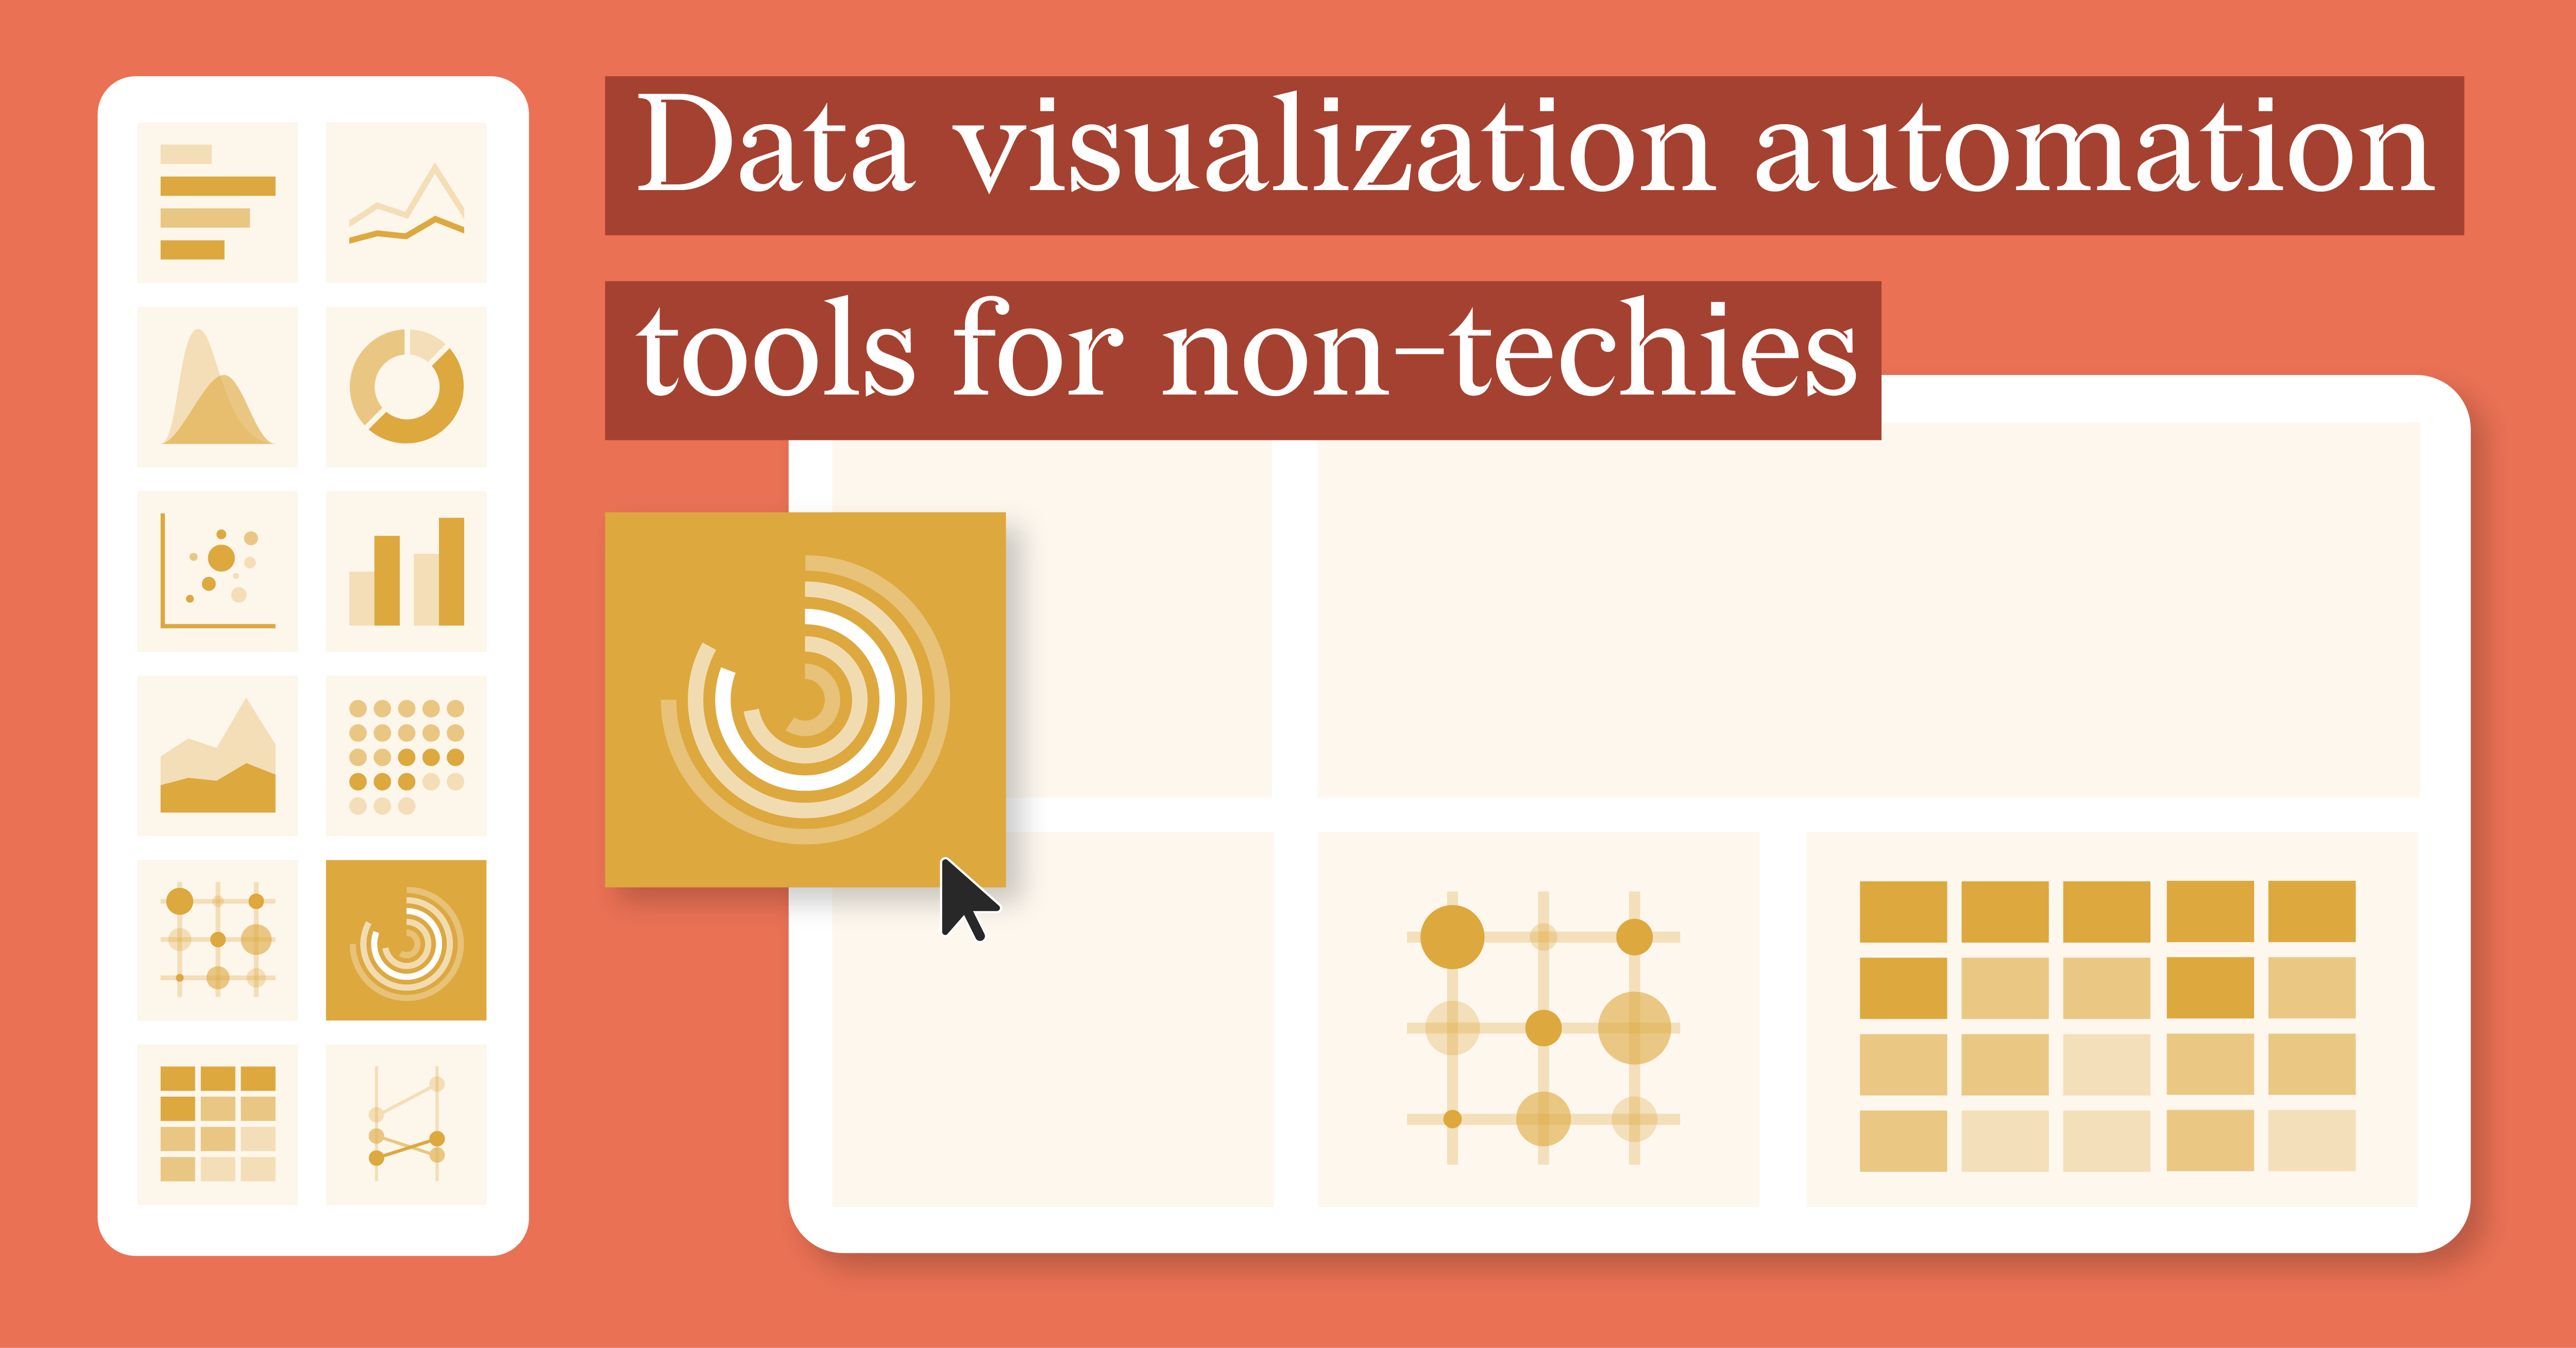
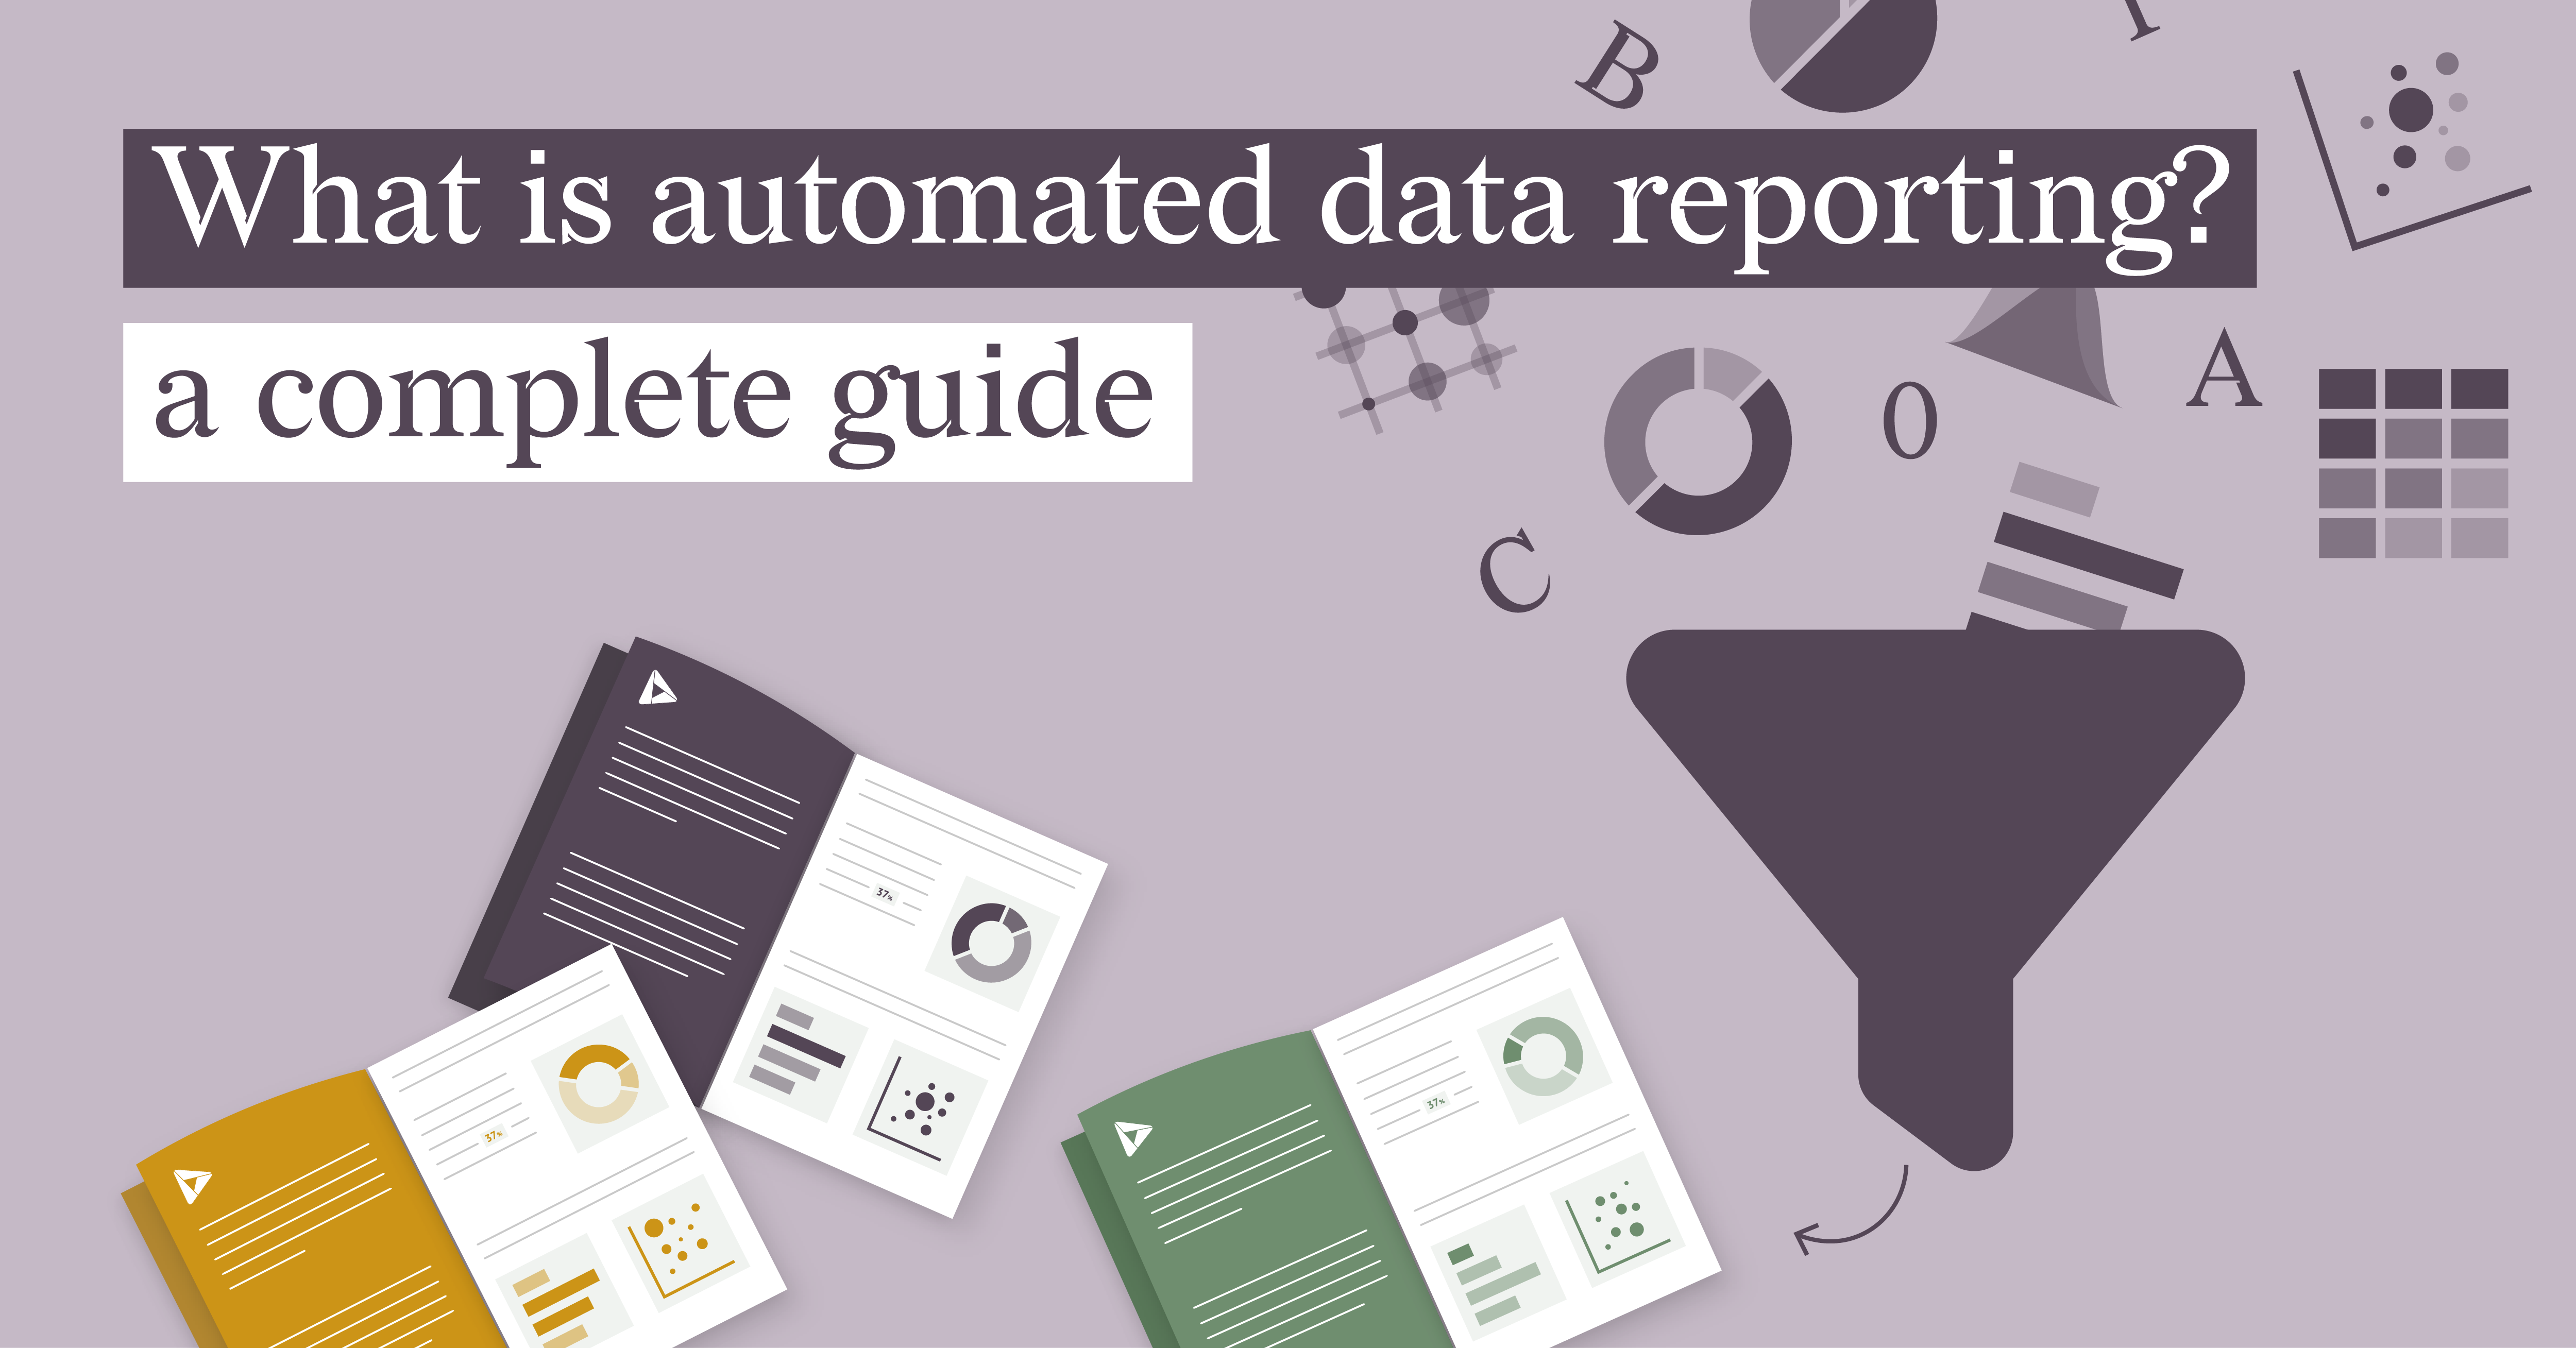
What is automated data reporting? A complete guide
Reporting doesn’t have to be a headache. Still, for many teams, it often is. Data gets pulled from different sources, ...
Read more

/datylon-blog-Clear-Compelling-Compliant-%20How-to-Present-Long-Term-Sustainability-Goals-in-CSRD-Reporting-featured-image-2.png)