
First of all, we wish you a healthy and inspiring 2021! Let's hope that we can soon go back to our 'normal' life again.
Our latest Datylon release (R43) is not a major upgrade, nevertheless, we are happy to share with you the progress we made since our last release.
Good to know is that several new features were developed on the personal request of some of our users. It surely pays off to keep sending us your feedback and wish list! Maybe next time your feature will be on display here.
Download Datylon for Illustrator now or sign in to the Datylon web app and enjoy the new version!
ADVANCED STYLING
Labels options
Datylon gives you now more label options to show, or hide, exactly what you want and how you want it. Discover more styling options.
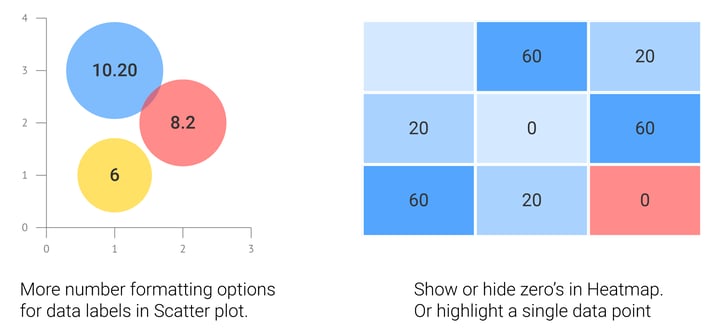
CHART LIBRARY
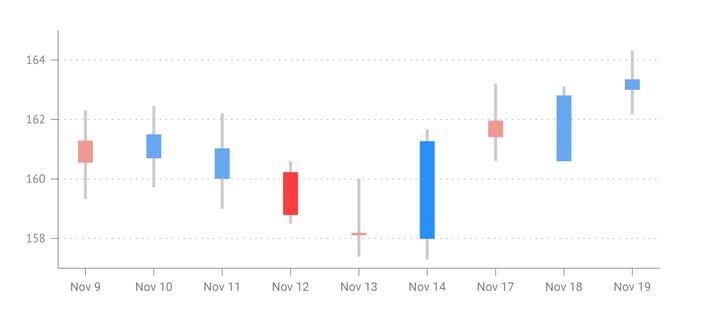
Candlestick chart
We keep on expanding our chart library to get you started quickly and to offer more versatility. Our newest addition is a vertical arrow chart which can serve many purposes. Starting from two vertical arrow charts and one datasheet you can also easily build a candlestick chart, which is often used in stock exchange reports. On top of that, each data point can be separately styled to highlight the… well... highlights. This is another great example of the combined strength of Adobe Illustrator & Datylon! Learn how to create a candlestick chart in Illustrator or online.
We hope you will try out these new features. Stay tuned for our next release as we are busy working on some bigger feature updates, also requested by users, with a great impact on productivity.
As always, do not forget that we are there to support you! Learn more about how you can supercharge your chart design, online and in Illustrator with a free expert demo session.
Your #chartsmatter and enjoy designing! 😉