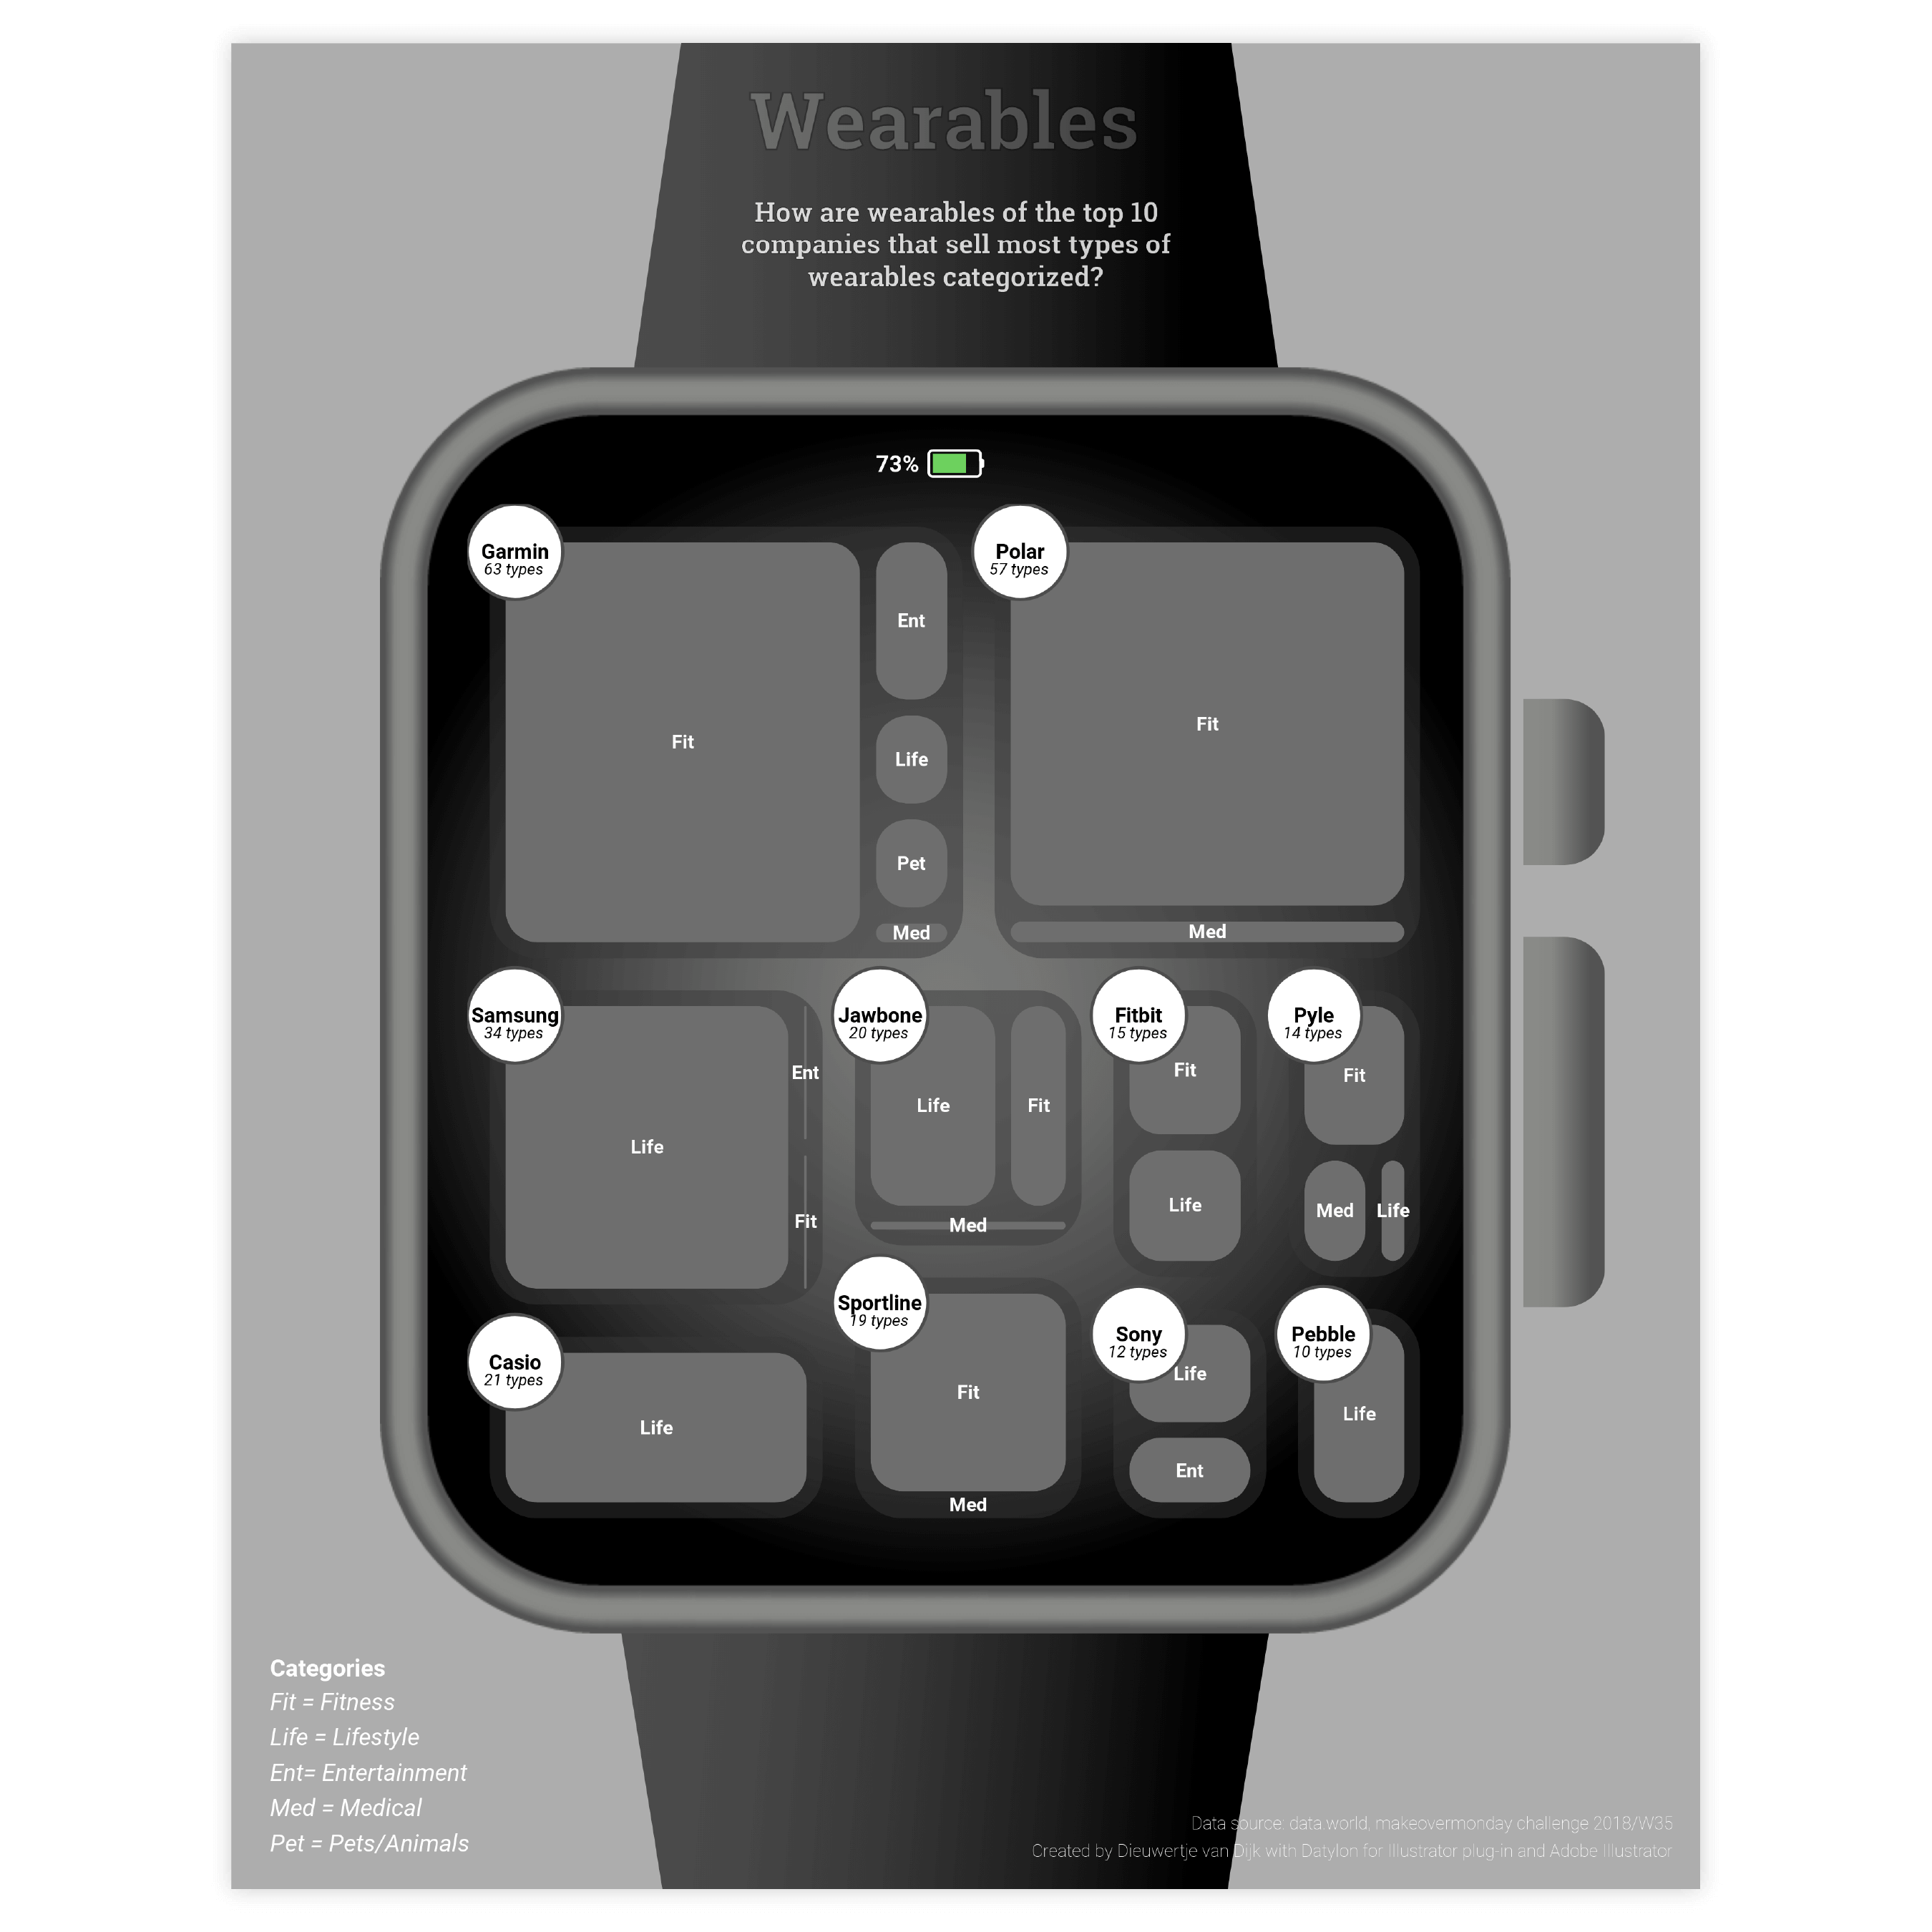
Datylon | Treemap Chart | Treemap Graph | Tree map | Datylon Chart Library

Treemap

What is a treemap?


A treemap visualizes a part-to-whole relationship. Treemap charts come in handy when you are dealing with large numbers of categories with a hierarchical structure. A treemap consists of multiple categories and each category in the treemap is given a rectangle. The categories could be subdivided into smaller rectangles if you are dealing with subcategories in the data. The size of the area of the rectangles communicates the value. Therefore, treemaps are very useful charts for finding relationships fastly, both within and between categories. 

Another benefit of a treemap is the efficient use of space which makes it easy to show a lot of data at the same time. Though, too many rectangles in a treemap can make it difficult to read and can overload the viewer.

That is why you can not use more than three dimensions in our plug-in and we recommend you be careful with the number of categories used within each dimension.

The treemap is a very helpful chart in showing overall relationships in large datasets but if the data requires more precise comparison, other charts might be a better choice. The human brain is programmed to process the length of an element subconsciously and fast, and the size of an area consciously and slowly. This is why, for precise comparisons, a bar chart might be a better option.

Variations of treemaps

The charts below are variations of a simple part-to-whole treemap chart with one dimension. To learn how to make them with Datylon, check out the treemap user documentation in the Datylon Help Center.
Treemap chart variation - nested treemap

Nested treemap

This chart is similar to the simple part-to-whole treemap, but in the nested treemap multiple dimensions are shown. The extra dimension(s) lead to nesting within the first dimension.

Treemap chart variation - sliced and diced treemap

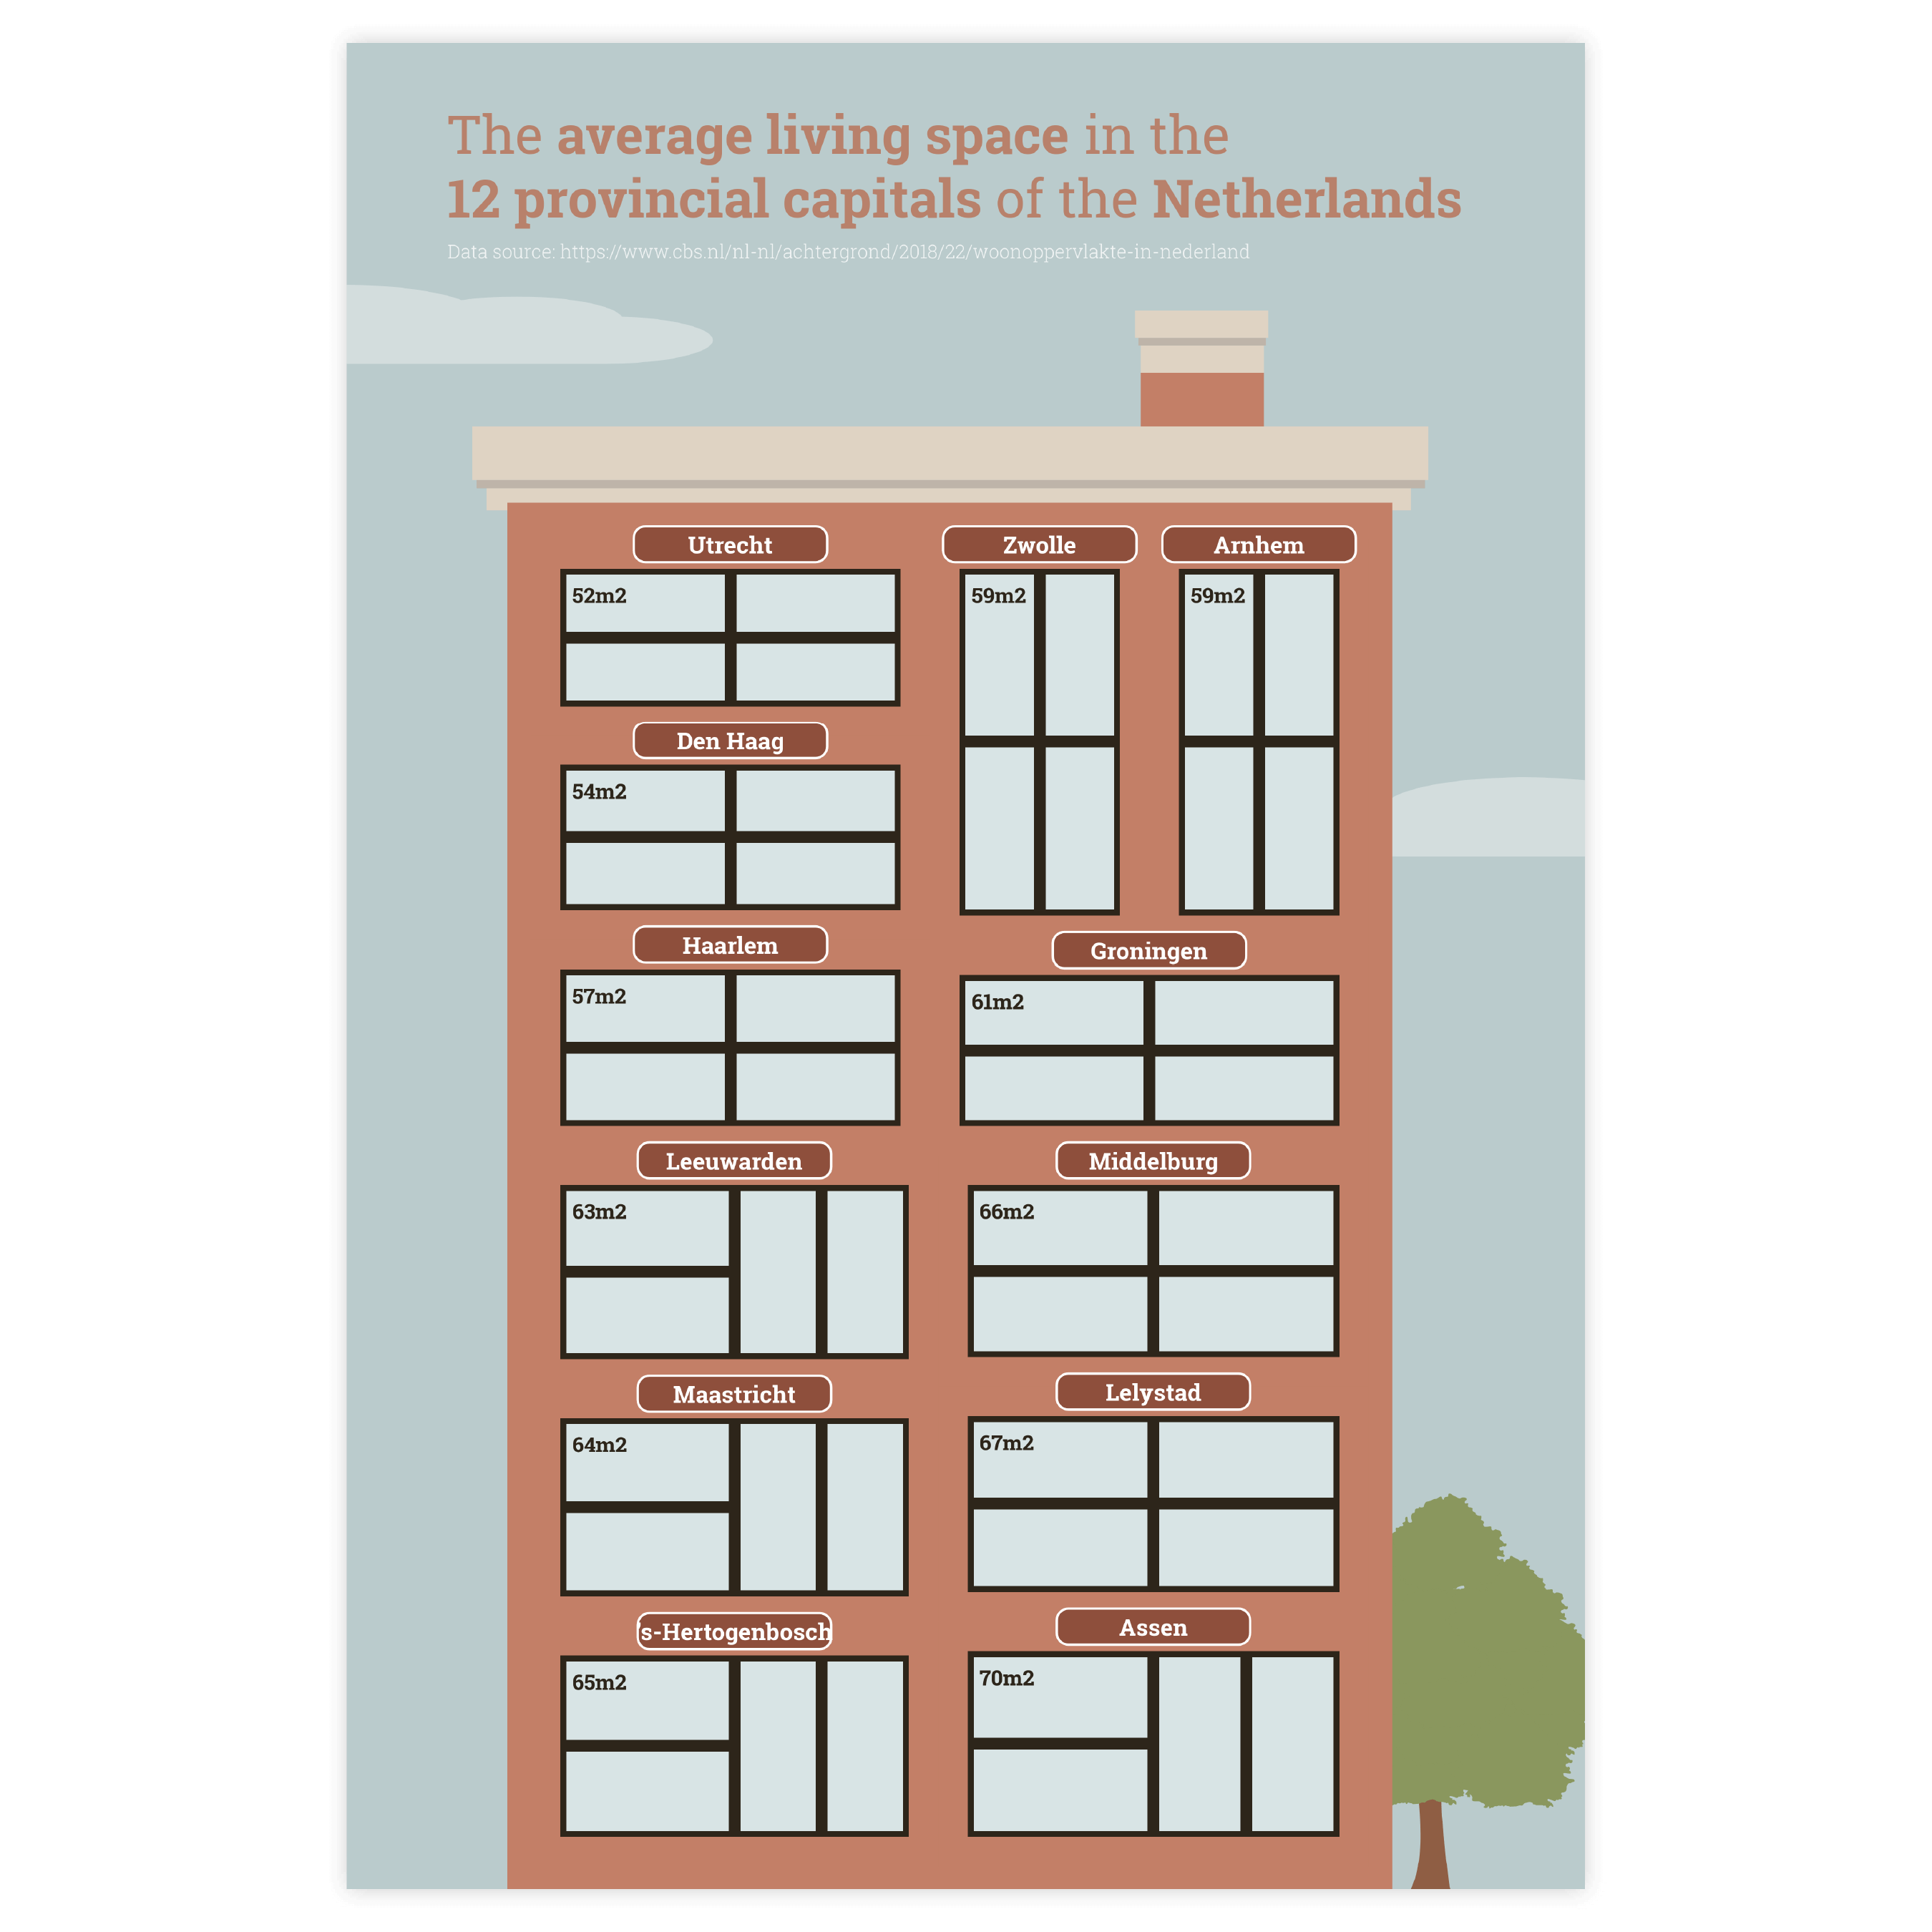
Sliced and/or diced treemap

This type of treemap uses parallel lines in vertical or horizontal orientation to divide rectangles. A hybrid approach combines sliced and diced treemaps, switching lines at each hierarchy level.
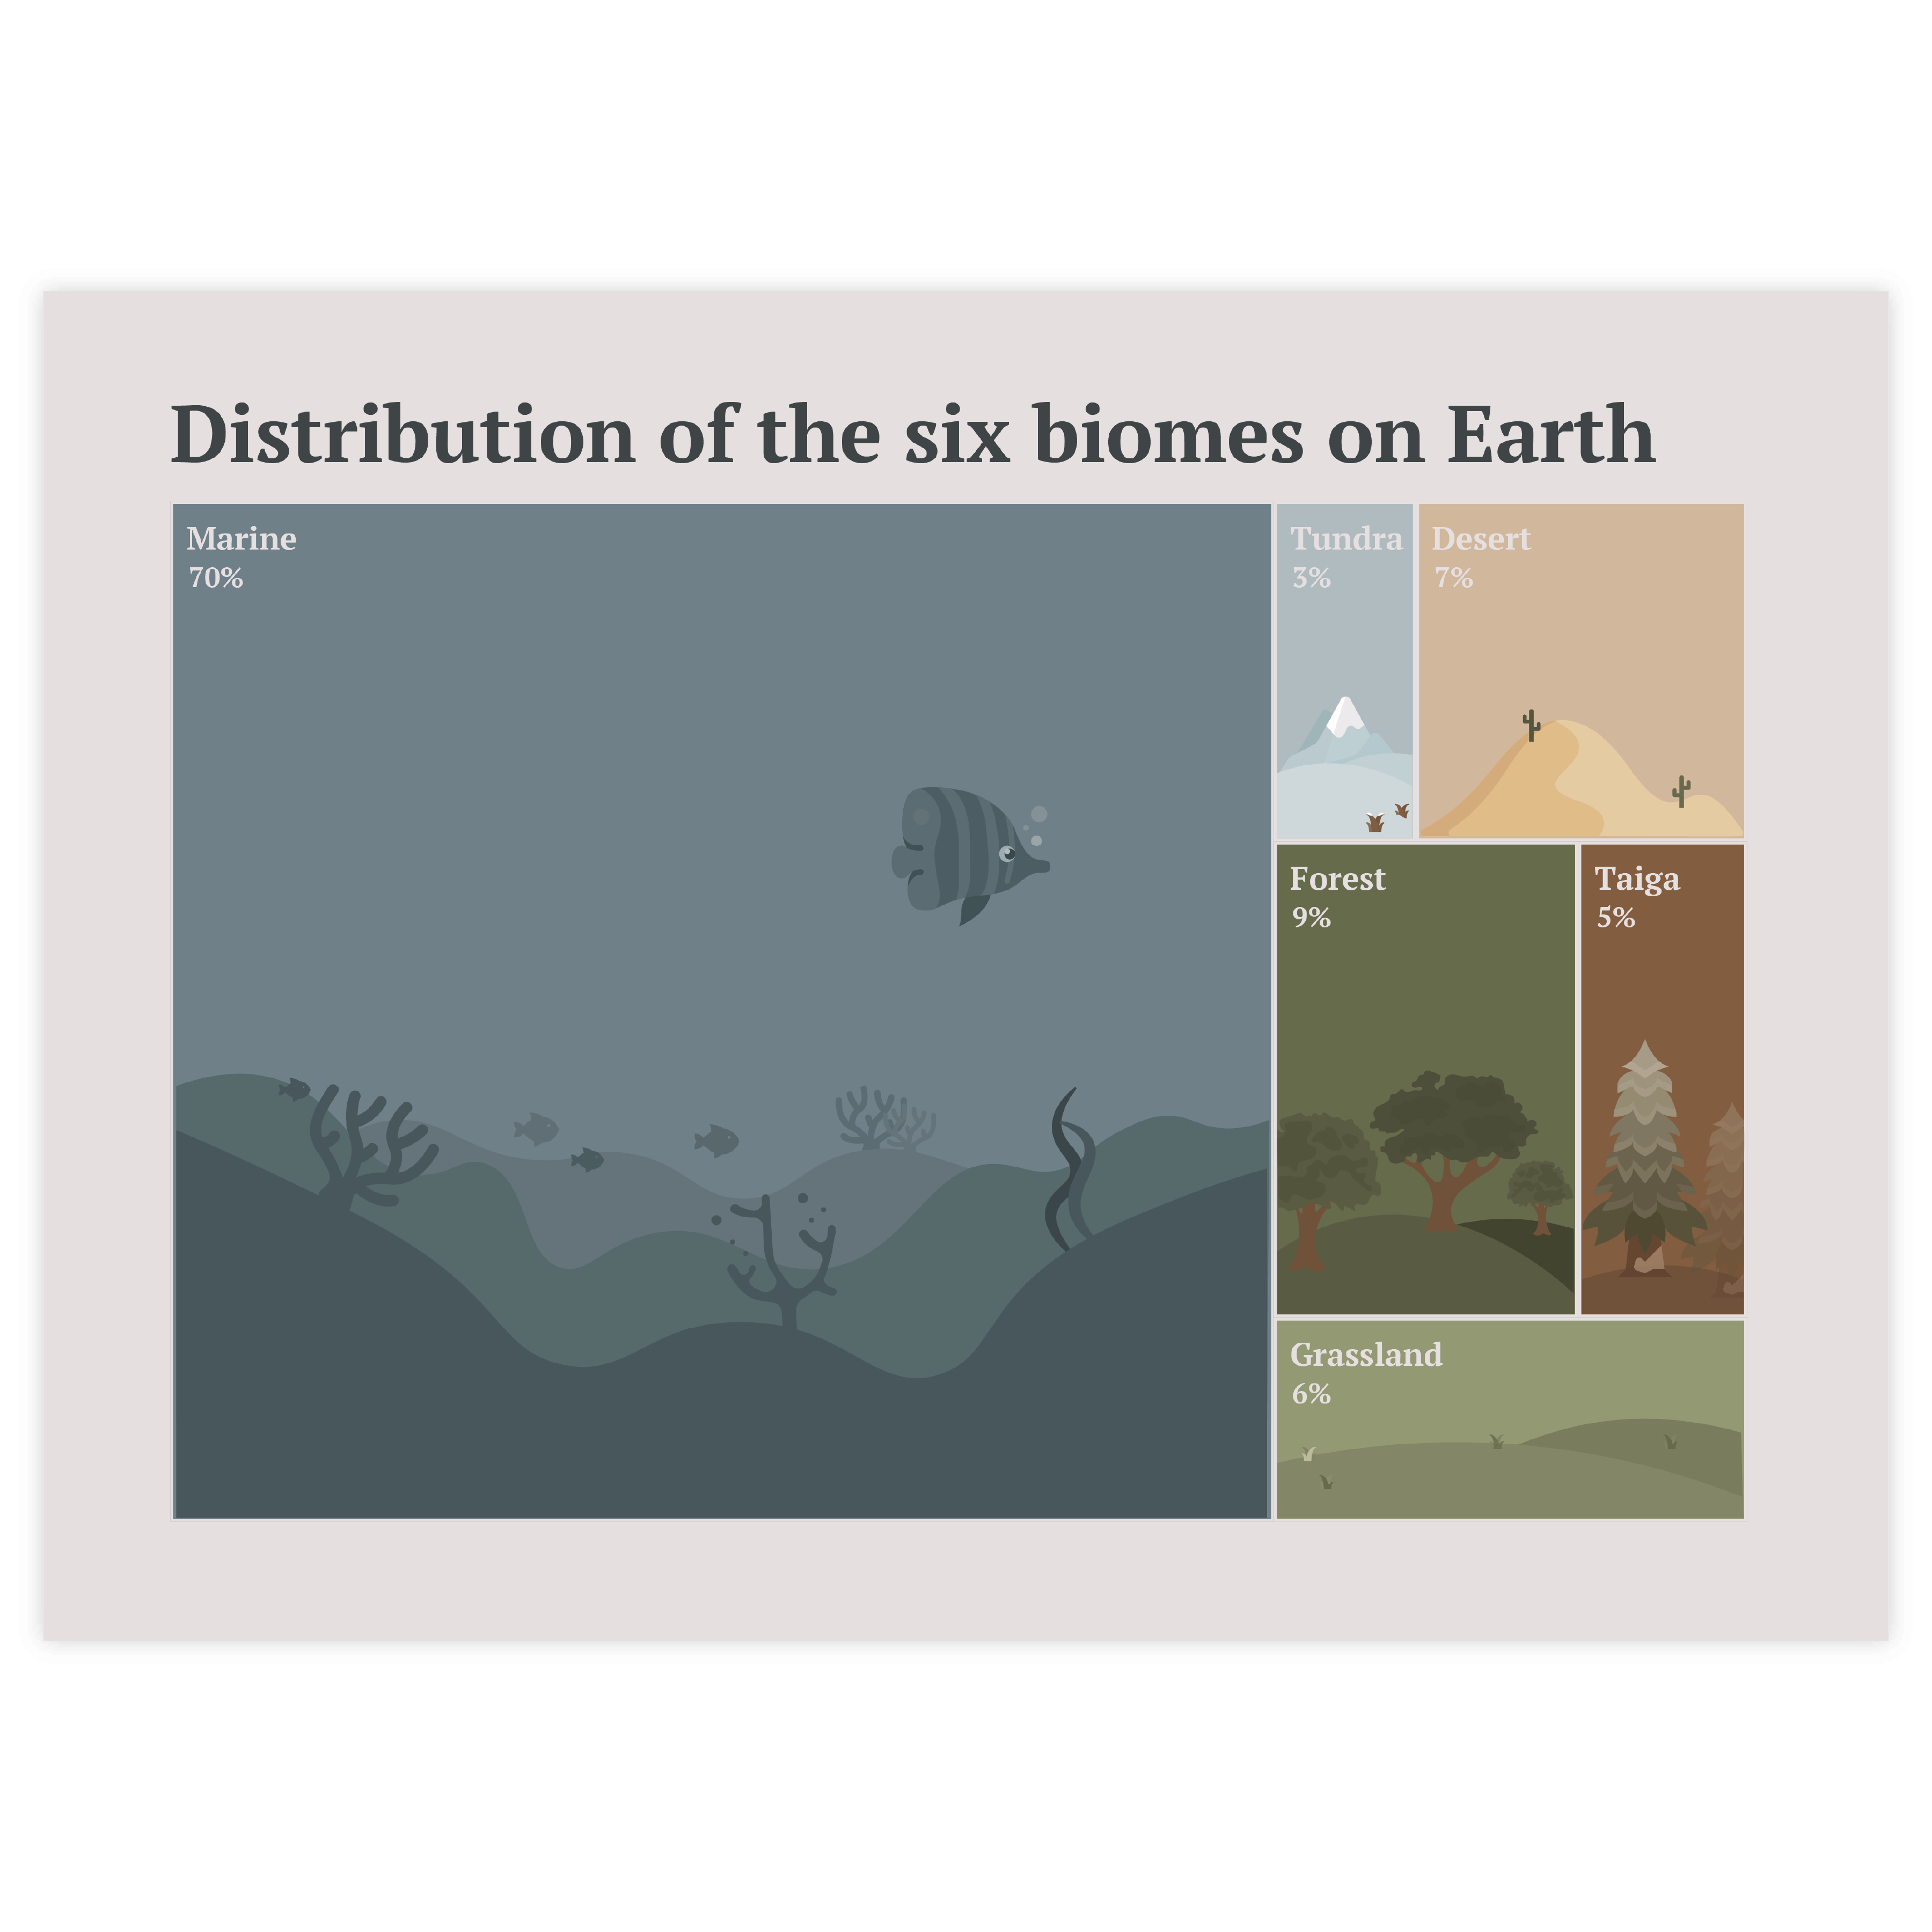
Treemap chart variation - squarified treemap

Squarified treemap

Unlike a conventional treemap, where rectangles vary in shape, a squarified treemap uses rectangles that closely resemble squares. This makes it easier to compare them.

Alternatives to a treemap

Before making a treemap, assess if it's the best choice for your data. Often, other charts are more effective because treemaps can make it challenging for readers to compare areas.
So, ask yourself if you have many categories and hierarchical data. If not, opt for one of the alternative charts below for a clearer part-to-whole relationship visualization.
Treemap chart alternative - bar chart

Bar chart

The most simple alternative to a treemap is the bar chart. Instead of using the areas of the rectangles, the bar chart uses the length of the bars to communicate the values. This makes it easier to compare the categories.

Treemap chart alternative - stacked bar chart

Stacked bar chart

A stacked bar chart can be used as an alternative for a treemap when you are dealing with small numbers of (sub)categories. Unlike the treemap, the rectangles are arranged side by side.

Treemap chart alternative - pie chart

Pie chart

You can use a pie chart if you are dealing with only one dimension and the values in your data add up to 100%. The pie chart uses the surface of the slices in combination with the arc length to communicate the value.

Pro tips for designing a treemap

Learn how to improve the readability and visual appeal of your treemap chart.
Pro tips for designing a treemap chart - when to use a treemap

Usage

Treemaps are perfect to use if you have to visualize a dataset with large quantities of categories. Moreover, if you want to grab the attention, using the treemap might also be a good choice to stand out from other, more popular charts.

Pro tips for designing a treemap chart - sorting data in a treemap

Sorting

The treemap works best with hierarchical data and therefore sorting the rectangles in descending order helps the user to read the chart. This means that the biggest category will be placed on the top left and the smallest category on the bottom right. Reading from left-to-right, top-to-bottom is the natural way (in most languages) to read, which makes it convenient to apply this in a treemap as well.

Read more
Pro tips for designing a treemap chart - labeling / labels in a treemap graph

Labeling

If you picked the treemap as your chart, you are probably dealing with a lot of data. This may lead to the inclusion of numerous category labels. Since the rectangle sizes represent dataset values, some labels might not fit within their respective rectangles. Make sure to remove those labels that do not fit and retain only the crucial ones. Luckily, most of the time the labels that correspond to the largest rectangles of your chart are the most important ones and the ones you want to clarify. For important smaller categories, consider adding chart annotations for clarity.

Read more
Pro tips for designing a treemap chart - highlighting data in treemap graphs

Highlighting

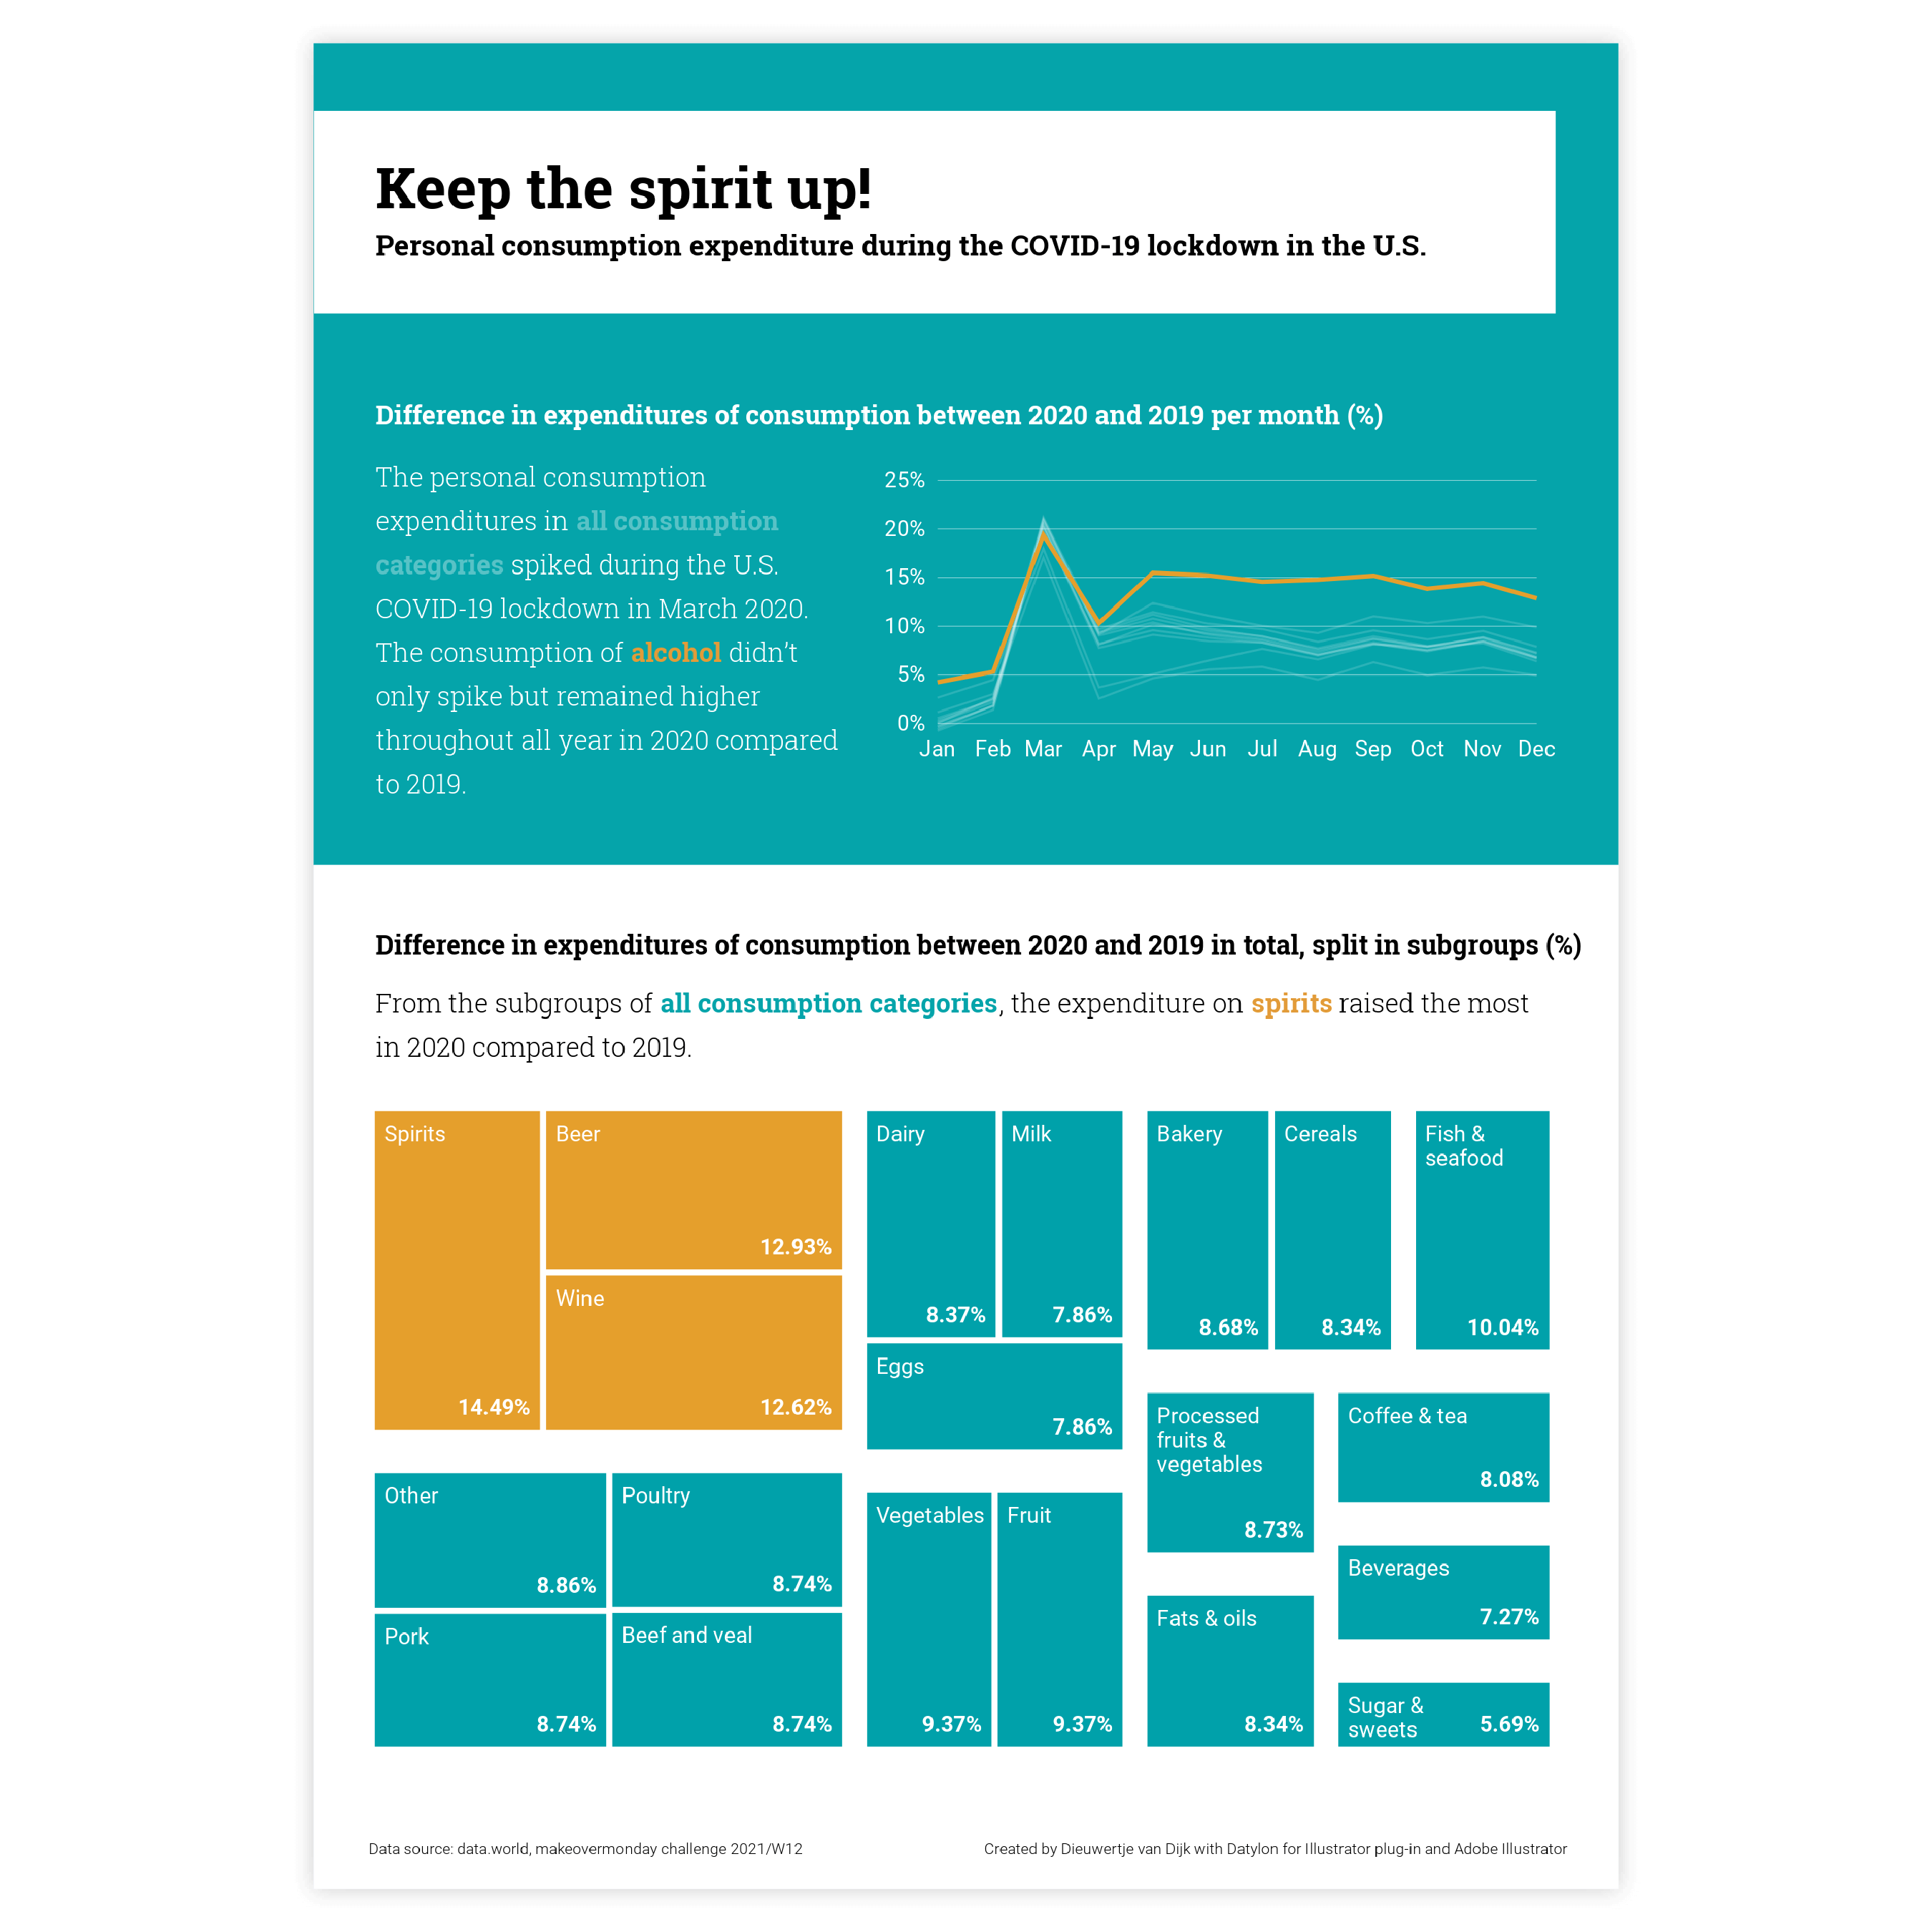
To draw attention to the most important categories of the treemap, a good solution is to highlight these rectangles by adding an outline to the rectangles or filling the rectangle in a specific color and applying a lighter shade of the same color to all the other rectangles. Our brain is programmed to notice deviations instantly. This can be done, for example, by applying changes in size, movement, or color. This way, highlighting a specific rectangle will help catch the reader’s eye immediately.

Read more
Pro tips for designing a treemap chart - coloring - how to use colors in treemap chart

Coloring

Coloring of the treemap is a valuable way to communicate your message more clearly and there are multiple ways to do it. Coloring could be used to differentiate between the categories of your chart. Most treemaps have different colors for each category of the first dimension and the subcategories have the same color.

It is also possible to apply performance-based coloring, like change over time or satisfaction. This could be accomplished by using a sequential color palette. You can also show both positive and negative values in your treemap by using a diverging color palette. Though, be careful with showing negative values in a treemap and consider whether using another type of chart isn’t more convenient to use. 

Read more
Pro tips for designing a treemap chart - using the rest category in treemap

Rest category

Sometimes you are dealing with a lot of categories which can make your treemap very chaotic. If the data allows it, and if it suits the message you want to convey, it is also a possibility to combine all small categories into one “other” category and to label it as such. Ideally, the “other” category is not bigger than the next to the last category.

Create your own treemap

Join Datylon for free and get started online or download our Datylon for Illustrator plug-in with a 14-day trial. Connect with a Datylon expert for a demo session.

Treemap chart inspiration

Scroll and click on the images below to find inspiration samples of treemaps. With your Datylon account, you can use these designs, customize them and update them with new data.

Discover more charts in our Chart Library

Learn more about the different types of charts and graphs you can design with Datylon. Discover other resource pages in our Datylon Chart Library.