


Industry, Report Design, Reporting, Consultancy
How Datylon helped Black Pearl Analytics to make dashboards 16x faster
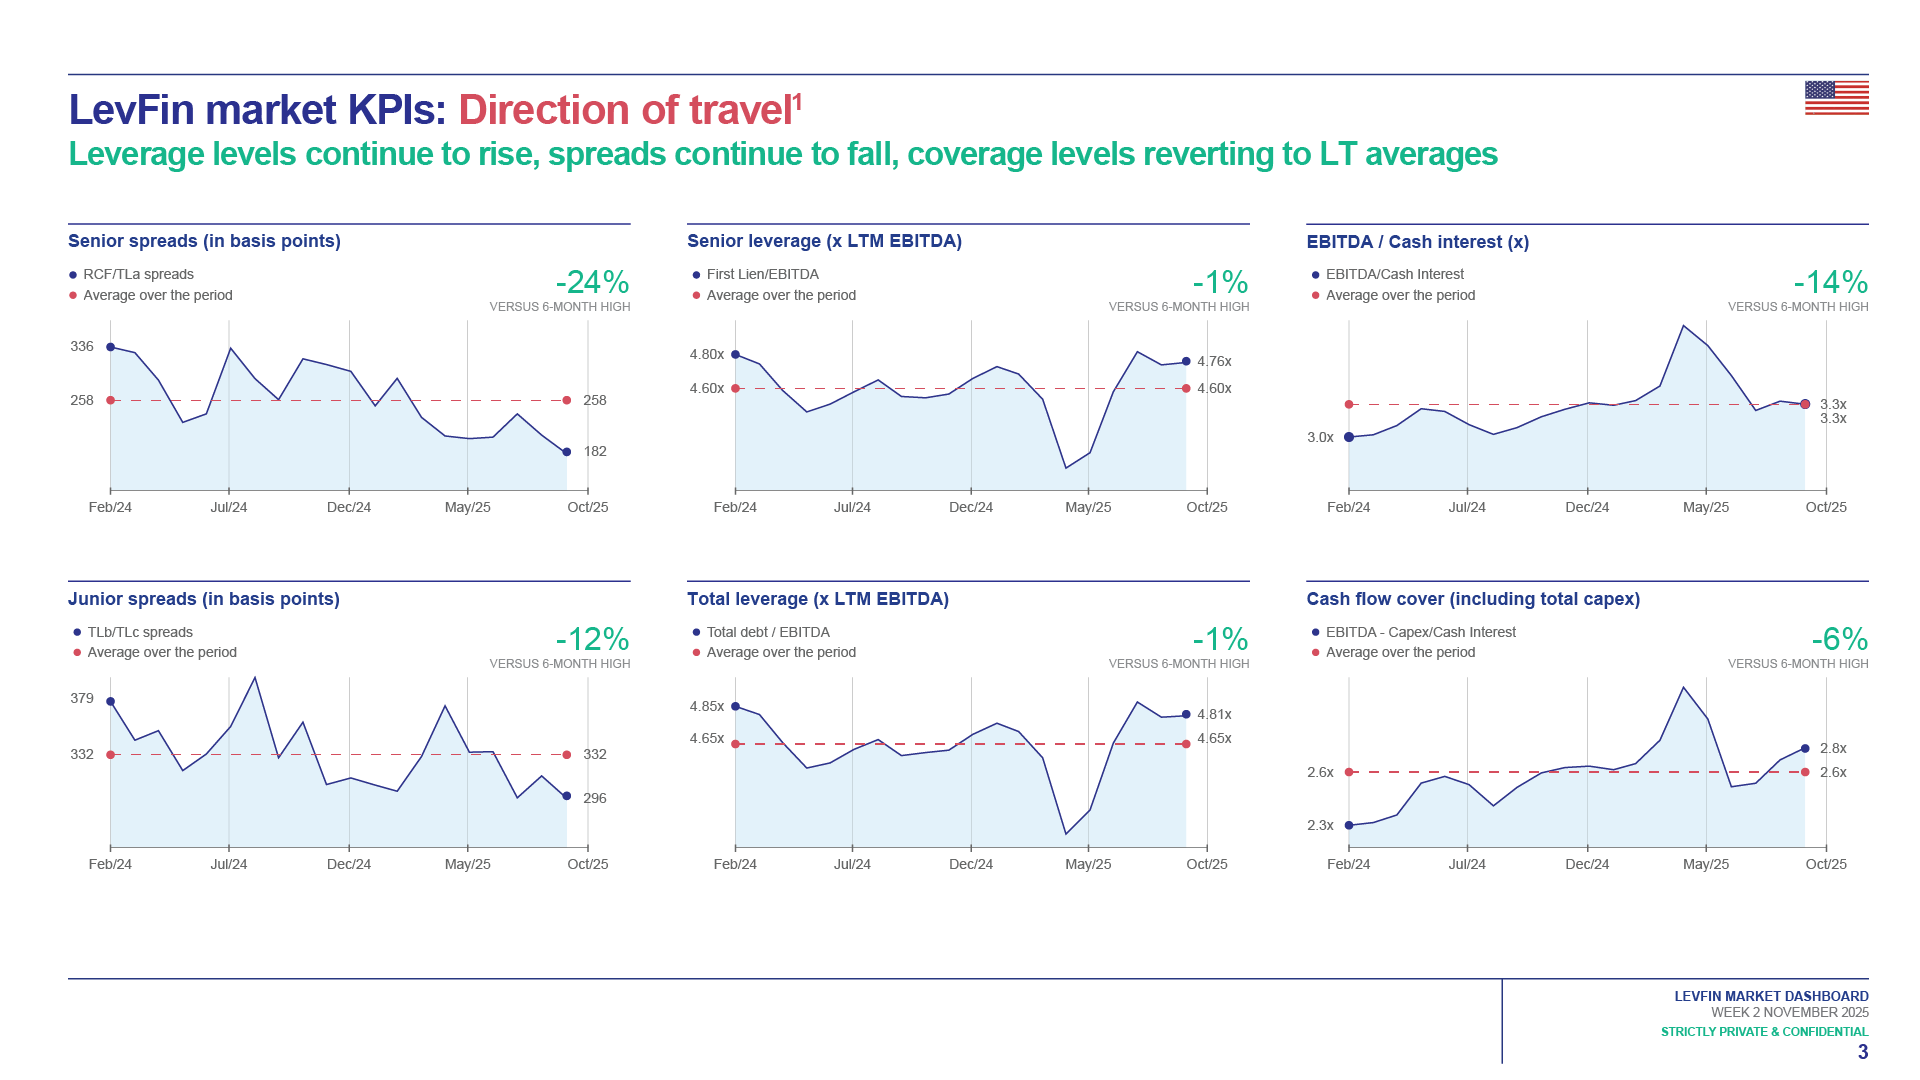
Black Pearl Analytics provides financial consultancy for businesses, asset managers, owners of...
Industry, Report Design, Reporting
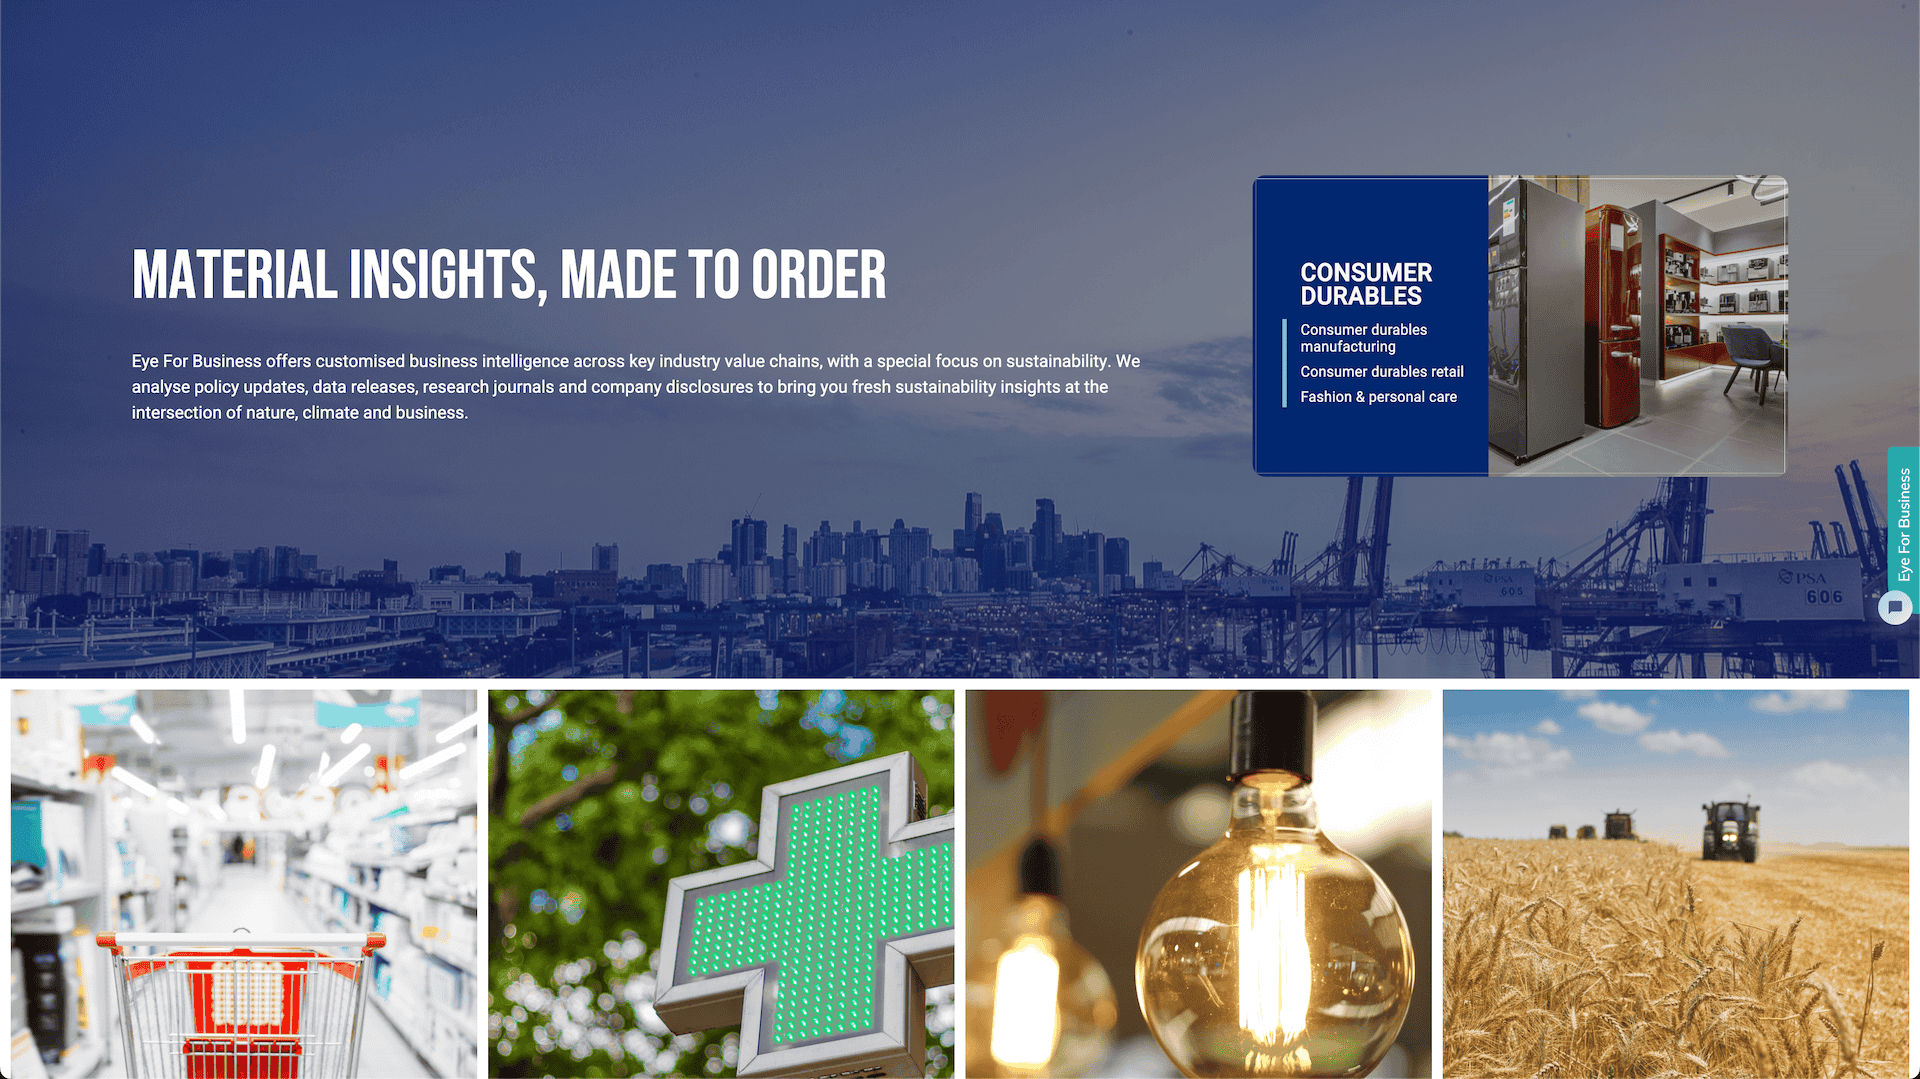
How Eye for Business Enhanced Sustainability Reporting with Datylon
Eye for Business is a platform that provides data-driven insights and expert guidance to empower...
Government, Report Design, Report Server, Reporting, Automated Reporting
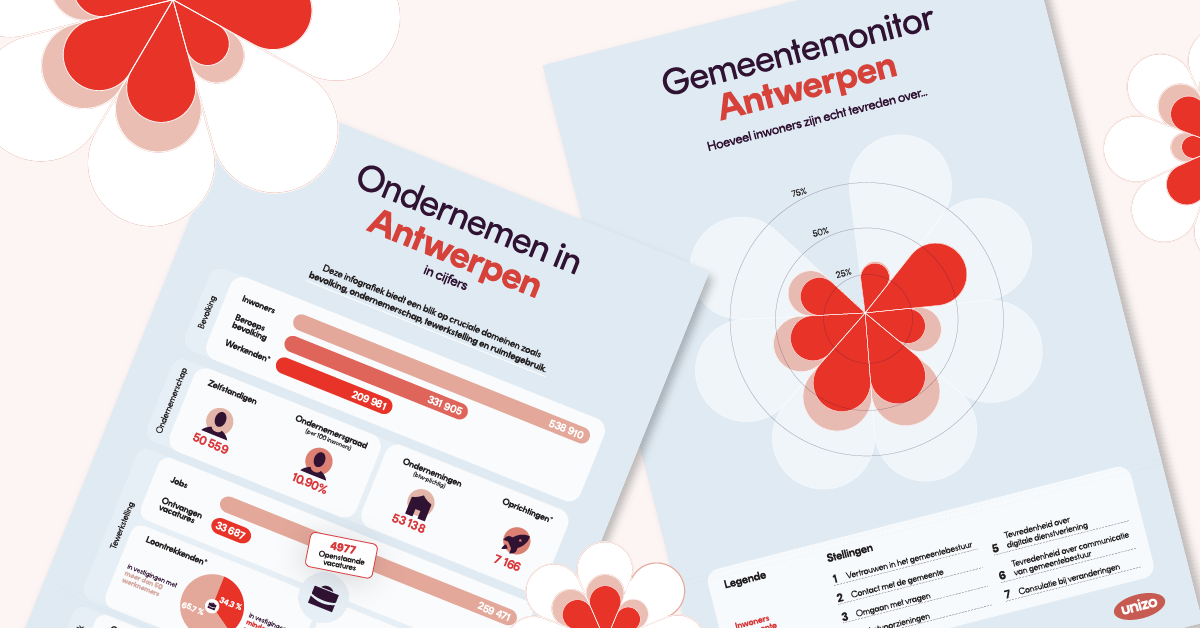
Targeted Reports to Empower Municipalities
Unizo is the largest Flemish employers’ organization in Belgium, representing over 80,000 small and...
Design Agency, Report Design, Report Server, Automated Reporting
Jaaf Information Design Unleashing the Power of Clarity
Nestled in the Netherlands with its vibrant design scene, Jaaf Information Design stands out as a...
Design Agency, Financial Services, Report Design, Report Server
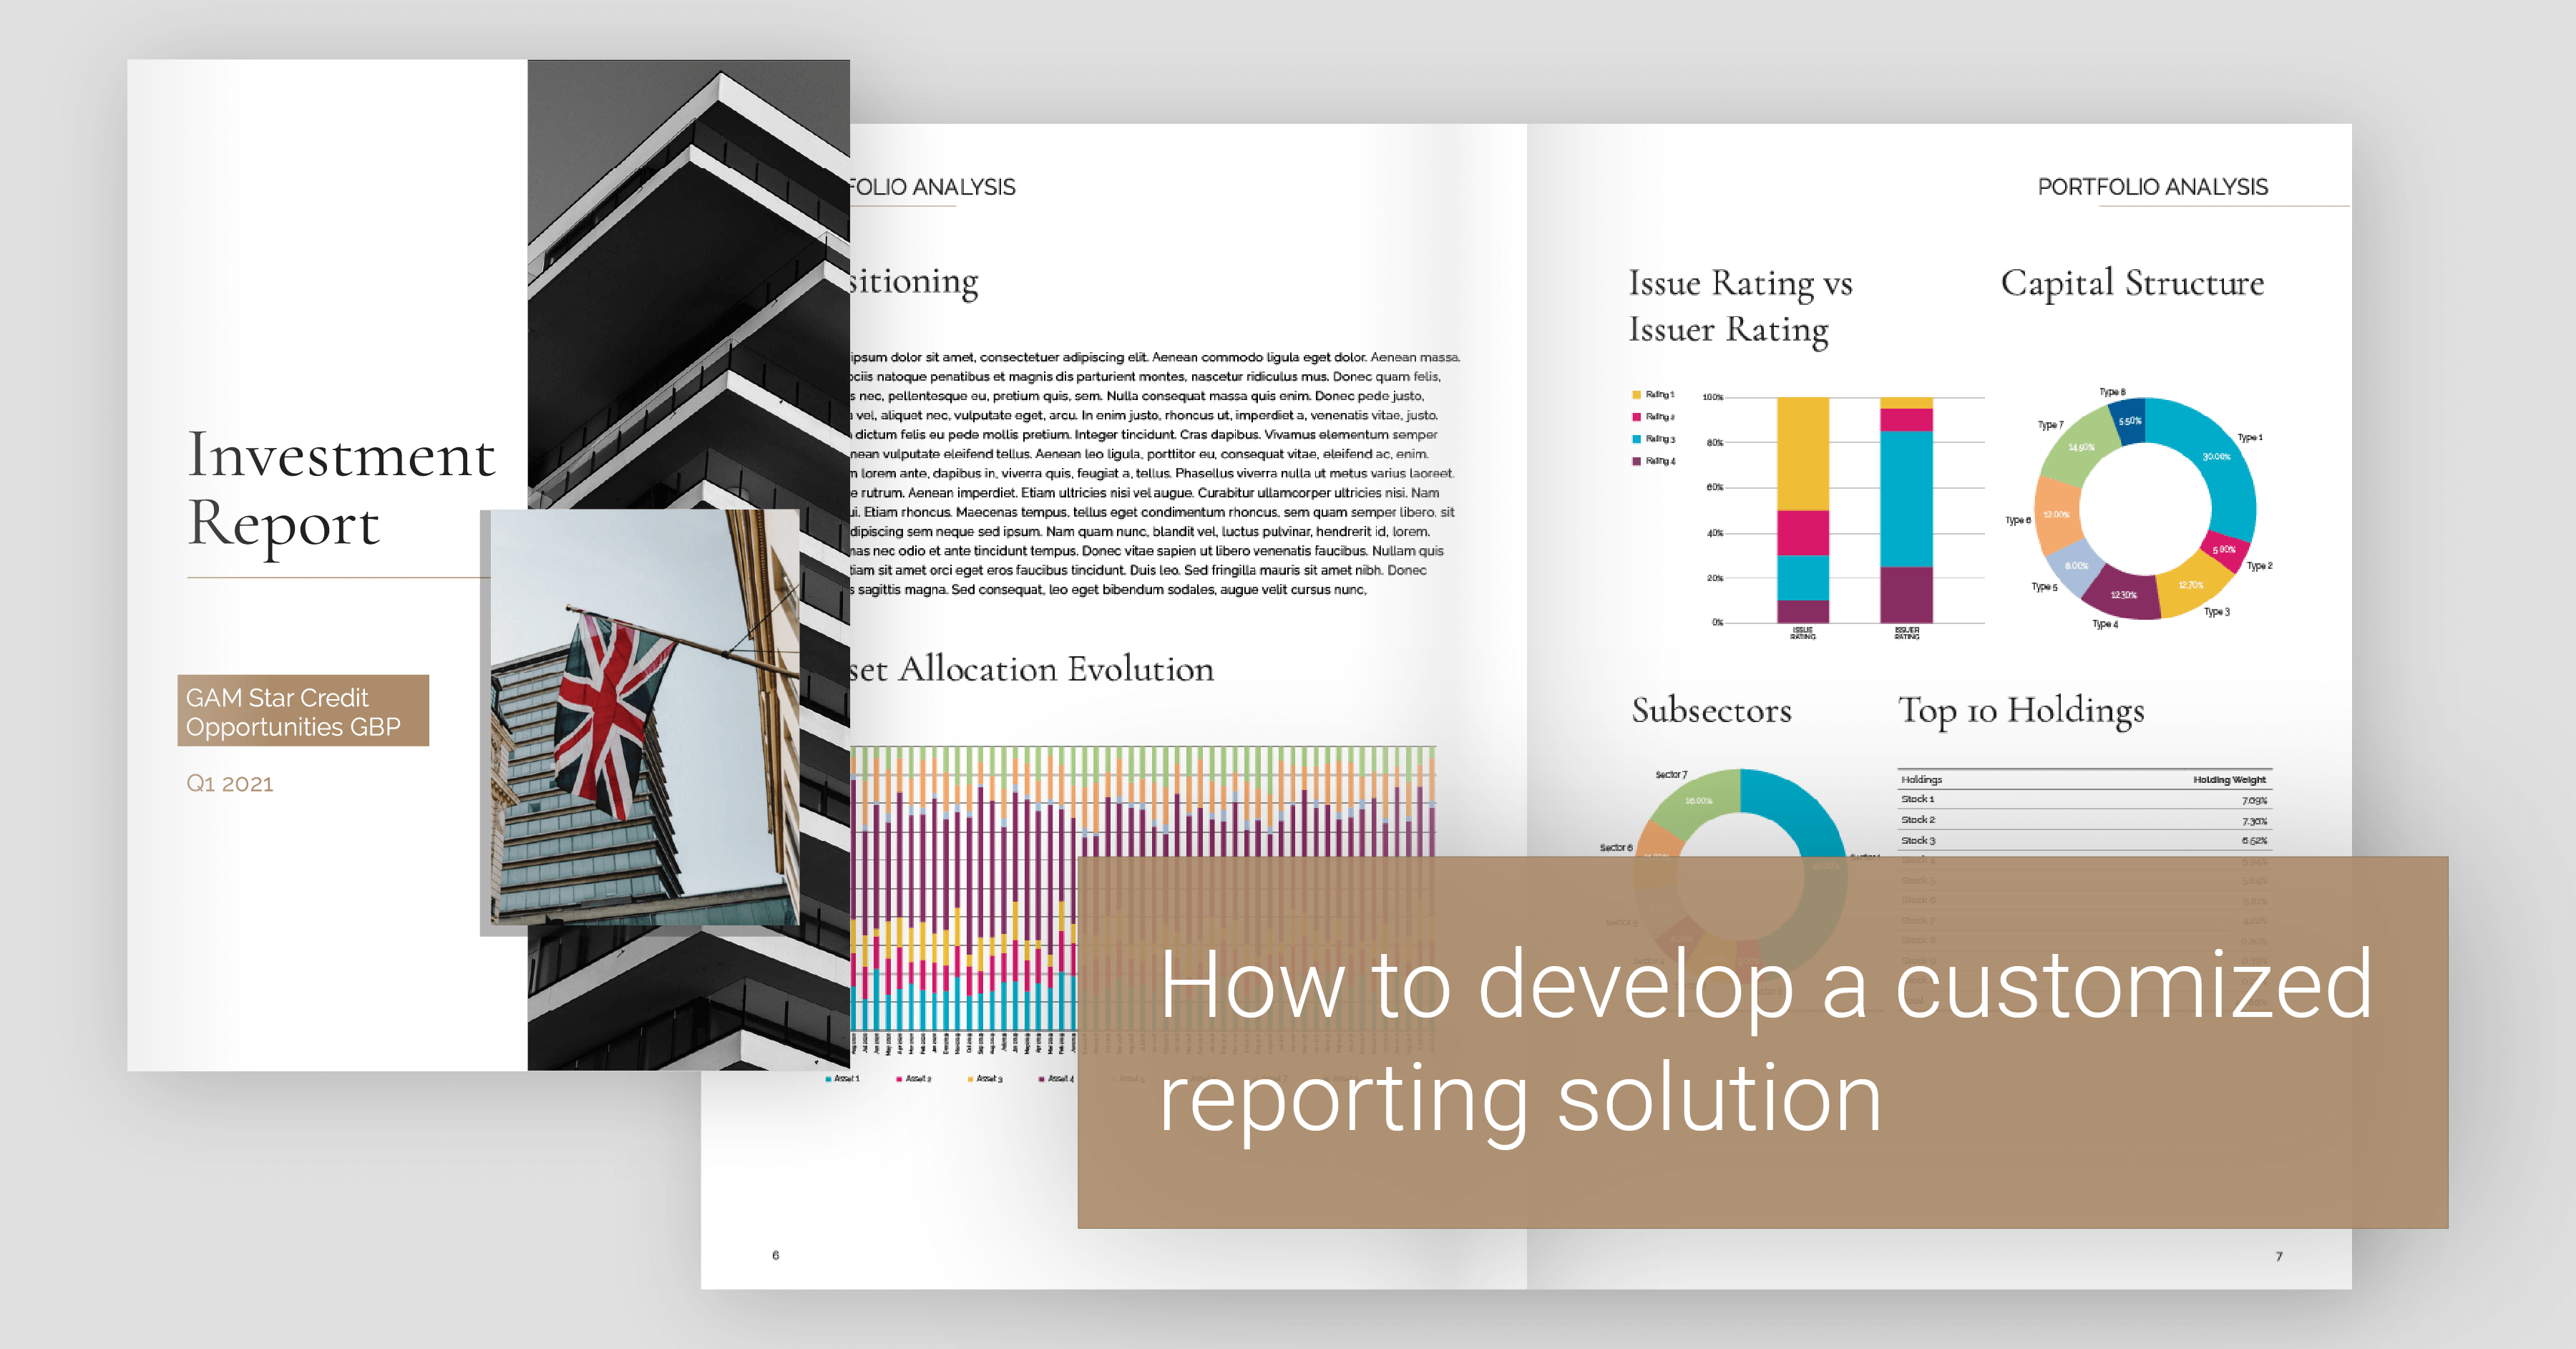
How L'Agence developed an outsourced customized reporting solution
L'AGENCE is a Swiss-based digital agency with a long-standing relationship with one of its main...
Product News, Report Design, Non Profit
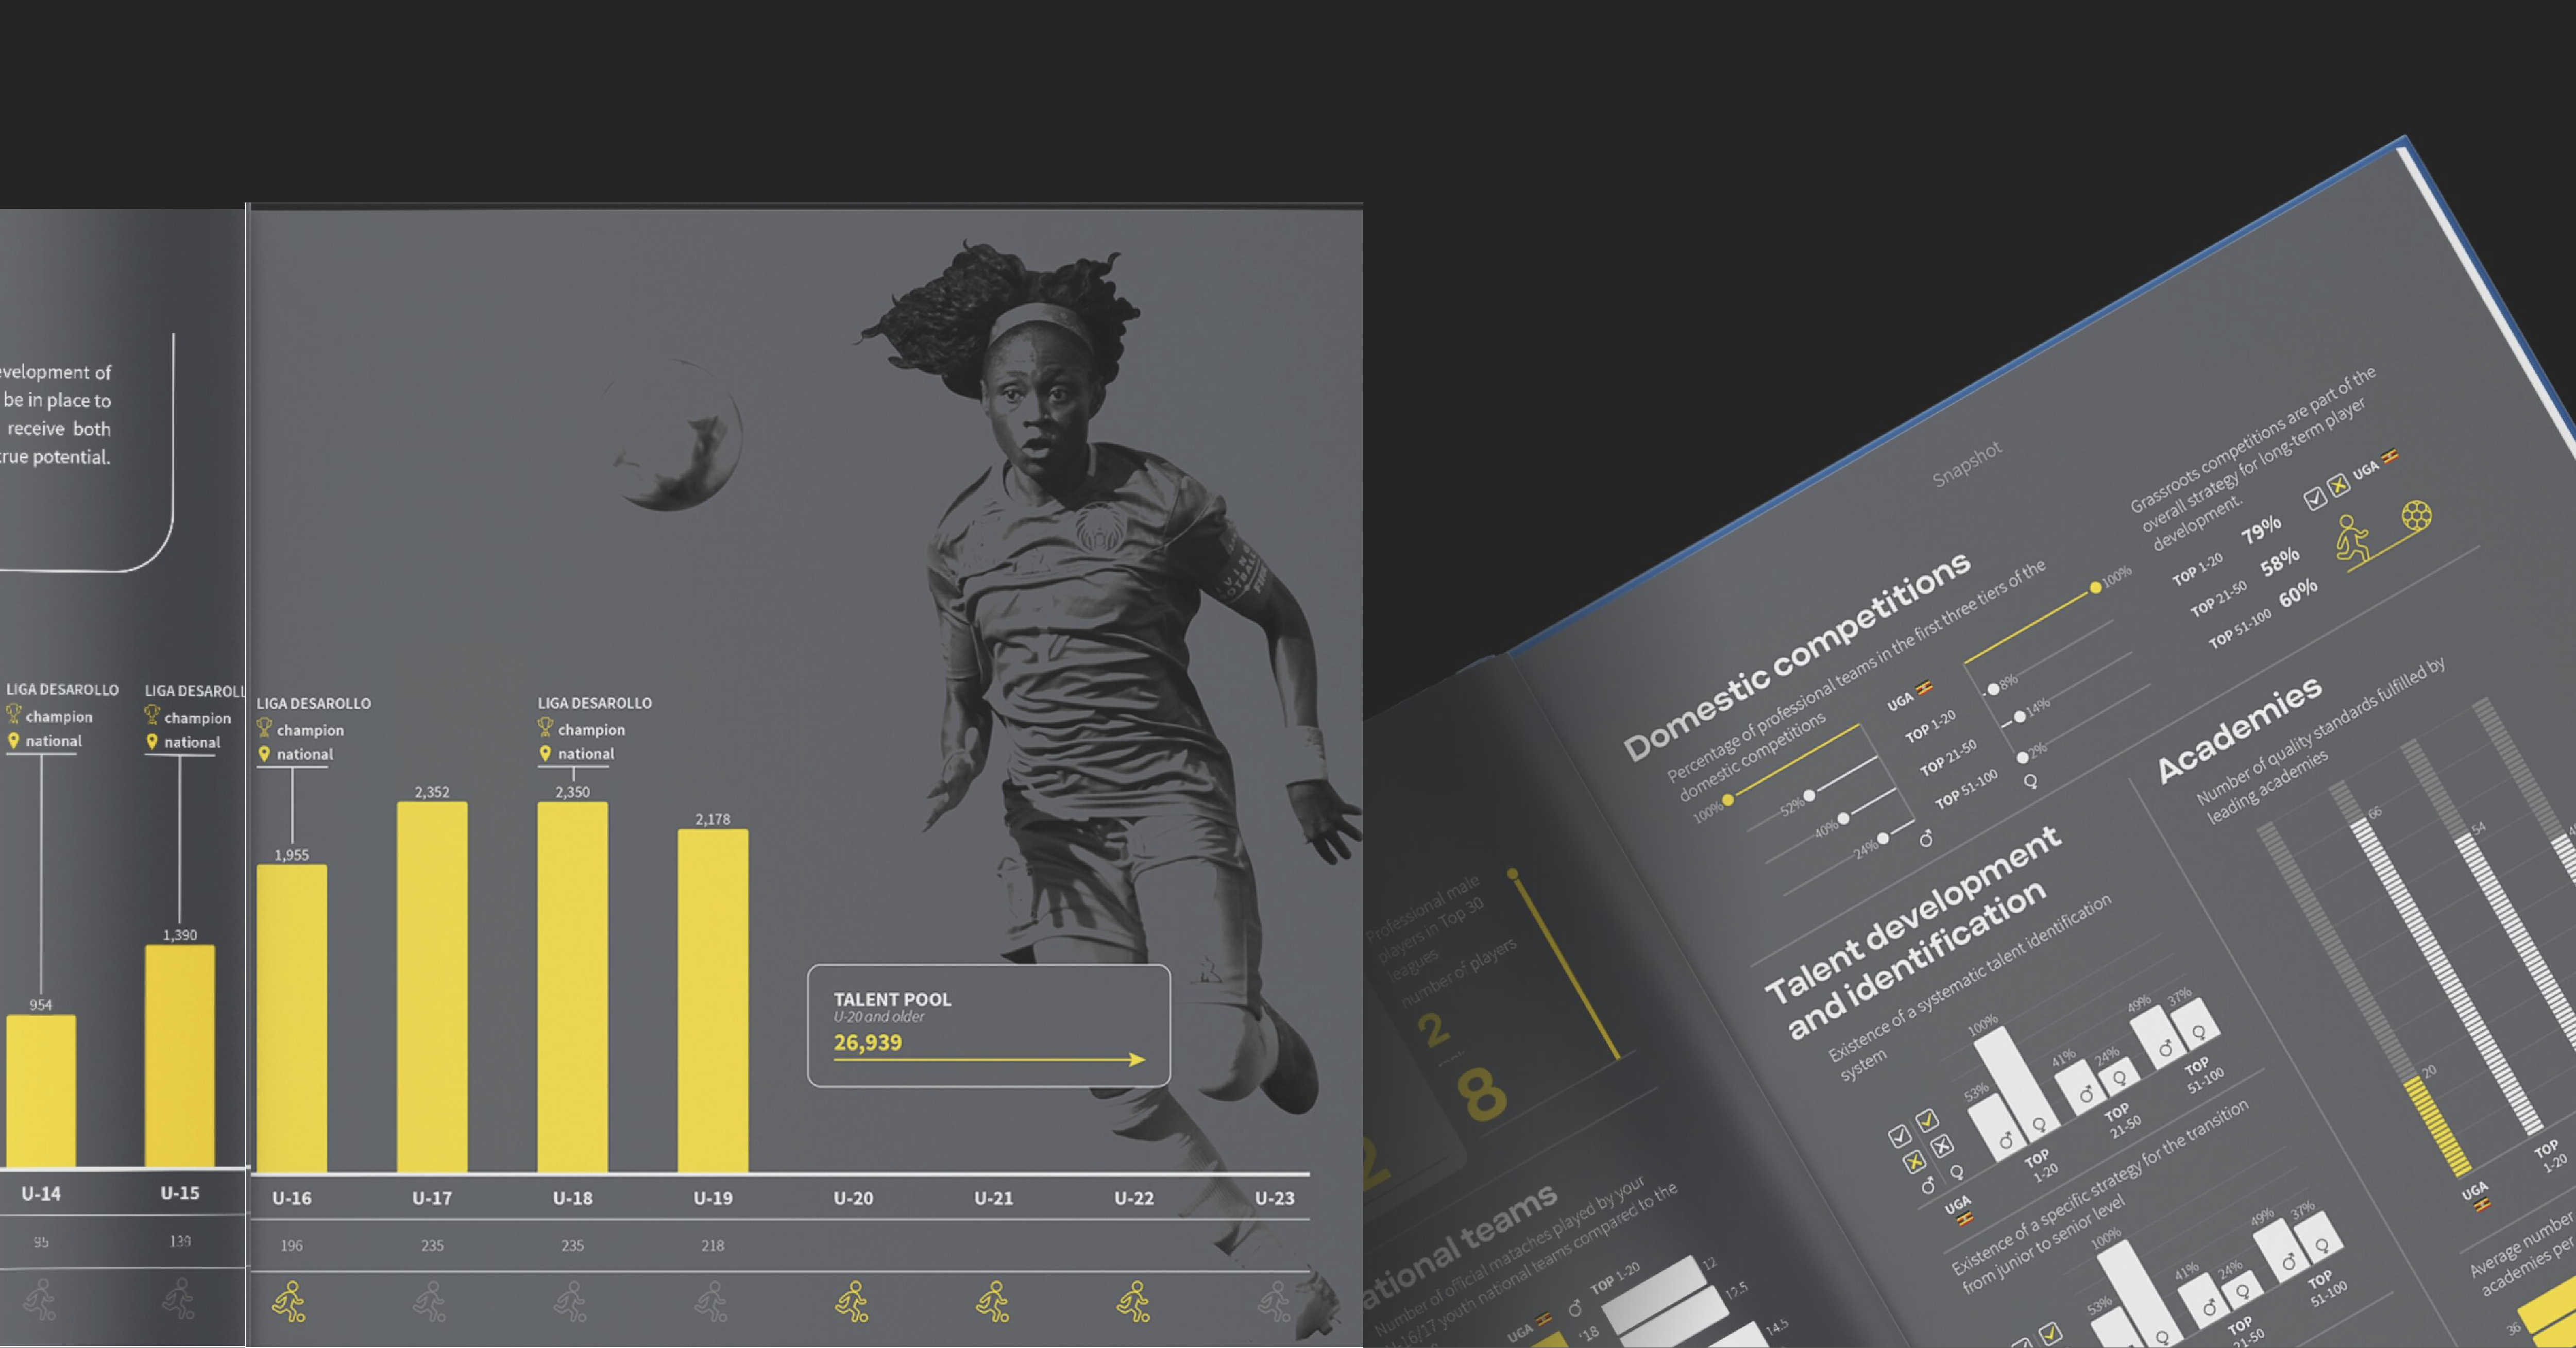
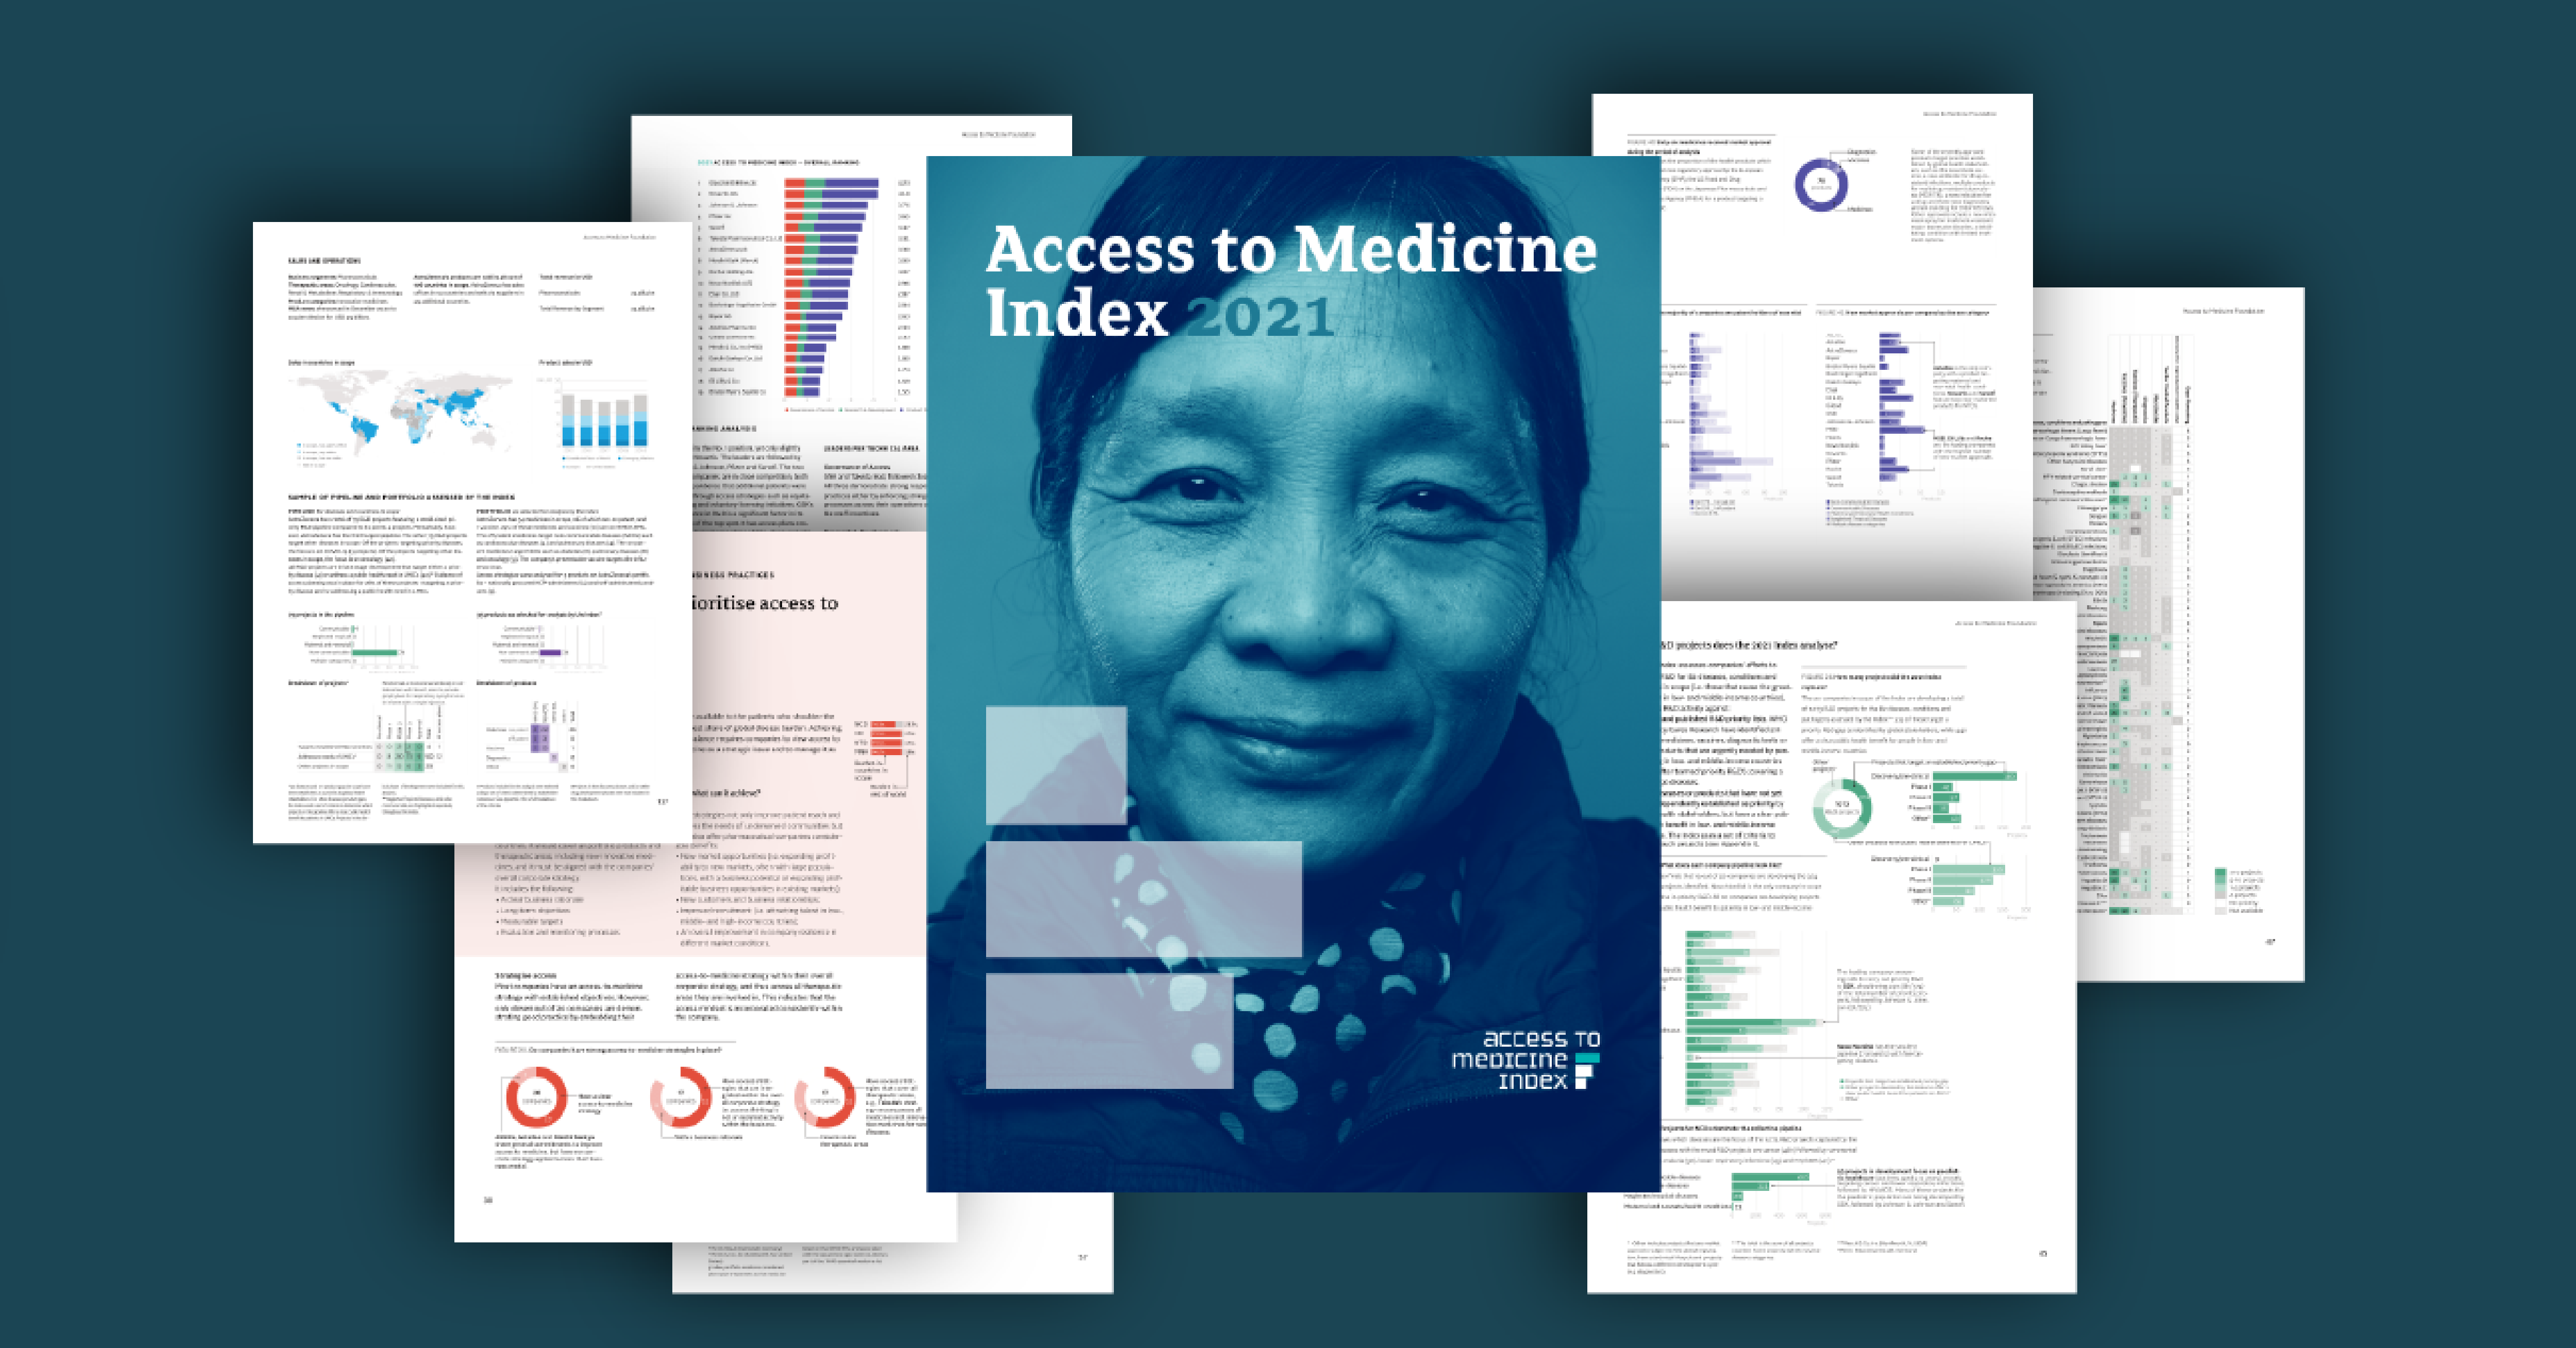
How Explanation Design uses Datylon to create a report with 250+ charts
The 2021 Access to Medicine Index report was published early last year and got a lot of worldwide...

Product, Government, Industry, Report Design
How Datylon helped the Port of Antwerp design a concise KPI report
The Port of Antwerp, Europe’s second-largest port, and growing, is a busy landmark located in...
Media/Publishing, Product, Report Design
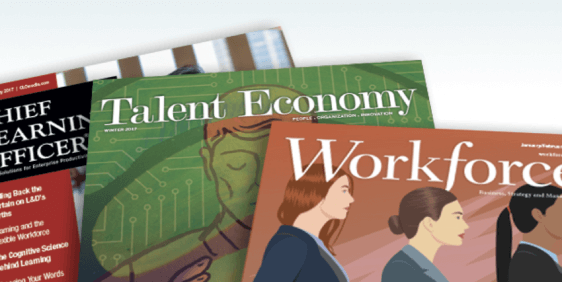
Human Capital Media designs charts 4 times faster with Datylon
Human Capital Media, an award winning US Publishing company, uses the Datylon for Illustrator...


/datylon-blog-Clear-Compelling-Compliant-%20How-to-Present-Long-Term-Sustainability-Goals-in-CSRD-Reporting-featured-image-2.png)