Product News, Report Design, Non Profit
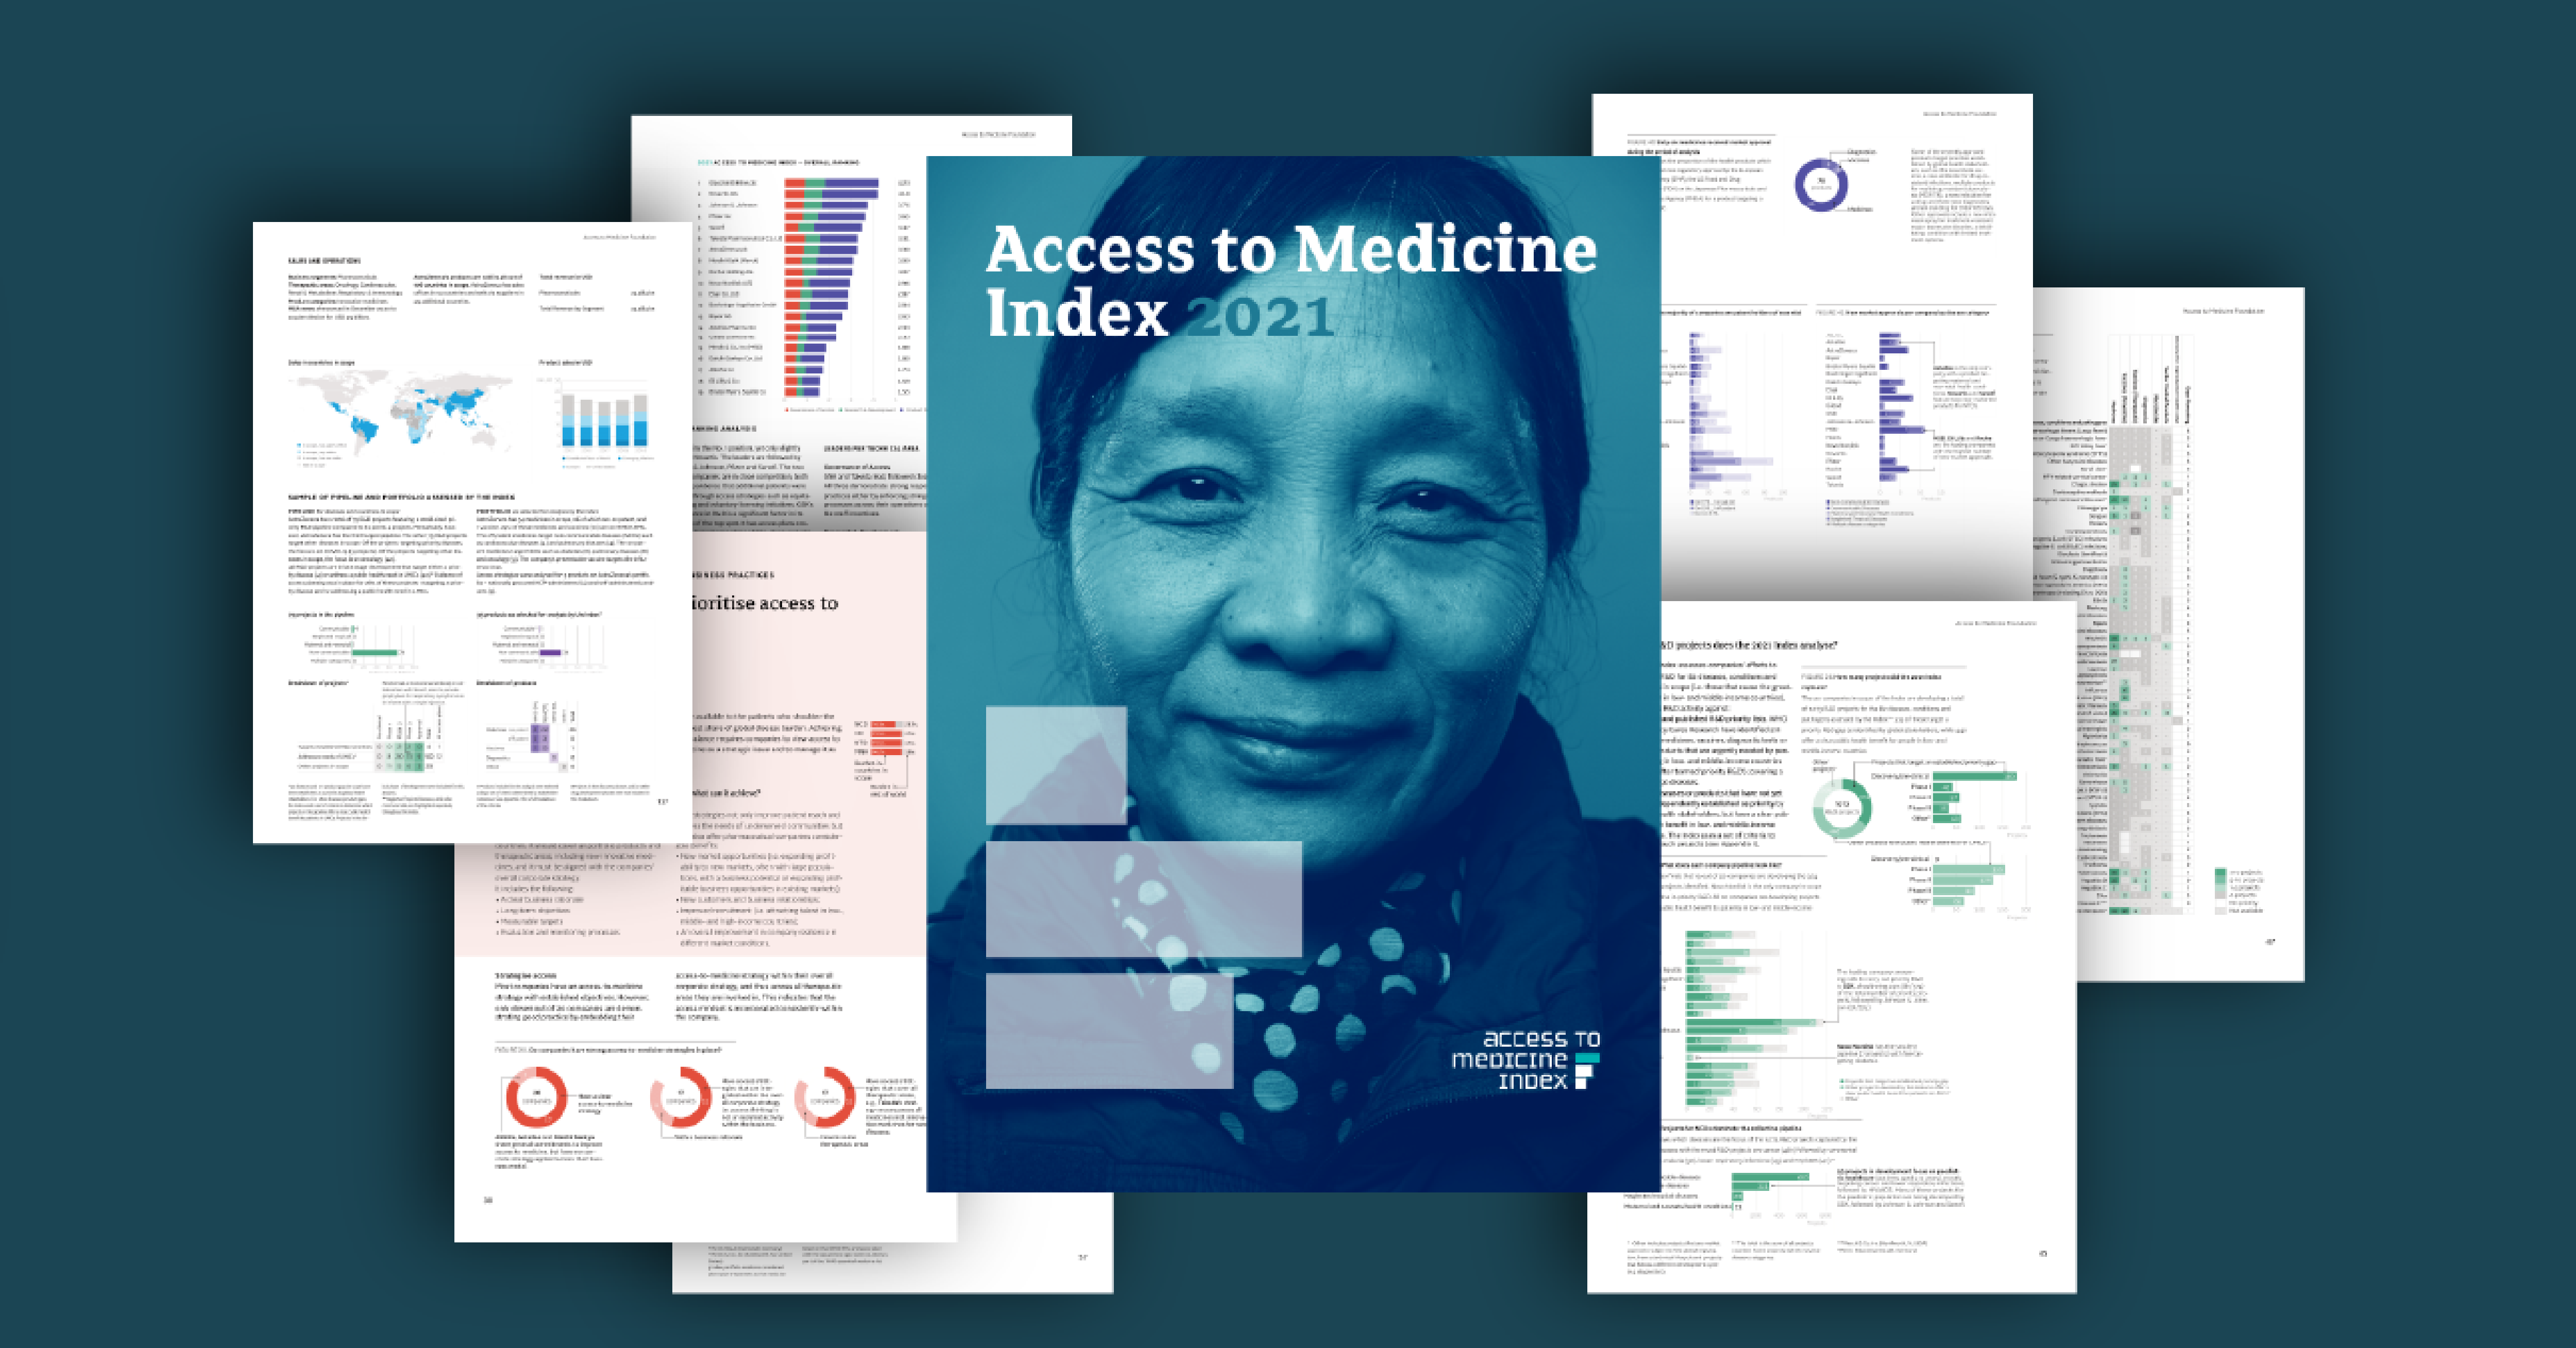
How Explanation Design uses Datylon to create a report with 250+ charts
The 2021 Access to Medicine Index report was published early last year and got a lot of worldwide...

Project, Non Profit
How Datylon and Straatvinken use dataviz to help the environment
Belgium has the worst traffic in Europe. And it's not even an exaggeration. Belgium has been called...
Subscribe to our newsletter
Receive inspiration, practical advice, customer stories and news right in your mailbox

Project, Industry, Non Profit
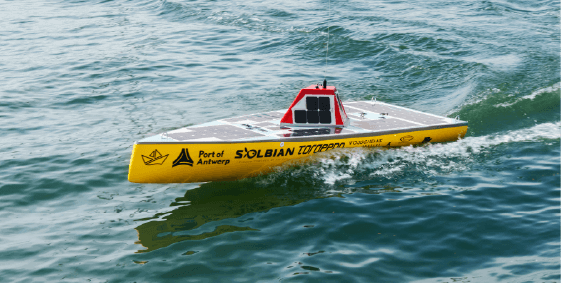
How Datylon helps Project Mahi track the collecting of ocean data
After months of testing and improvements, Project Mahi has launched its second attempt to cross the...