Eye for Business is a platform that provides data-driven insights and expert guidance to empower businesses to navigate the complexities of sustainability reporting. By facilitating transparent disclosure of sustainability impacts, risks and opportunities, Eye For Business helps companies ensure regulatory compliance, avoid penalties and position themselves as leaders in the rapidly evolving landscape of corporate sustainability.
Introduction
The complexity of sustainability risk management stems from a proliferation of binding and voluntary frameworks and a lack of consistent application (for example, regarding carbon and biodiversity accounting). The EU has led global regulatory efforts to bring greater rigour to corporate sustainability disclosures. Eye For Business offers comprehensive insights and guidance to help companies mitigate operational risks, improve compliance and burnish their sustainability credentials.
Eye For Business's team of editors, researchers and industry experts use qualitative “big” data analysis and AI tools to analyse public disclosures, policy papers and regulations. A comprehensive research process ensures that articles are informative and actionable for companies. Each Eye For Business article is focused on a specific material impact, risk or opportunity and based on a review of disclosures by leading reporting entities, provides actionable recommendations for companies. This structure helps businesses understand the potential challenges and benefits associated with different sustainability practices.
Designed for C-Suite executives, Eye For Business's quarterly publications, covering eight main sectors and 24 industries, provide industry-specific insights and external audit evidence to support companies' accounting judgements, internal decision-making and external reporting.

Challenge
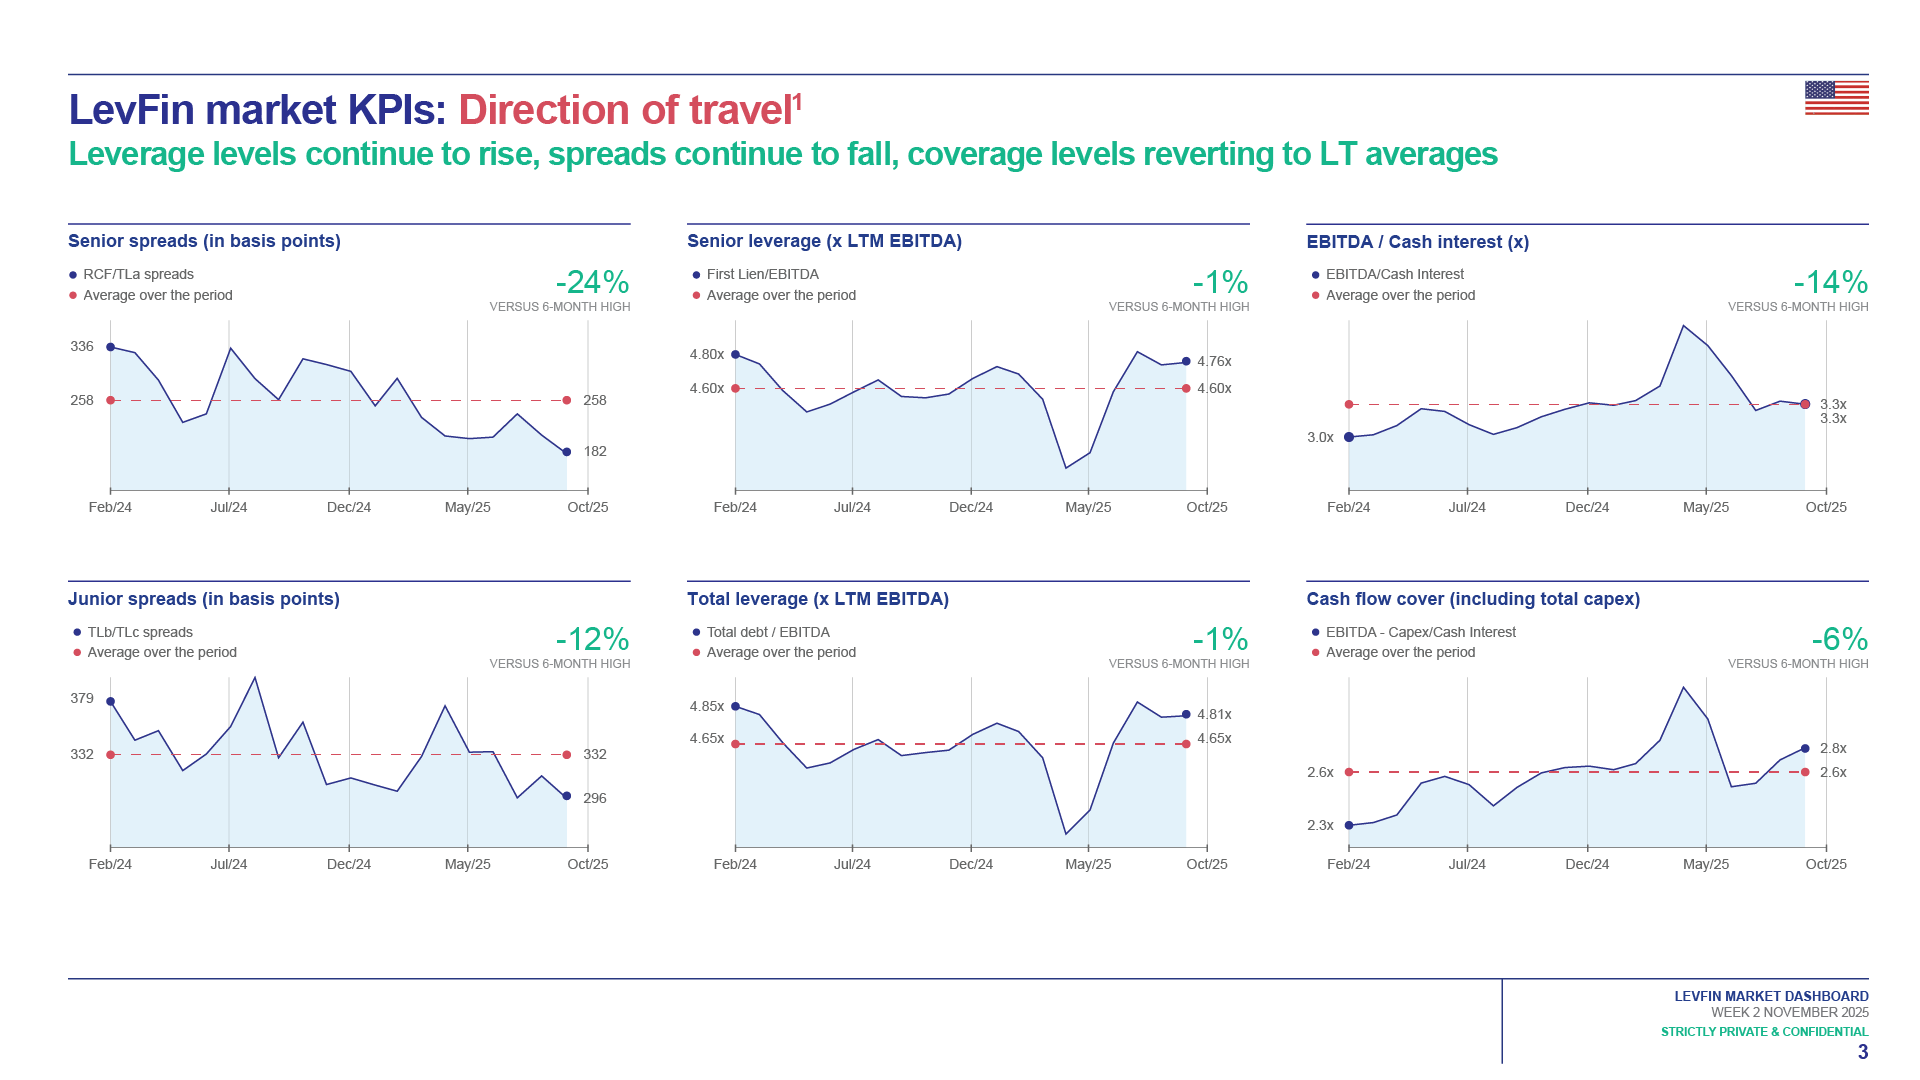
The primary workload between delivering industry reports repeats each calendar quarter when Eye For Business produces approximately 200 articles, calendars and risk profiles. Every article consists of an “At a glance” section, around 4 paragraphs of text, two graphics and a “Further reading” section at the end of the article. At two graphics per article, this is a volume of 300 graphics per quarter.
Manual creation of all these visuals would be impossible from internal resources, in terms of both money and time. Furthermore, the industry writers hired by Eye For Business are not trained as designers. Against this backdrop, it was essential for Eye For Business to find a scalable solution capable of providing professional graphics based on the delegation of both content and image generation to external writers.
Solution and implementation
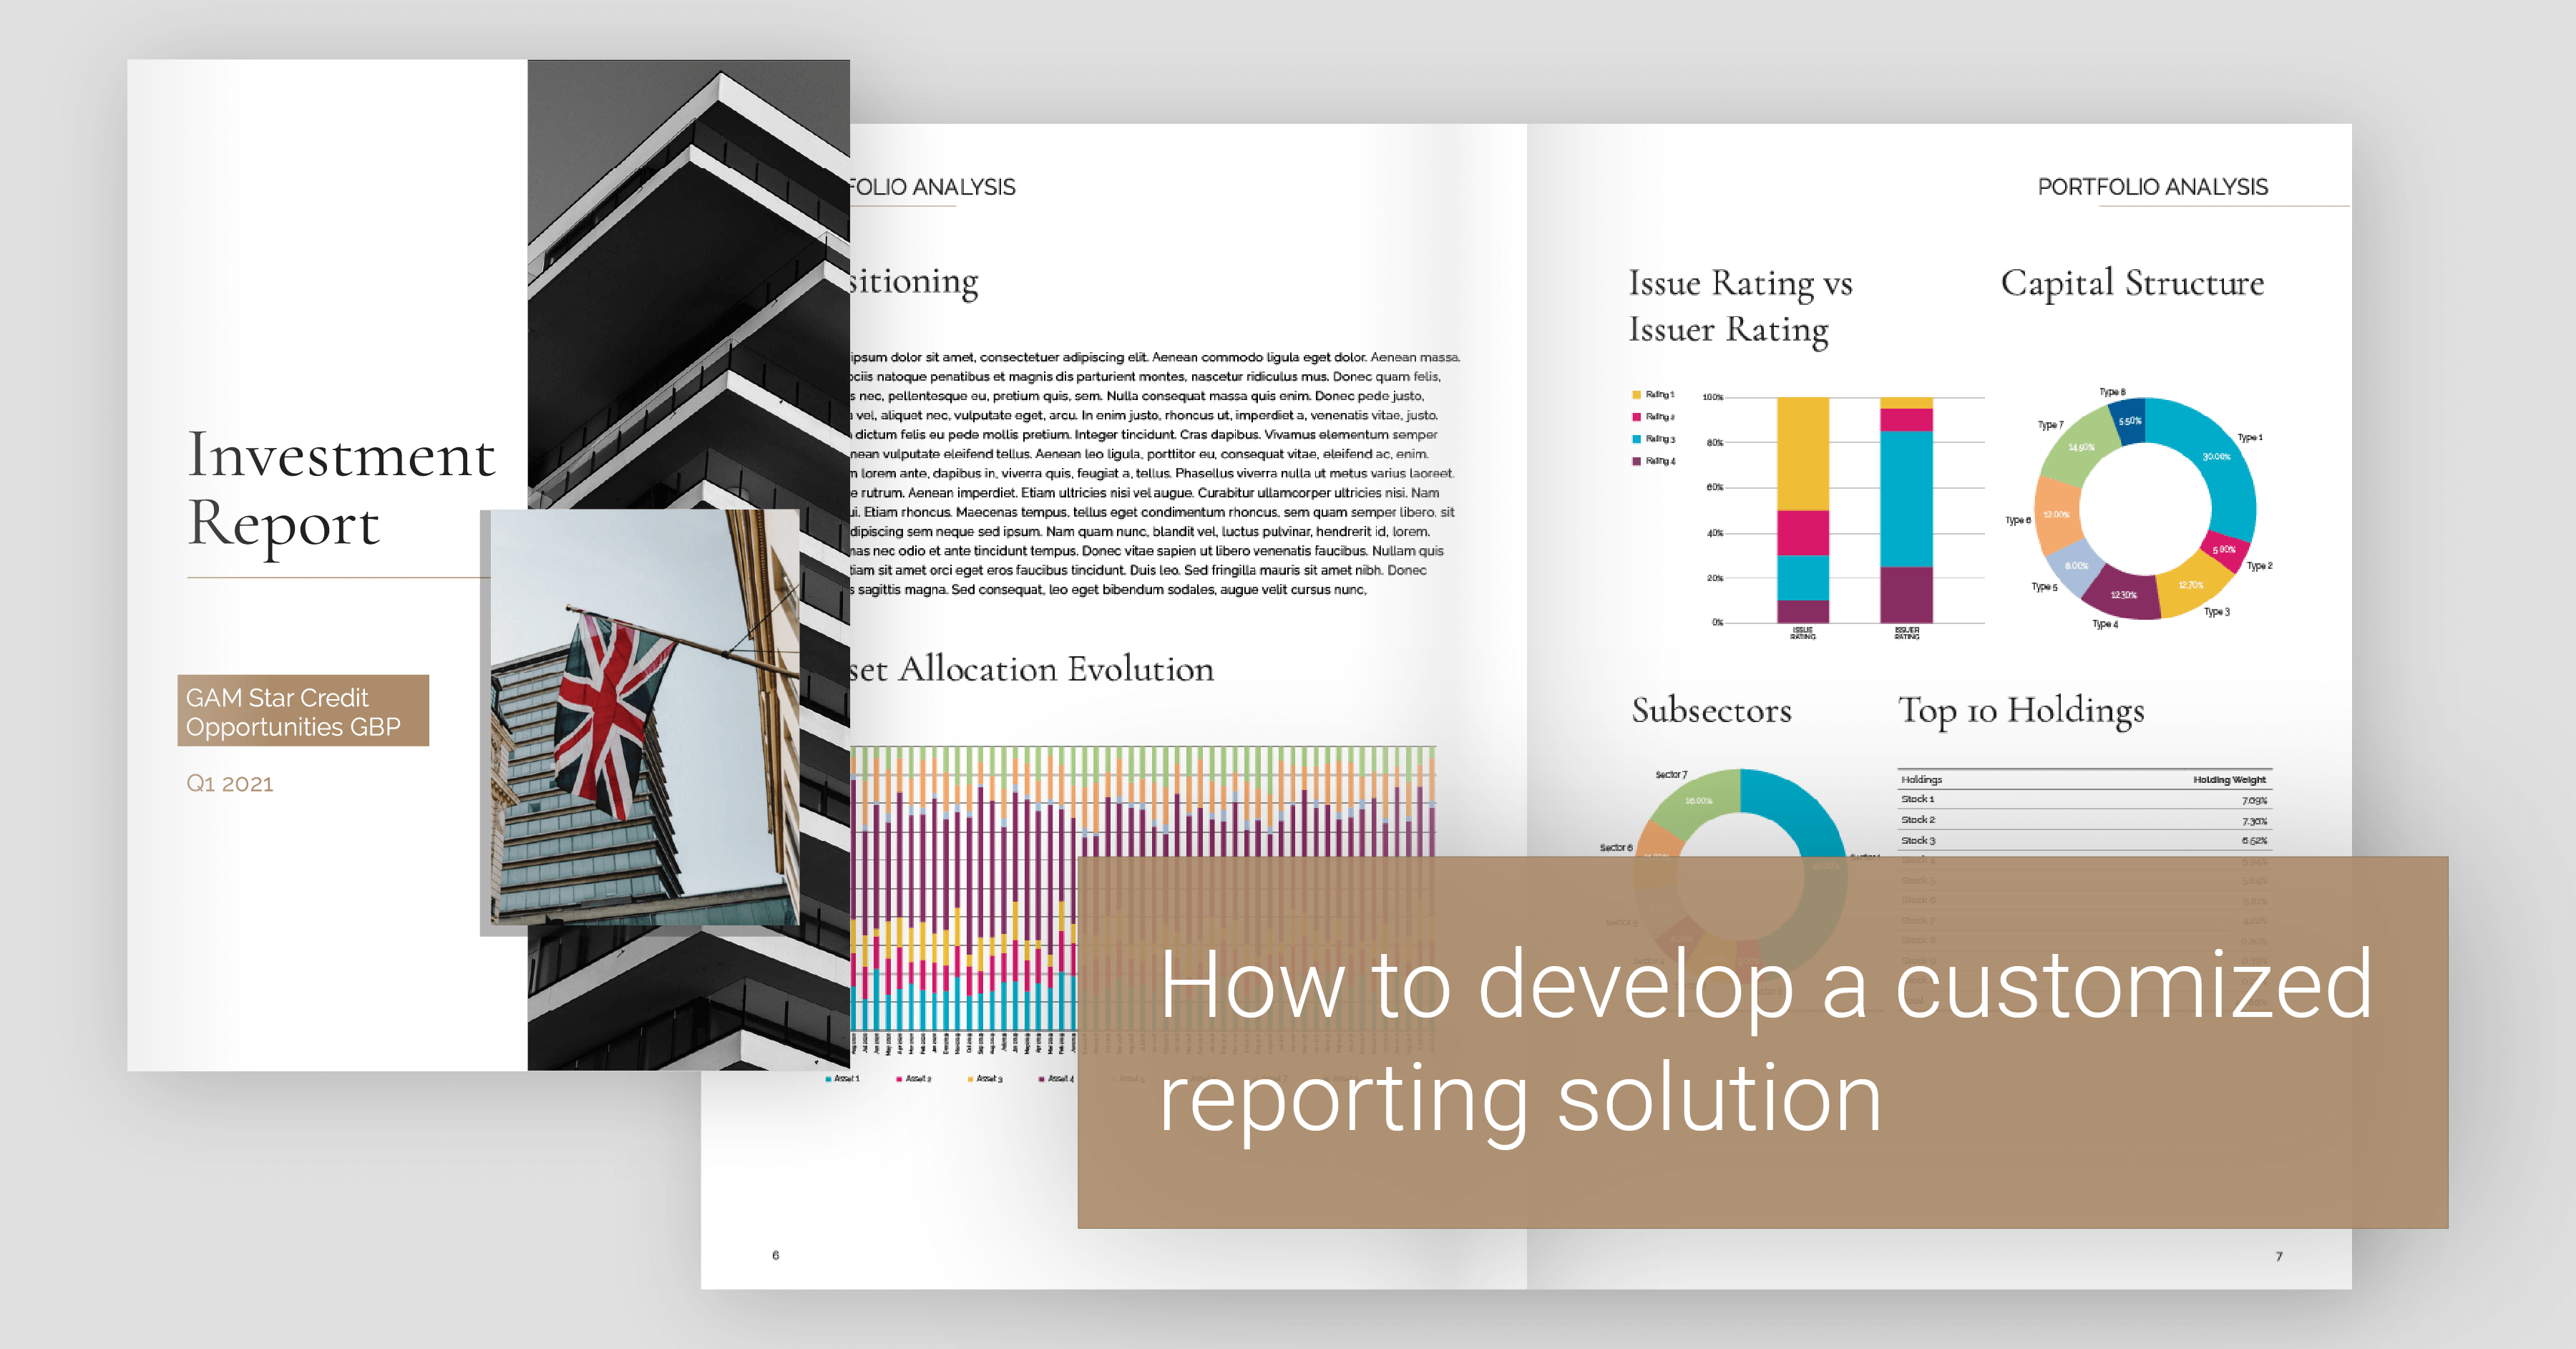
Armed with essential technical support from Datylon, Eye For Business was able to use its internal resources to create a suite of feature graphics, including quotes, tables and charts, which were exported to Datylon Report Studio. Customisable backgrounds were also added by using Datylon’s “Snippet” functionality. The result is an online repository of more than 1,200 graphics templates and 4,000 background images, including industry icons. The result is external writers of Eye For Business can choose almost 5 million combinations of templates and images, with limitless variations of text and data points.
Eye For Business has also applied a rigorous naming convention to all its templates and images, which enables authors to find the required template through Datylon’s dynamic search functionality. It takes an author less than 30 minutes to create the visual part of an article.

Craig Otter, the CEO of Eye For Business, happily attests that the solution implemented with Datylon would not have been feasible in any other way. “When we first started testing our content, we received negative feedback about our graphics. We learned to create customised graphics in Adobe, but it would take an average of two hours for each chart, and we could not delegate the task to an external writer, given the intricacies of the software. With Datylon, we were able to solve all our problems and reduce the time taken to less than 30 minutes for each graphic. This is a saving of almost an entire year’s work for a designer.”
Craig confirms that his business couldn't have done this without Datylon. He states that the product is unique in its quality output, price point and overall efficiency for a start-up company.
Result
The result is a consistent set of images that allows an appealing balance between visuals and text across all publications. In an age in which digital information is growing faster than our ability to absorb it, Craig says that Datylon’s graphics–especially a well-chosen quote with an impactful background “snippet”–can convey the essence of an article immediately.

Eye for Business and AI
Eye For Business uses AI tools in for different purposes in its content generation process. These take the form of engineered or structured prompt models that help to shape content at key stages – topic selection and refinement, research and the logical planning of an article. Prompt models are also used for a second edit (including a line-by-line review to remove generic or vague language), social media summaries and the creation of risk matrices from public risk disclosures. Conspicuously absent from the coverage of these models is the actual writing of articles. Craig says, “while AI is incredibly useful as an effective research assistant, our customers and we still regard business-critical analysis as a necessarily human-centred process. We know this after years of working with structure AI prompt models”.
Conclusion
Eye For Business is a valuable resource for companies seeking clarity on sustainability challenges. With its data-driven insights, expert guidance and a commitment to compliance, Eye For Business empowers businesses to make informed decisions and navigate the complexities of sustainability reporting.
Combining Eye For Business's deep understanding of sustainability and Datylon's powerful report design and production tools creates a final product that allows businesses to measure, track and communicate their sustainability performance effectively.