Black Pearl Analytics provides financial consultancy for businesses, asset managers, owners of corporate assets, and private wealth. It includes advisory services across a wide range of opportunities in the capital markets. While being a small company, Black Pearl Analytics works with large institutions. As an example, they work with a private equity manager with around 11 billion euros under management.
Challenge
One of the main parts of the company's activity is analysis and data visualization. The results of this activity are usually presented in the form of weekly or monthly reports or dashboards. Before using Datylon, Ben Edwards, a consultant at Black Pearl Analytics, primarily used the Adobe suite for producing long elements and graphical elements. The core issue for Ben was the charting capabilities of Adobe Illustrator. Particularly concerning was the process of scaling charts. The issues with Illustrator accelerated the transition to Datylon for data-driven charts.
Solution and implementation
After discovering Datylon for Illustrator, Ben noted two main advantages. The first was the way Datylon sets up chart creation with pre-populated data that guides the user, making it easier to start. The second element was the ability to rapidly standardize chart elements, like grid line weights and colors across all of the documents, as well as easily controlling font sizes and typefaces.
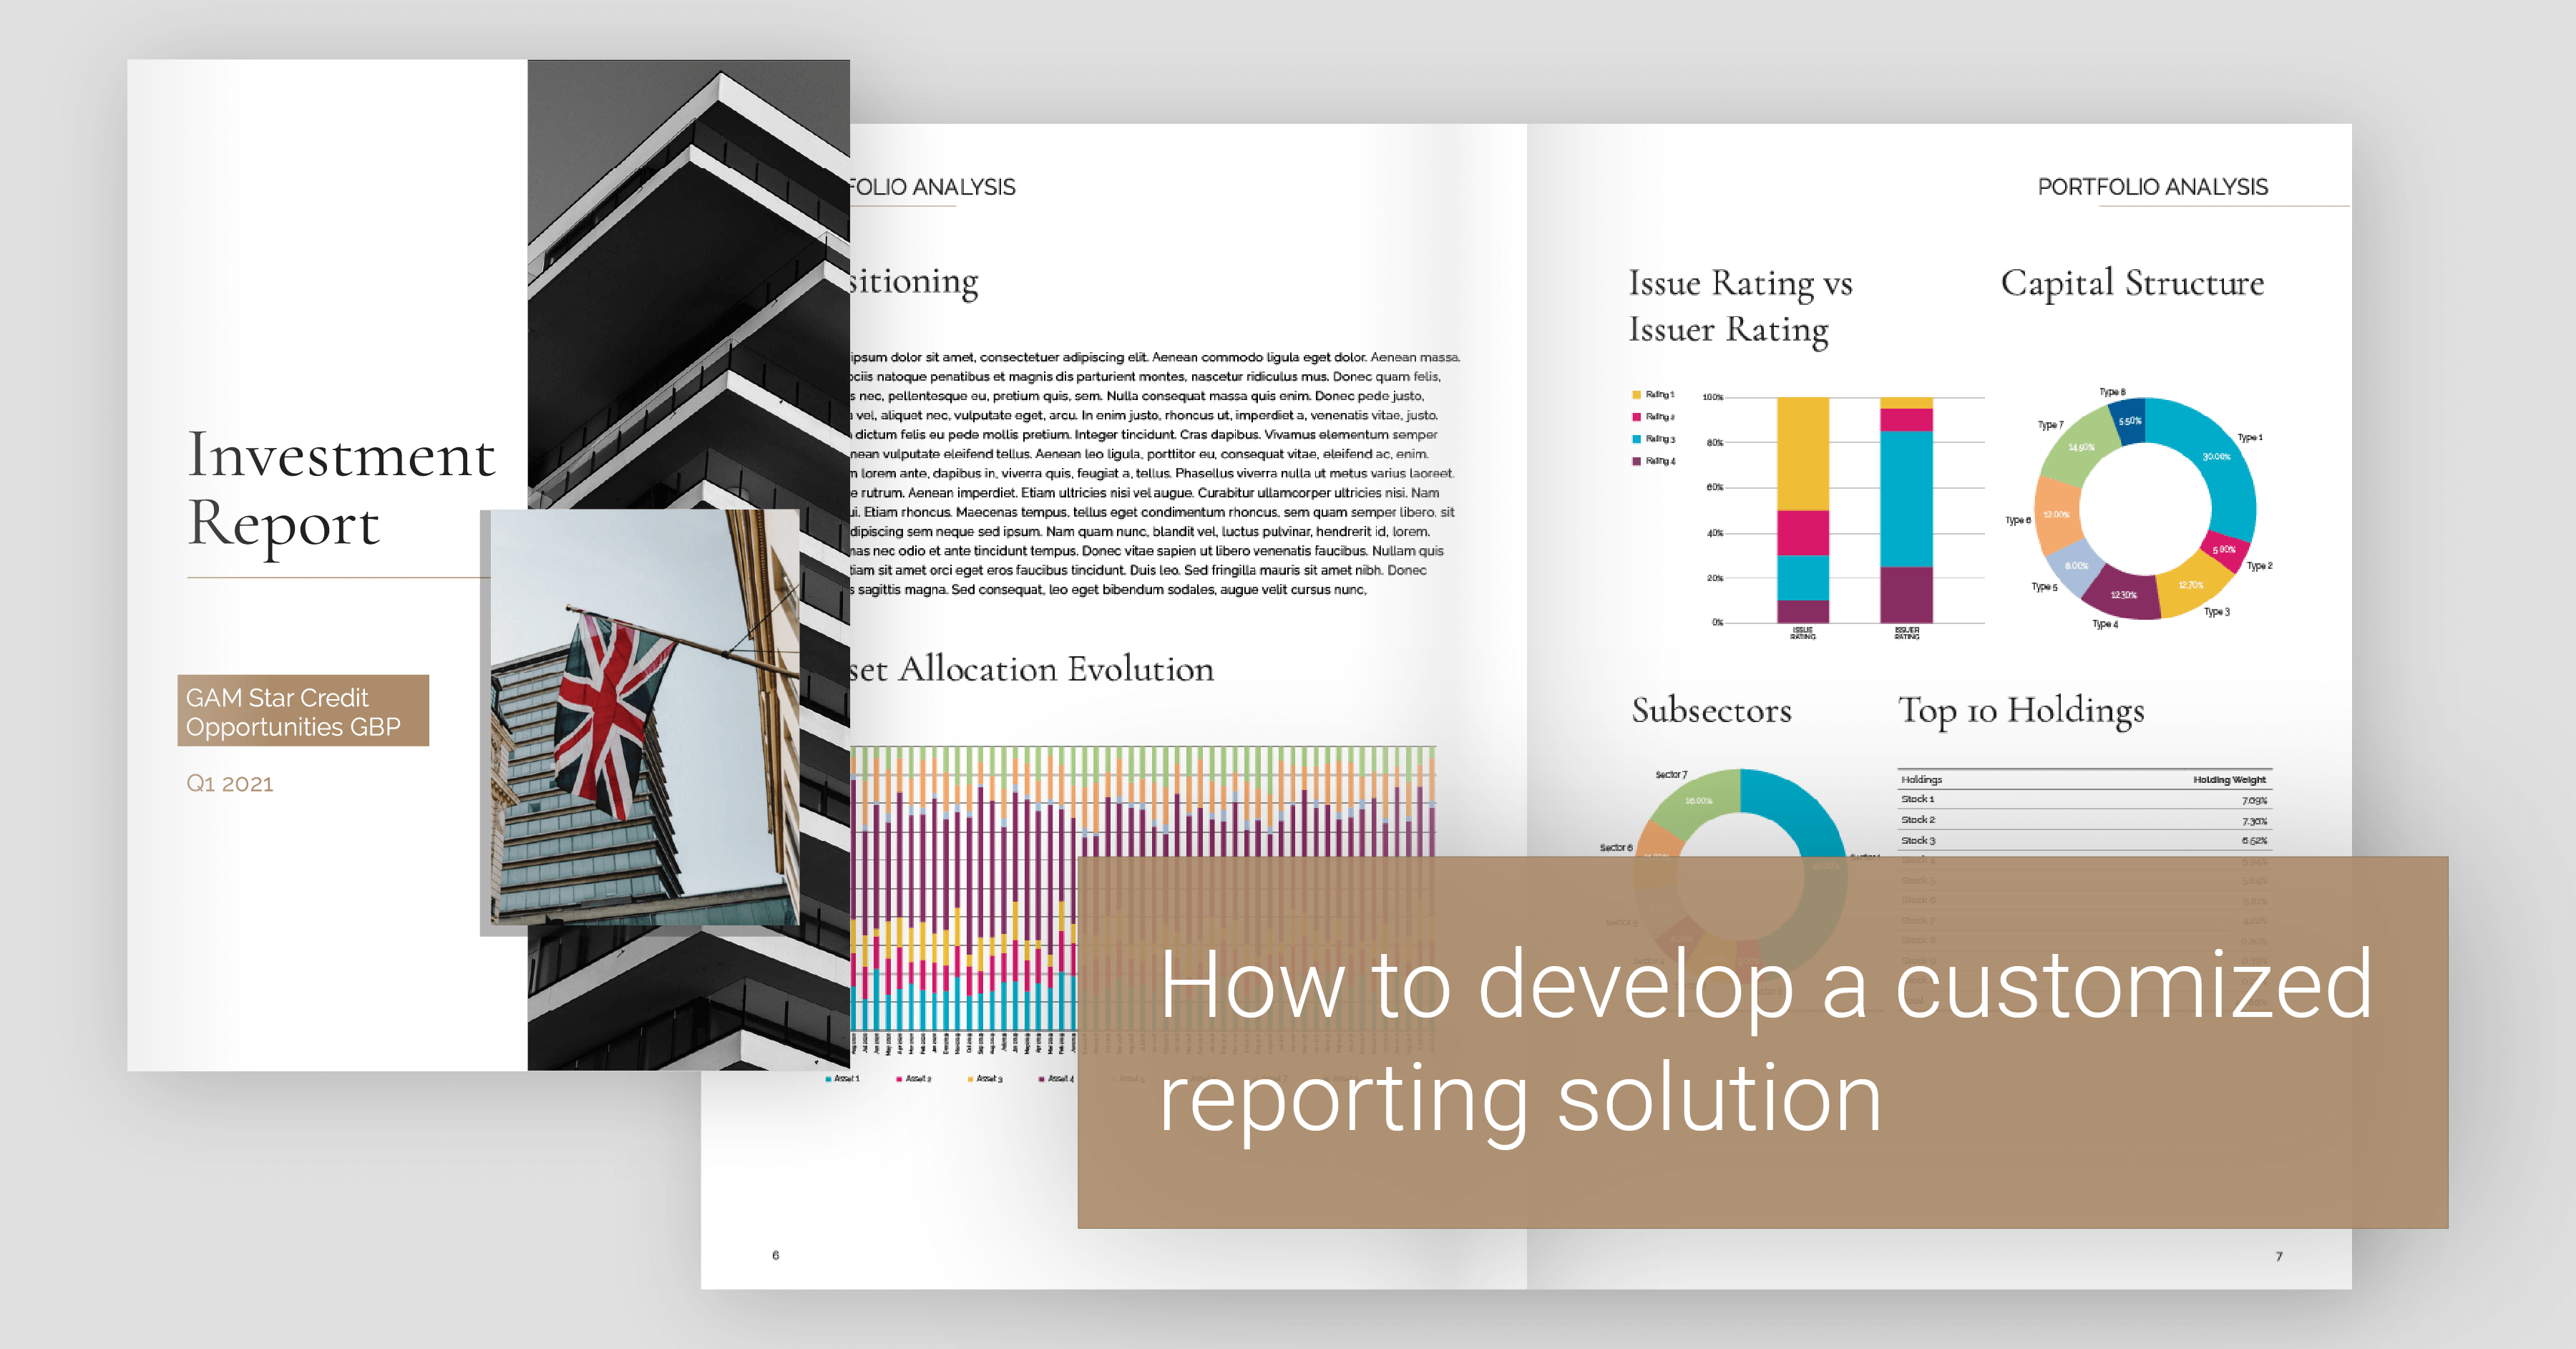
An example of dashboard made by Black Pearl Analytics using Datylon for Illustrator
The favorite Datylon feature was the ability to create one chart to the exact size needed, copy it, and then either input different data or have it read a different sheet, ensuring consistency when placed in a structured InDesign document. Ben enjoyed how the product spoke to him in the same language of detailed styling and standardized recurring chart production.
Result and Value
Datylon allowed Ben to save a significant amount of time. A monthly dashboard, containing nine or more charts would have taken Ben two days. When using Datylon, it takes only about an hour. Without Datylon, they would be unable to deliver the variety of reports they are currently producing in a cost- and time-efficient way. Currently, Ben is the only person who works on data visualization in the company. However, as the company anticipates the team will grow, the standardized templates workflow will speed up the creation and update process for junior staff.

An example of dashboard made by Black Pearl Analytics using Datylon for Illustrator
Conclusion
For the people who are considering Datylon, but still not sure, Ben would advise them that it is a better and effortless way to achieve high-quality and standardized charting, especially if they are currently using Illustrator or the Creative Suite but still relying on Excel for graphs.