
So a designer walks into a bar...
Okay, we're not that good at telling "bar" jokes. We'd much rather tell you all about this year's first product release which is mainly dedicated to the bar chart. We have added some new features which turn the Datylon Bar Chart into a multi-purpose and versatile chart type that can be used for even more complex visualizations and data stories.
But that's not all. We see that more and more users are discovering the benefits of the Datylon web app and they're creating charts online or reusing design templates made in Datylon for Illustrator just by uploading new data into it. To increase flexibility in use, we created the concept of snippets that allow you to add a template into another template. Read more about it below.
ADVANCED STYLING
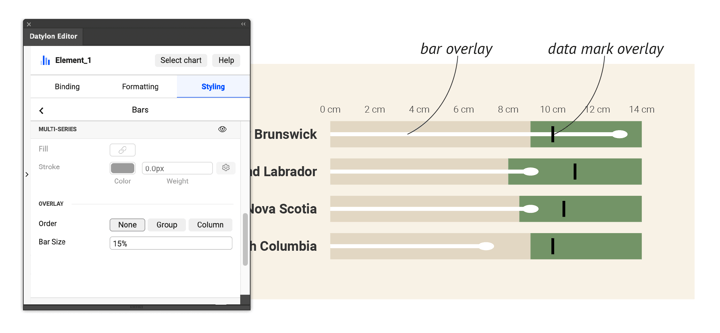
Overlaying bars and marks
Do you want to compare values in a bar or in a column chart but want to keep it compact? Or do you want to add one or more data marks on top of your bars? It's now possible with the new overlay feature in the Datylon chart maker. Learn more about the new overlay features.
ADVANCED STYLING
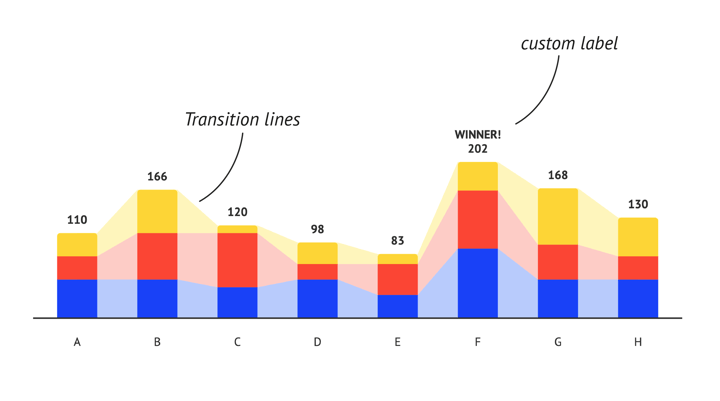
Enrich your bar chart design
In stacked bars, subtle value changes between categories are sometimes difficult to spot. Transition lines or areas between the bars help to perceive those oven minor differences. We also added the option to bind any column/row of data to a bar label. This is particularly useful for adding totals labels to a stacked bar or other data-driven custom labels. Learn more on our bar chart properties page.
ADVANCED STYLING
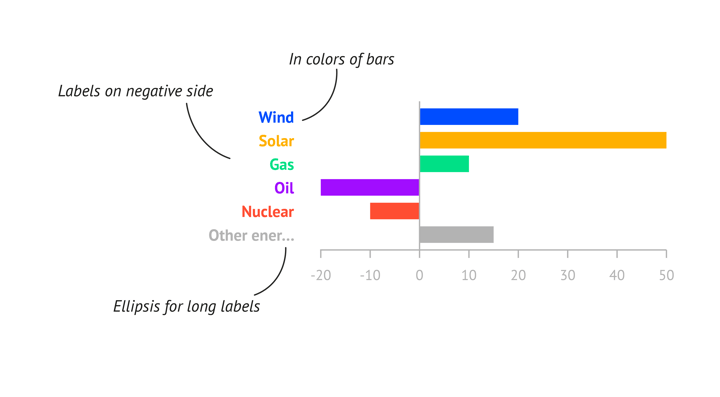
Extra label options for better readability
We added a few extra options to optimize your labels. For numerical axis labels of a Bar chart, it's now possible to position the labels at the end of the negative side. See more here. Also, if the distance between the labels and the bars becomes too high or you just want to highlight the labels, the category axis label colors can now easily be linked to the bar colors. Learn more here. And finally, labels that contain a long string of text that does not fit within the paragraph width, an ellipsis is shown at the end if enabled. This option is available for any label, in any chart. Read more here.
RE-USE & COLLABORATE
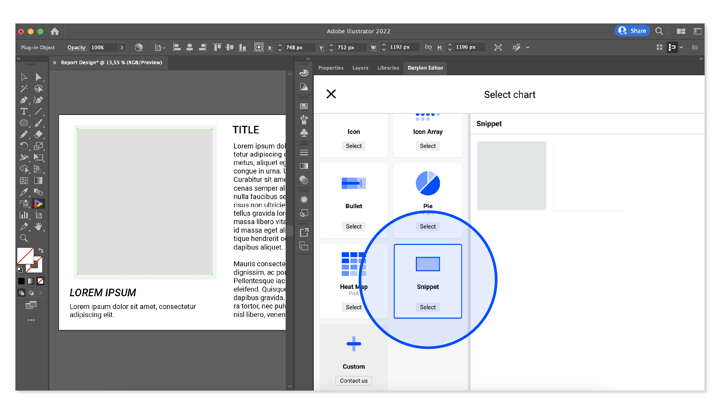
Snippets for use with Datylon web app
Datylon’s web app is designed to easily reuse and share data visualizations. Designers first create and upload on-brand and pixel-perfect templates with Datylon for Illustrator. Co-workers then re-use these templates online by linking new data. We created a new chart type "Snippet", which isn't really a chart but a placeholder for online users to combine different templates together by loading other templates in these snippets. This allows web app users to create a wide variety of beautifully designed data visualizations. Discover new snippets and learn how to use them in Datylon.
But that's not even all! We also added some new features to the bubble chart and made a few small fixes to improve your design experience. Don't miss on what's new and read more in detail about the new update in the R49 release notes in the Datylon Help Center.
Don't forget to download the latest version of Datylon for Illustrator and check out what's new in the Datylon web app!
Enjoy designing! 🎨