Datylon
  • Solutions
    • Chart Design
    • Report Design
    • Automated Reporting
    • ESG Report Publishing
    • Embedded Reporting
    • Bespoke Dataviz Solutions
    • Datylon Foundry - Software Services
  • Products
    • Datylon for Illustrator
    • Datylon Report Studio
    • Datylon for PowerPoint
    • Datylon ChartRunner
    • Datylon Report Server
  • Pricing
  • Resources
    • Help Center
    • Inspiration
    • Chart Library
    • Blog
    • Customer Stories
    • FAQ
  • Contact us
Sign in
Explore free options
Blog> Product News

What's new in Release 48

Kosma Hess - Marketing Manager
December 16, 2021
SHARE

Datylon for Illustrator plugin & Datylon online chart maker new version R48 - now with a treemap graph / treemap chart and new arrows for a range chart to make a better arrow chart

The end of the year is approaching very soon. Although some of us at Datylon are still busy decorating our houses and getting last-minute presents for our significant others, we're still pretty busy working on improvements to our Datylon chart maker.

And whether you celebrate Christmas or not, we also got YOU something! Who would say 'no' to presents? ๐ŸŽ

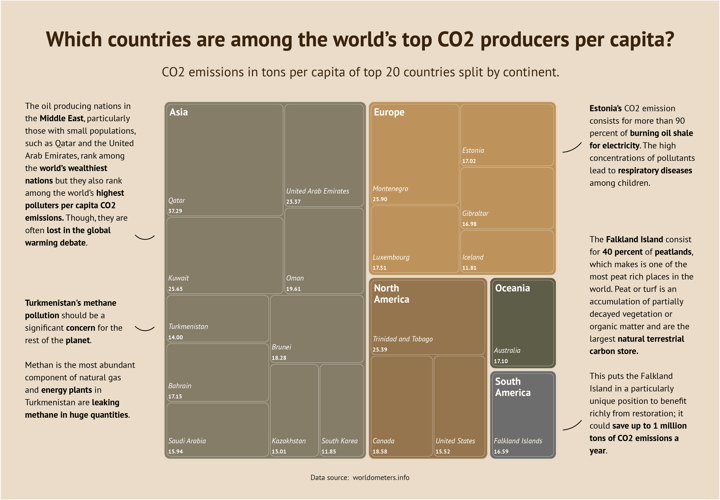
For this final product update, we did something BIG. The newest version of Datylon (R48) contains now a TREEMAP! Read more about it below.

Download Datylon for Illustrator now or sign in to the Datylon web app and enjoy the new version of the most advanced chart maker!


CHART LIBRARY

Datylon Treemap, at your service!

We asked and the people have spoken. Treemap has been a chart type topping many usersโ€™ wishlists. And we can't be any happier to announce that it is now the newest addition to the Datylon chart library! If you need to visualize quantities in a hierarchical structure, and yet in a compact way, the Datylon Treemap is your ally. Just select the Treemap in the Datylon editor, choose one of the defaults, add your data, and design the treemap using the many coloring and styling options available. Create your treemap chart with Datylon.

If you need to visualize quantities in a hierarchical structure, and yet in a compact way, the Datylon Treemap is your ally. Just select the Treemap in the Datylon editor, choose one of the defaults, add your data, and design the treemap using the many coloring and styling options available.


ADVANCED STYLING

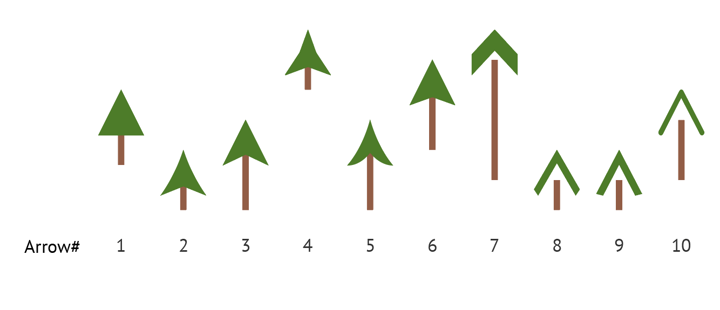
Point the way with the Datylon Range chart

Our Range chart serves as the basis for an Arrow chart and is therefore extended with a wider choice of arrowheads. Use the arrowhead which matches best with your personal styling and brand. Here you can find more information about the Datylon Range chart properties. Any resemblance of the design below to Christmas trees is purely coincidental ๐Ÿ˜‰. Read more about how to make an arrow chart.

New arrowheads for arrow chart in Datylon


Stay tuned as we will publish more information about the treemap soon. In the meantime, find some nice treemap samples on our Inspiration page for you to use online or in Datylon for Illustrator. More info about the Datylon treemap properties and how to apply them can be found here. 

You can also read more in detail about all of the newest improvements in the R48 release notes in the Datylon Help Center. 

Don't forget to download the latest version of Datylon for Illustrator to benefit from all these fixes and the new treemap chart! Alternatively, you can also try them out in our Datylon web app. 

Happy holidays ๐Ÿ˜‰ 

Kosma Hess - Marketing Manager

Kosma Hess - Marketing Manager

Global citizen, world traveler, content creator, marketing specialist, can't sing to save his life. In his free time, he's mastering Datylon for Illustrator for no reason.

Related blog posts

Datylon Chart Maker Product Update R49 - What's new? Snippets, new label features, improved bar chart
Product News

What's new in Release 49

So a designer walks into a bar...

Okay, we're not that good at telling "bar" jokes. We'd much...

Read more
Datylon Product Update R43 - What's new?
Product News

What's new in Release 43

First of all, we wish you a healthy and inspiring 2021! Let's hope that we can soon go back to our...

Read more

Subscribe to our newsletter

Receive inspiration, practical advice, customer stories and news right in your mailbox.

Newsletter
Company
  • About us
  • Jobs
  • Contact us
  • Data security
  • Datylon reviews
Solutions
  • Embedded Reporting
  • Automated Reporting
  • Chart Design
  • Report Design
  • ESG Reporting
  • Bespoke Solutions
  • Development Services
Product
  • Datylon Report Studio
  • Datylon Report Server
  • Datylon for Illustrator
  • Datylon ChartRunner
  • Datylon for PowerPoint
  • Datylon Enterprise
  • Pricing
  • Free trial
  • Release notes
Resources
  • Chart library
  • Inspiration
  • Blog
  • Customer stories
  • FAQ
  • Help center
  • Video tutorials
Create
  • Area chart
  • Bar chart
  • Bubble chart
  • Bullet chart
  • Density plot
  • Dot plot
  • Heatmap
  • Histogram
  • Icon array
  • Icon chart
  • Line chart
  • Pie chart
  • Range plot
  • Scatter plot
  • Stream graph
  • Treemap
Learn
  • Tips for report design
  • Do you speak data?
  • Do you speak dataviz?
  • Effective dataviz guide
  • 80 types of charts
  • 9 types of dataviz
  • Best dataviz tools
  • Charts for colorblind
  • Accessible charts
  • Break the rules
  • Dataviz in Illustrator
  • Datylon vs. Illustrator
  • Static or interactive?
  • Outside the box charts
  • Mind your dataviz
  • Data storytelling

All rights reserved. ยฉ 2025 Datylon BV

  • Legal Terms
  • Privacy Policy

Manage Cookies