Datylon
  • Solutions
    • Chart Design
    • Report Design
    • Automated Reporting
    • ESG Report Publishing
    • Embedded Reporting
    • Bespoke Dataviz Solutions
    • Datylon Foundry - Software Services
  • Products
    • Datylon for Illustrator
    • Datylon Report Studio
    • Datylon for PowerPoint
    • Datylon ChartRunner
    • Datylon Report Server
  • Pricing
  • Resources
    • Help Center
    • Inspiration
    • Chart Library
    • Blog
    • Customer Stories
    • FAQ
  • Contact us
Sign in
Explore free options
Blog> Product News

What's new in Release 37

Stijn Simoens - Co-founder & Head of Customer Success
March 20, 2020
SHARE

It's time for some nice additional color features in our platform to give you even more choice and freedom of design.

New color features and data-driven coloring

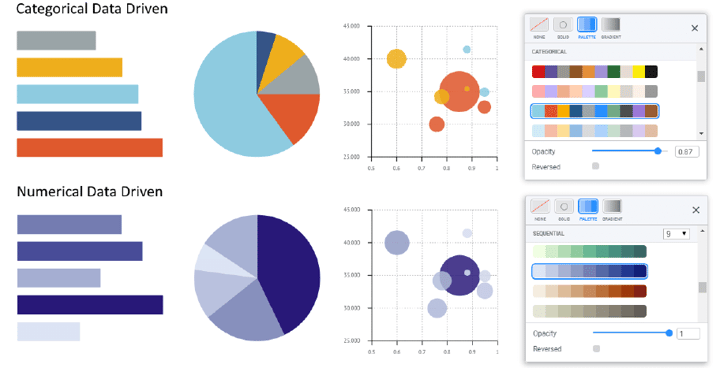
  • Color your bars, pie slices, scatter data marks, heatmaps and icon arrays, using our renewed palette picker;
  • They now also include custom palettes, categorical, continuous sequential, diverging and categorical equal weight palettes even in reversed order; and
  • You can select single color swatches from a palette, within our solid color picker and gradient fill.


Datylon launches new color features and data-driven coloring


Discover more about our data driven styling features or read the specific Datylon User Guide on this topic.


Helping you to organize your data more easily

You can now rename and reorder workbooks. And don't forget you can link to data provided by others in your team via the Datylon web app.


We continue our mission

With your feedback, you can help us fulfill our mission. Don’t hesitate to reach out and talk to us on Twitter, via chat or email.

Your #chartsmatter, #staysafe and keep designing !


Stijn Simoens - Co-founder & Head of Customer Success

Stijn Simoens - Co-founder & Head of Customer Success

The Datylon user group is a rapidly growing community and Stijn is striving for Datylon's customers success. Need help? Talk to Stijn.

Related blog posts

Inspiration samples can be downloaded as template for your own designs
Product News

What's new in Release 40

We are happy to announce once again a new release of Datylon. With very good news for those users...

Read more
Datylon release R42 provides new features that speed up your chart design
Product News

What's new in Release 42

Here at Datylon, we are working flat-out to make our chart maker the perfect home for your chart...

Read more

Subscribe to our newsletter

Receive inspiration, practical advice, customer stories and news right in your mailbox.

Newsletter
Company
  • About us
  • Jobs
  • Contact us
  • Data security
  • Datylon reviews
Solutions
  • Embedded Reporting
  • Automated Reporting
  • Chart Design
  • Report Design
  • ESG Reporting
  • Bespoke Solutions
  • Software Services
Product
  • Datylon Report Studio
  • Datylon Report Server
  • Datylon for Illustrator
  • Datylon ChartRunner
  • Datylon for PowerPoint
  • Datylon Enterprise
  • Pricing
  • Free trial
  • Release notes
Resources
  • Chart library
  • Inspiration
  • Blog
  • Customer stories
  • FAQ
  • Help center
  • Video tutorials
Create
  • Area chart
  • Bar chart
  • Bubble chart
  • Bullet chart
  • Density plot
  • Dot plot
  • Heatmap
  • Histogram
  • Icon array
  • Icon chart
  • Line chart
  • Pie chart
  • Range plot
  • Scatter plot
  • Stream graph
  • Treemap
Learn
  • Tips for report design
  • Do you speak data?
  • Do you speak dataviz?
  • Effective dataviz guide
  • 80 types of charts
  • 9 types of dataviz
  • Best dataviz tools
  • Charts for colorblind
  • Accessible charts
  • Break the rules
  • Dataviz in Illustrator
  • Datylon vs. Illustrator
  • Static or interactive?
  • Outside the box charts
  • Mind your dataviz
  • Data storytelling

All rights reserved. © 2025 Datylon BV

  • Legal Terms
  • Privacy Policy

Manage Cookies