Datylon
  • Solutions
    • Chart Design
    • Report Design
    • Automated Reporting
    • ESG Report Publishing
    • Embedded Reporting
    • Bespoke Dataviz Solutions
    • Datylon Foundry - Software Services
  • Products
    • Datylon for Illustrator
    • Datylon Report Studio
    • Datylon for PowerPoint
    • Datylon ChartRunner
    • Datylon Report Server
  • Pricing
  • Resources
    • Help Center
    • Inspiration
    • Chart Library
    • Blog
    • Customer Stories
    • FAQ
  • Contact us
Sign in
Explore free options
Blog> Product News

What's new in Release 41

Stijn Simoens - Co-founder & Head of Customer Success
August 10, 2020
SHARE

Although we are in the middle of a hot summer at this side of the globe, we keep on working hard to improve the Datylon webapp en Illustrator plugin. Our mission is to make these the best ever charting tools for graphic & report designers. Take your chance to try it out! 


Connecting the dots. Or not.

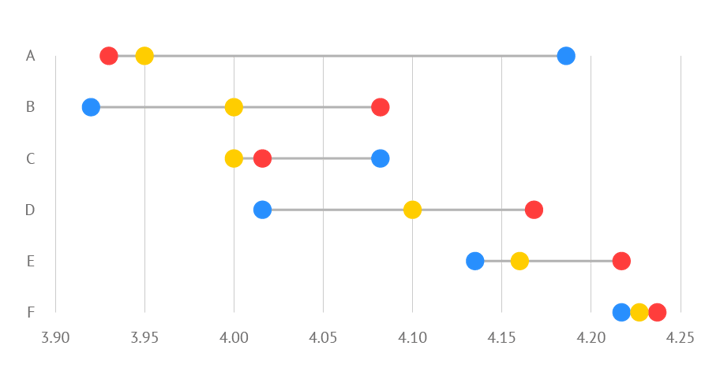
We are introducing the Datylon Dot plot. a.k.a. Dot chart, range plot, categorical scatter or connected dot plot, the Datylon Dot plot is an easy to read chart, visualizing two or more numerical values per category in a very space-efficient way. See more variations like a dumbbells chart on our Inspiration page.

Datylon dot plot or dot chart


Added loads of new default charts

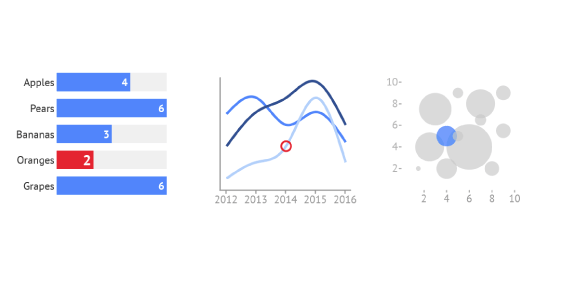
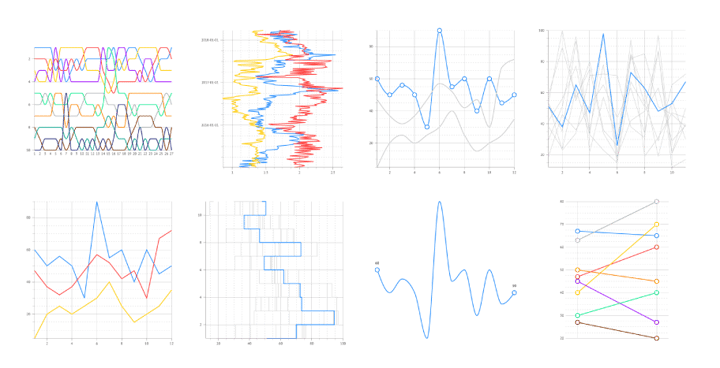
The Datylon chart editor now comes with a broad set of new defaults or chart templates for all chart types. This Datylon Chart Library provides a wealth of inspiration to create attractive and engaging charts. These defaults also demonstrate how standard chart types can be used to build many sophisticated variants.

New default charts in Datylon Chart Library


Free Plan Datylon online

Don't forget we created a Free Plan that includes all functionality of our web app. Cancel anytime. No credit card required. And let us know what you think about it. We are eager to learn from you. View our pricing plans or contact sales for more info.

Your #chartsmatter and enjoy designing! 😉 


Stijn Simoens - Co-founder & Head of Customer Success

Stijn Simoens - Co-founder & Head of Customer Success

The Datylon user group is a rapidly growing community and Stijn is striving for Datylon's customers success. Need help? Talk to Stijn.

Related blog posts

Datylon bullet chart, Datylon further develops data point styling
Product News

What's new in Release 38

We are happy to announce once again a new release of Datylon! This time we added the bullet chart...

Read more
Inspiration samples can be downloaded as template for your own designs
Product News

What's new in Release 40

We are happy to announce once again a new release of Datylon. With very good news for those users...

Read more

Subscribe to our newsletter

Receive inspiration, practical advice, customer stories and news right in your mailbox.

Newsletter
Company
  • About us
  • Jobs
  • Contact us
  • Data security
  • Datylon reviews
Solutions
  • Embedded Reporting
  • Automated Reporting
  • Chart Design
  • Report Design
  • ESG Reporting
  • Bespoke Solutions
  • Software Services
Product
  • Datylon Report Studio
  • Datylon Report Server
  • Datylon for Illustrator
  • Datylon ChartRunner
  • Datylon for PowerPoint
  • Datylon Enterprise
  • Pricing
  • Free trial
  • Release notes
Resources
  • Chart library
  • Inspiration
  • Blog
  • Customer stories
  • FAQ
  • Help center
  • Video tutorials
Create
  • Area chart
  • Bar chart
  • Bubble chart
  • Bullet chart
  • Density plot
  • Dot plot
  • Heatmap
  • Histogram
  • Icon array
  • Icon chart
  • Line chart
  • Pie chart
  • Range plot
  • Scatter plot
  • Stream graph
  • Treemap
Learn
  • Tips for report design
  • Do you speak data?
  • Do you speak dataviz?
  • Effective dataviz guide
  • 80 types of charts
  • 9 types of dataviz
  • Best dataviz tools
  • Charts for colorblind
  • Accessible charts
  • Break the rules
  • Dataviz in Illustrator
  • Datylon vs. Illustrator
  • Static or interactive?
  • Outside the box charts
  • Mind your dataviz
  • Data storytelling

All rights reserved. © 2025 Datylon BV

  • Legal Terms
  • Privacy Policy

Manage Cookies