Datylon
  • Solutions
    • Embedded Reporting
    • Automated Reporting
    • Chart Design
    • Report Design
  • Product
    • Datylon for Illustrator
    • Datylon for PowerPoint
    • Datylon Report Studio
    • Datylon Report Server
  • Pricing
  • Projects
  • Resources
    • Chart Library
    • Inspiration
    • Blog
    • Customer Stories
    • FAQ
    • Help Center
  • About us
    • Why Datylon
    • Jobs
Sign in
Get started
Blog> Product News

What's new in Release 38

Stijn Simoens - Partner & Head of Customer Success
April 21, 2020
SHARE

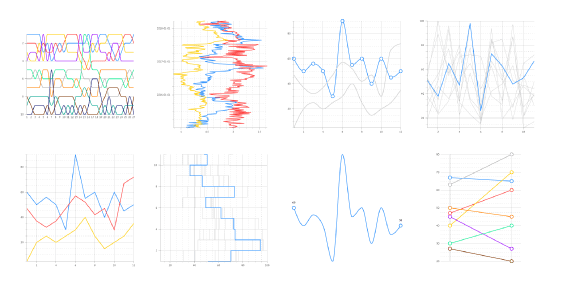
We are happy to announce once again a new release of Datylon! This time we added the bullet chart in our gradually expanding chart library. We also optimized our font selector and created our own data point styling.

New chart: bullet chart

Bullet charts have proven to be very useful for many different purposes ranging from financial reports, industrial dashboards to business performance benchmarks. Yes, we love this chart as much as you do! ❤️

Datylon bullet chart

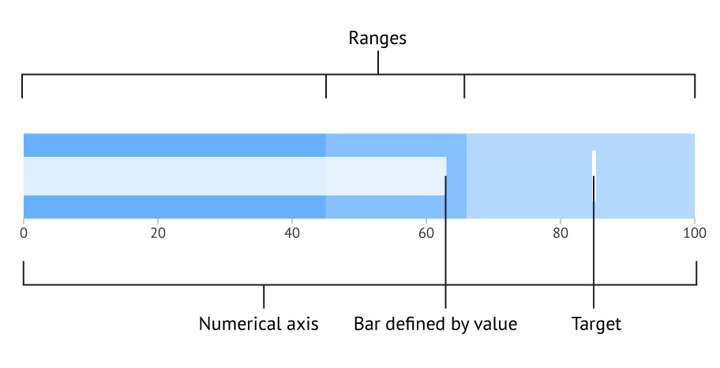
You can download some sample bullet chart Illustrator files from our inspiration area. You can find more info on how to create a bullet chart in the specific Bar Chart User Guide. 


Enjoy using our optimized font selector

Datylon is known to support more fonts than others, and we continue to work on extending that list. With our optimized font selector it’s now faster and easier to switch between fonts and find the right match.


Here's our very own data point styling! 

Emphasize a specific value or highlight a distinct topic in your chart by styling one or more particular data points, or dim out others.

Datylon further develops data point styling

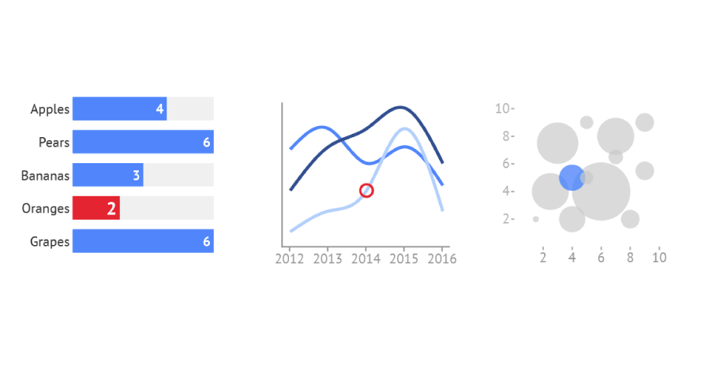
Hungry for more info on how to style data points with Datylon, consult our User Guide on data point styling.


We continue our mission

With your feedback, you can help us fulfill our mission. Don’t hesitate to reach out and talk to us on Twitter, via chat or email.

Your #chartsmatter #staysafe and keep designing !


Stijn Simoens - Partner & Head of Customer Success

The Datylon user group is a rapidly growing community and Stijn is striving for Datylon's customers success. Need help? Talk to Stijn.

Related blog posts

Datylon release R42 provides new features that speed up your chart design
Product News

What's new in Release 42

Here at Datylon, we are working flat-out to make our chart maker the perfect home for your chart...

Read more
New default charts in Datylon Chart Library
Product News

What's new in Release 41

Although we are in the middle of a hot summer at this side of the globe, we keep on working hard to...

Read more

Subscribe to our newsletter

Receive inspiration, practical advice, customer stories and news right in your mailbox.

Newsletter
Company
  • About us
  • Projects
  • Jobs
  • Contact us
  • Data security
  • Datylon reviews
Solutions
  • Embedded Reporting
  • Automated Reporting
  • Chart Design
  • Report Design
Product
  • Datylon Report Studio
  • Datylon Report Server
  • Datylon for Illustrator
  • Datylon for PowerPoint
  • Datylon Enterprise
  • Pricing
  • Free trial
  • Release notes
Resources
  • Chart library
  • Inspiration
  • Blog
  • Customer stories
  • FAQ
  • Help center
  • Video tutorials
Create
  • Area chart
  • Bar chart
  • Bubble chart
  • Bullet chart
  • Density plot
  • Dot plot
  • Heatmap
  • Histogram
  • Icon array
  • Icon chart
  • Line chart
  • Pie chart
  • Range plot
  • Scatter plot
  • Stream graph
  • Treemap
Learn
  • Tips for report design
  • Do you speak data?
  • Do you speak dataviz?
  • Effective dataviz guide
  • 80 types of charts
  • 9 types of dataviz
  • Best dataviz tools
  • Charts for colorblind
  • Accessible charts
  • Break the rules
  • Dataviz in Illustrator
  • Datylon vs. Illustrator
  • Static or interactive?
  • Outside the box charts
  • Mind your dataviz
  • Data storytelling

All rights reserved. © 2023 Datylon BV

  • Legal Terms
  • Privacy Policy

Manage Cookies