Datylon
  • Solutions
    • Chart Design
    • Report Design
    • Automated Reporting
    • ESG Report Publishing
    • Embedded Reporting
    • Bespoke Dataviz Solutions
    • Datylon Foundry - Software Services
  • Products
    • Datylon for Illustrator
    • Datylon Report Studio
    • Datylon for PowerPoint
    • Datylon ChartRunner
    • Datylon Report Server
  • Pricing
  • Resources
    • Help Center
    • Inspiration
    • Chart Library
    • Blog
    • Customer Stories
    • FAQ
  • Contact us
Sign in
Explore free options
Blog> Product News

What's new in Release 51

SHARE

Datylon chart maker - new release 51

Today we released yet another Datylon version packed with improvements and new features on different levels: from new styling features to enabling to buy multiple licenses of Datylon for Illustrator. Furthermore, we worked on Datylon Server, our ever more popular solution to automate the production of charts and reports. Keep reading to discover what's new in version R51!

Download Datylon for Illustrator now or sign in to the Datylon web app and enjoy the new version of the most advanced chart maker!


TEXT STYLING OPTIONS

Better readability & more elegant labels

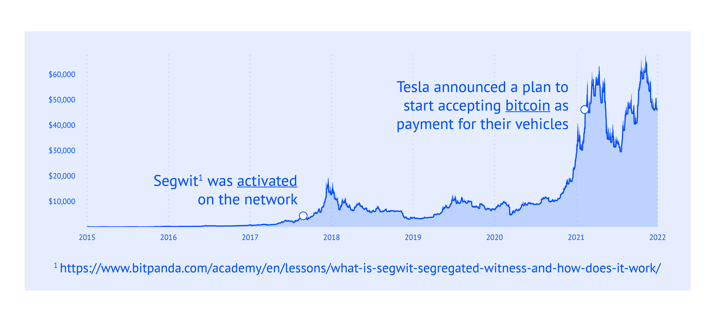
Sometimes you find yourself wanting to add footnote numbers to labels. Or underline words, or add a forced return to your chart label. All of it (and more to come!) is now possible with the new text styling options in both Datylon for Illustrator & Datylon web app. You can style the labels using ^markup symbols^ - both in static labels and in the data itself. _Woah!_

datylon-product-update-r51-markup-symbols-underlinedLearn more →


ADVANCED STYLING OPTIONS

Think globally, act locally

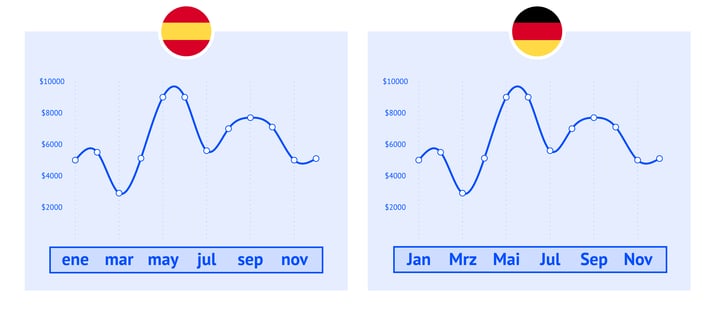
Avoid Babylonian confusion and create your charts and reports in your local language. With this release, you now have a choice from 31 different locale settings to format datetime labels.

datylon-product-update-r51-localeRead more →


DESIGNER PLAN

The more the merrier

As of now, it is possible to purchase one or more subscriptions online for someone else. In the Datylon web app, you can view and manage your subscriptions, and assign license keys to yourself and to your co-workers.

datylon-product-update-r51-multiple-seatsRead more about how to assign seats →


DATYLON SERVER

Datylon Server update

Datylon server now accepts a "visible" chart property within a JSON data file. This new feature allows you to automatically hide or unhide charts by means of the data feed. This gives you more flexibility for automated reports e.g. visualizing different chart types depending on the number of categories in your data set.

datylon-product-update-r51-datylon-serverLearn more →


But there is more. We also added more data management options and improved the process of exporting artboards to the Datylon web app. Some other functionalities were also implemented - we recommend you read more in detail about them in the R51 release notes in the Datylon Help Center.

Don't forget to download the latest version of Datylon for Illustrator.

Is there a feature missing from Datylon? Use this link and request it now, so we can try to make it happen for the next release!

Related blog posts

datylon-product-update-r55-overview-image-536x281
Product News

What's new in Release 55

With this small release, we have focused our efforts on refining your experience, ensuring...

Read more
The header of the blog shows a logo of Datylon with an icon symbolizing the process of updating. The text in the image reads
Product News

What's new in Release 53

Just saying hello with a small, yet significant update that you should definitely know about....

Read more

Subscribe to our newsletter

Receive inspiration, practical advice, customer stories and news right in your mailbox.

Newsletter
Company
  • About us
  • Jobs
  • Contact us
  • Data security
  • Datylon reviews
Solutions
  • Embedded Reporting
  • Automated Reporting
  • Chart Design
  • Report Design
  • ESG Reporting
  • Bespoke Solutions
  • Development Services
Product
  • Datylon Report Studio
  • Datylon Report Server
  • Datylon for Illustrator
  • Datylon ChartRunner
  • Datylon for PowerPoint
  • Datylon Enterprise
  • Pricing
  • Free trial
  • Release notes
Resources
  • Chart library
  • Inspiration
  • Blog
  • Customer stories
  • FAQ
  • Help center
  • Video tutorials
Create
  • Area chart
  • Bar chart
  • Bubble chart
  • Bullet chart
  • Density plot
  • Dot plot
  • Heatmap
  • Histogram
  • Icon array
  • Icon chart
  • Line chart
  • Pie chart
  • Range plot
  • Scatter plot
  • Stream graph
  • Treemap
Learn
  • Tips for report design
  • Do you speak data?
  • Do you speak dataviz?
  • Effective dataviz guide
  • 80 types of charts
  • 9 types of dataviz
  • Best dataviz tools
  • Charts for colorblind
  • Accessible charts
  • Break the rules
  • Dataviz in Illustrator
  • Datylon vs. Illustrator
  • Static or interactive?
  • Outside the box charts
  • Mind your dataviz
  • Data storytelling

All rights reserved. © 2025 Datylon BV

  • Legal Terms
  • Privacy Policy

Manage Cookies