Happy New Year! 🎉 We hope this year is full of great health and happiness. Until then, cheers to you from afar while we enter 2023 with a new product release! In case you missed it, we've been pretty busy last year. And to make sure we can guarantee you the best dataviz capabilities, we spent the last few weeks pimping and tweaking Datylon, adding new features, and eliminating bugs. Make sure to check out what's new.
DATYLON CHART LIBRARY
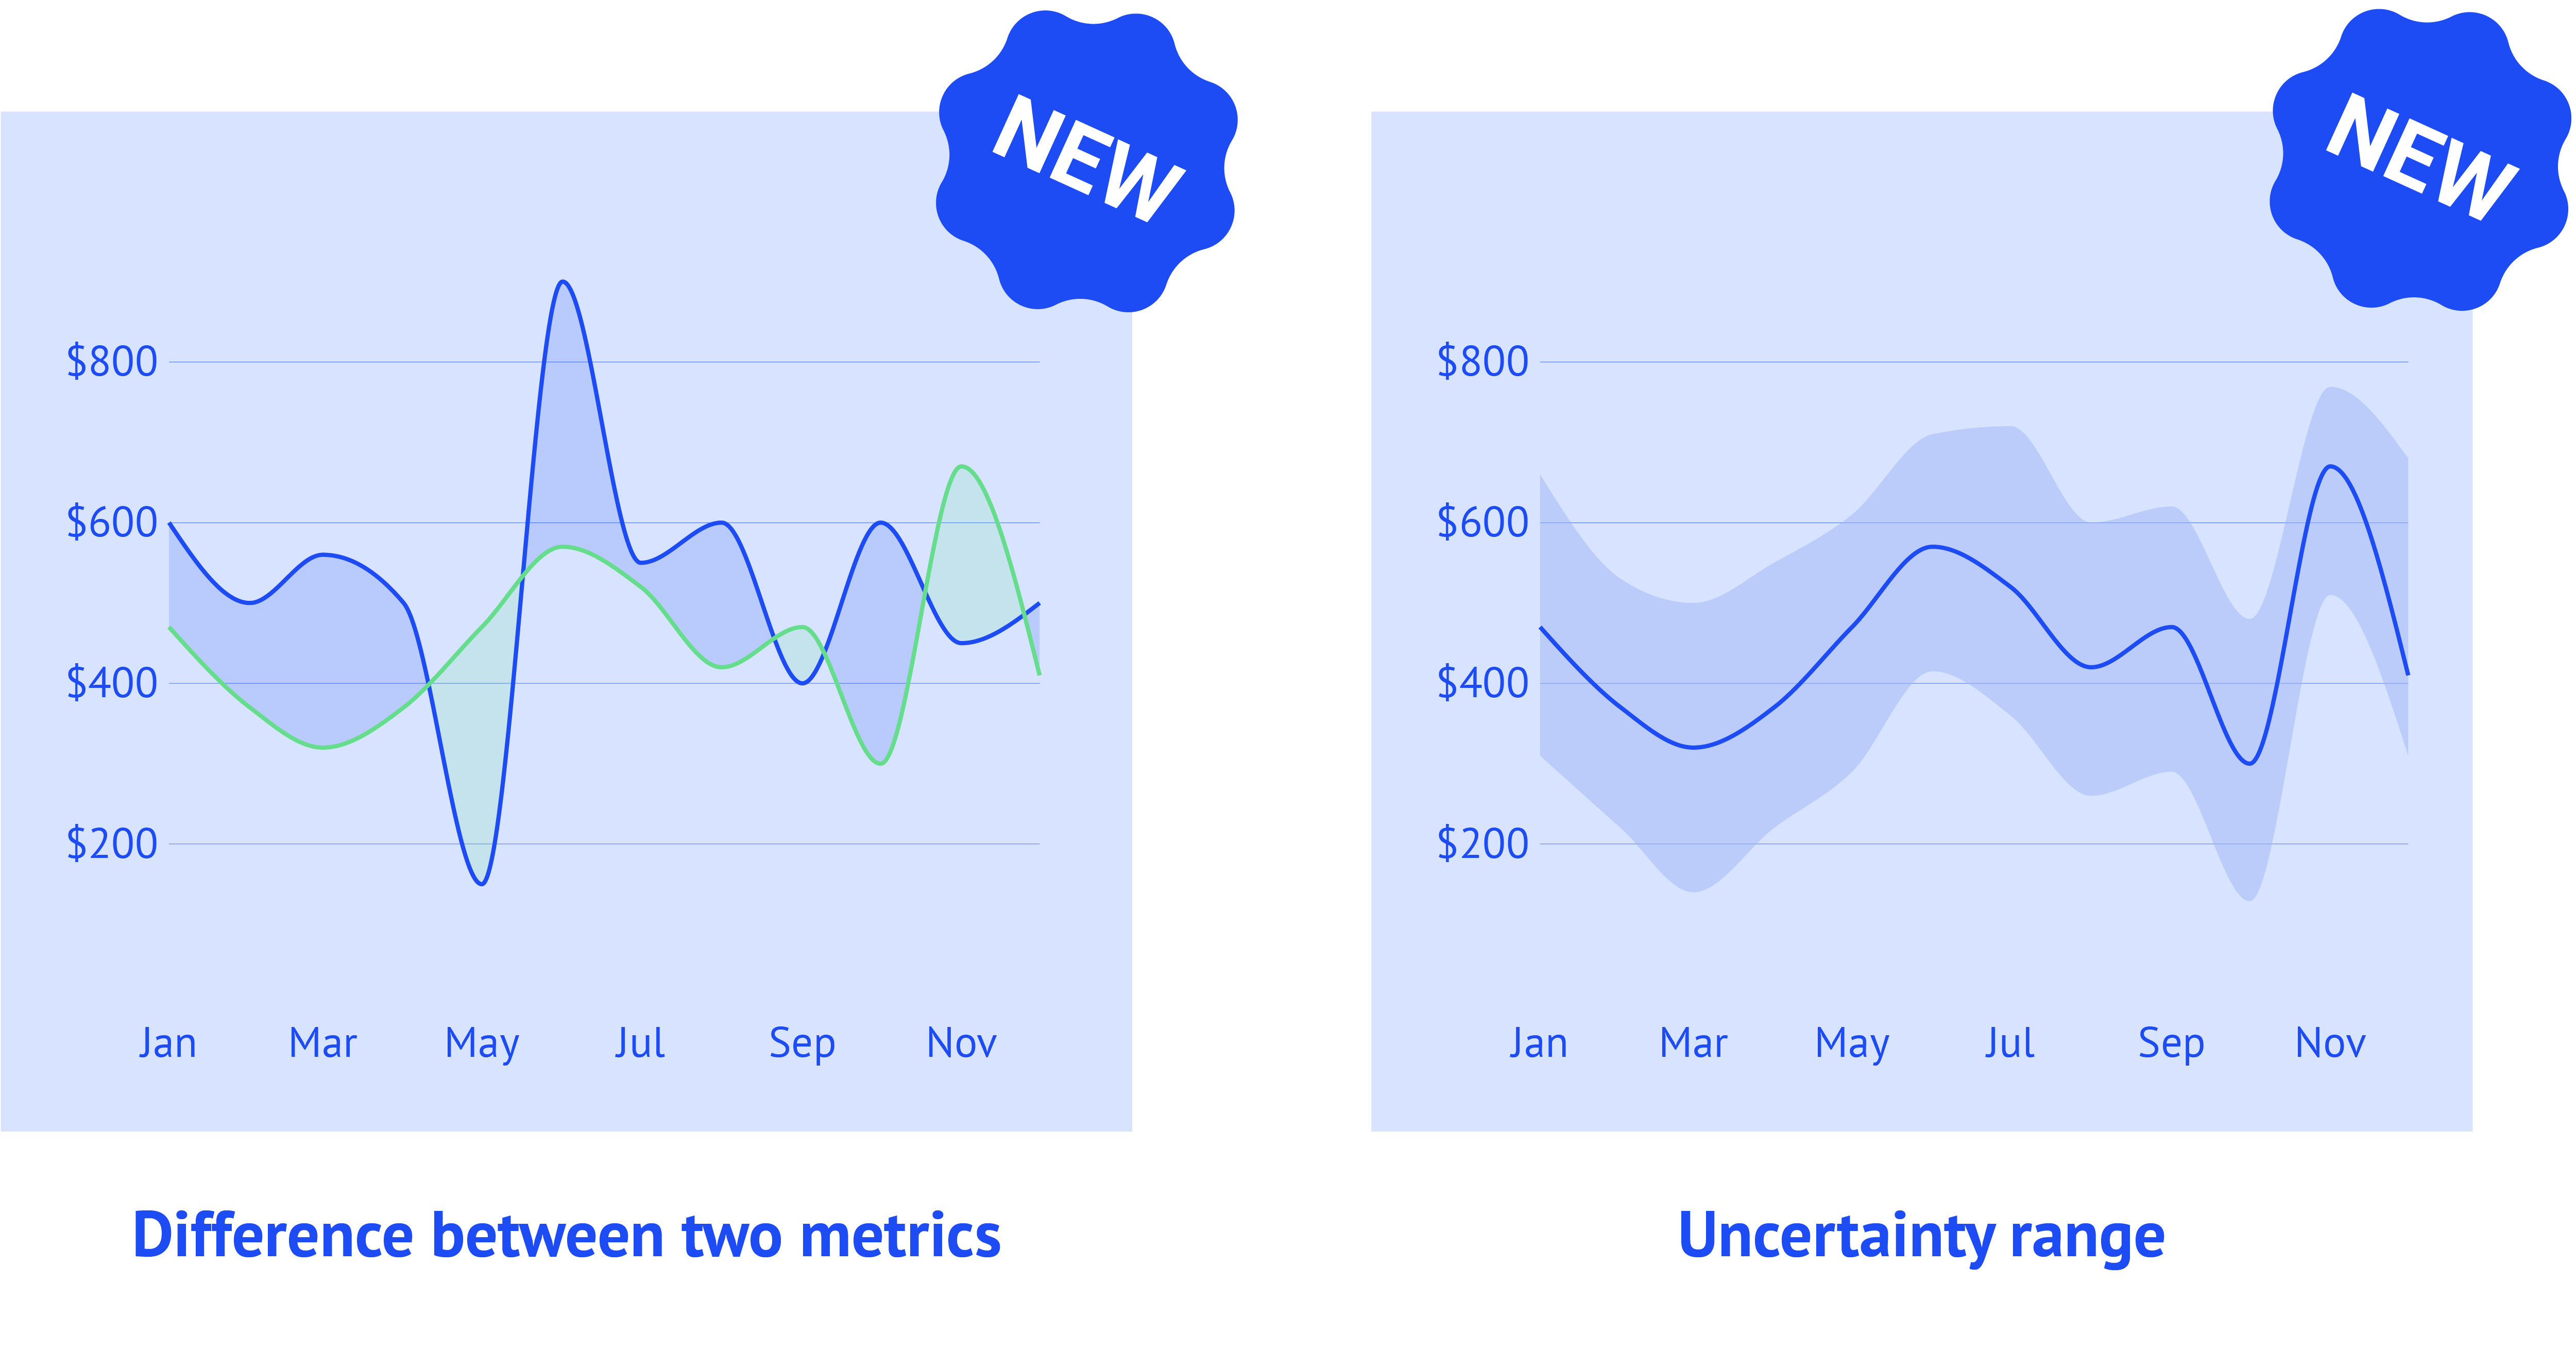
Difference area chart
Although called an area chart, look for this chart type in the Datylon Line chart family. With a few clicks, you can create a compelling area difference chart, perfectly suited to display an uncertainty range or a difference between two metrics over time for instance. Look at our samples on our Inspiration page or start making a difference yourself! (pun intended).
ADVANCED STYLING OPTIONS
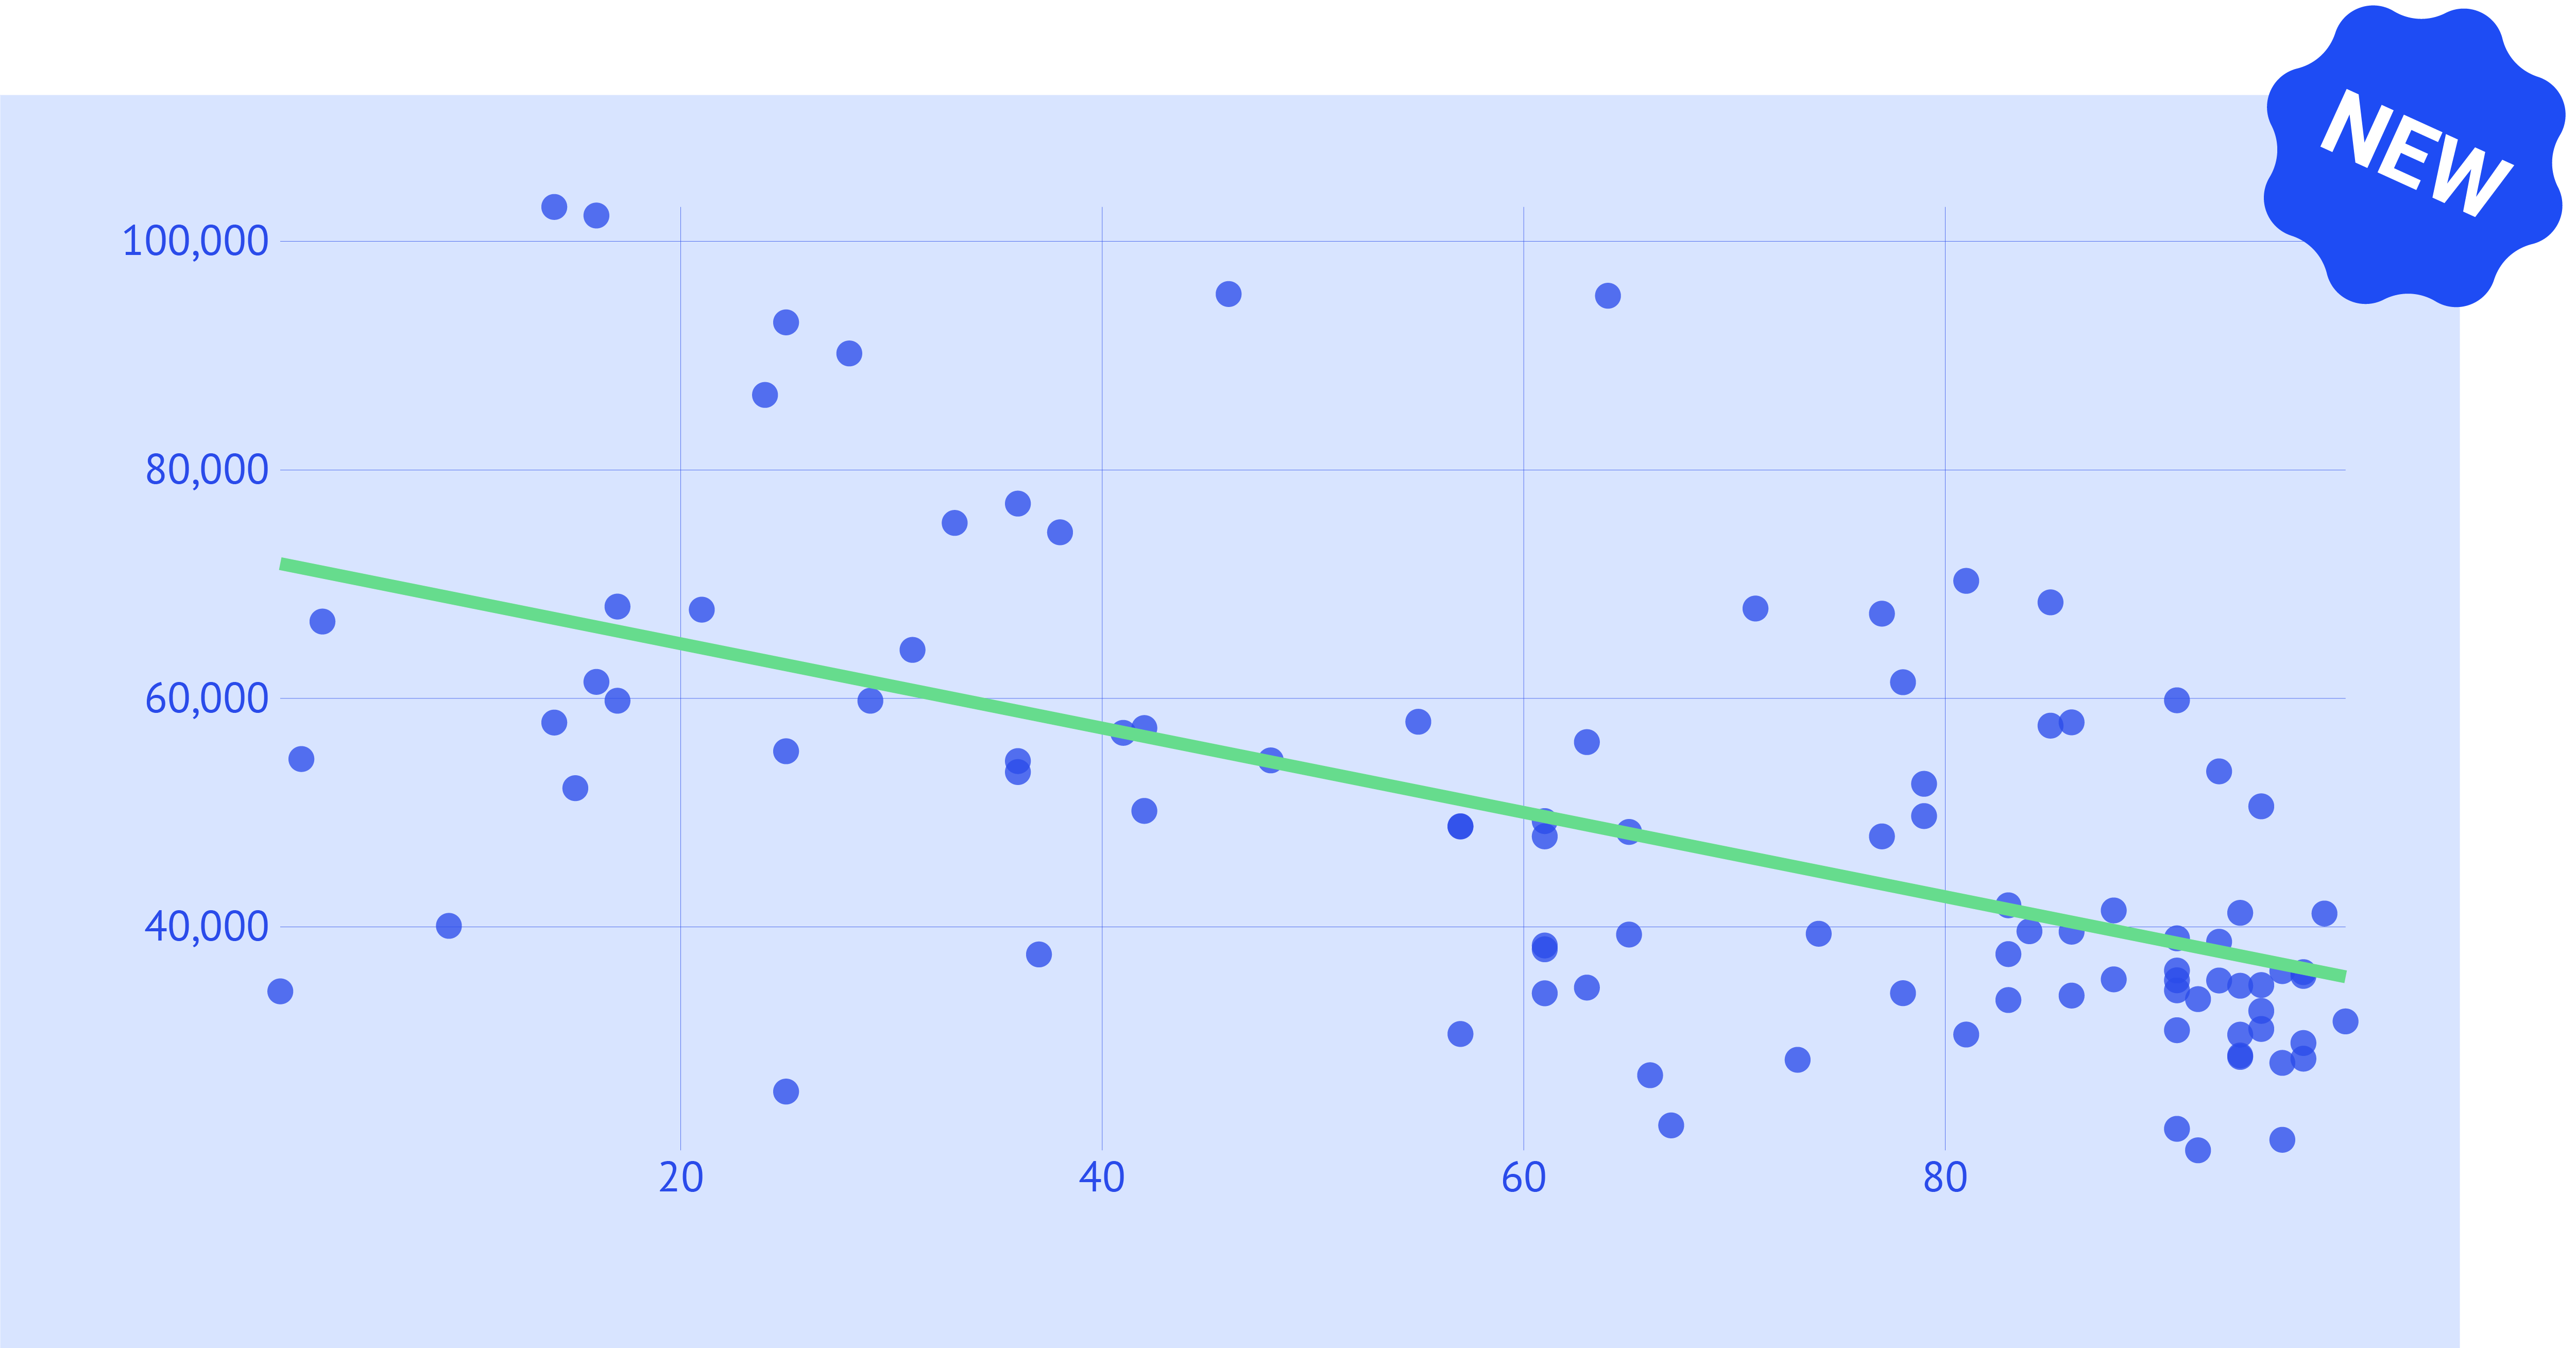
A trend line in a scatter plot
A trend line in a scatter plot helps to visualize the trend or cause & effect relationship between variables. A concept frequently used in statistics. The four most common regression types are supported; of course, like any object in Datylon, you have full control over the look and feel of the line.
COMPATIBILITY
The future is already here
As we are committed to staying on the edge of technology, we already support the latest version of Adobe Illustrator 2023 (v27) since its release. We recommend you keep your software up-to-date to make the best out of both Adobe Illustrator and Datylon for Illustrator. If you notice any compatibility issues, please let us know!
DATYLON WEB APP
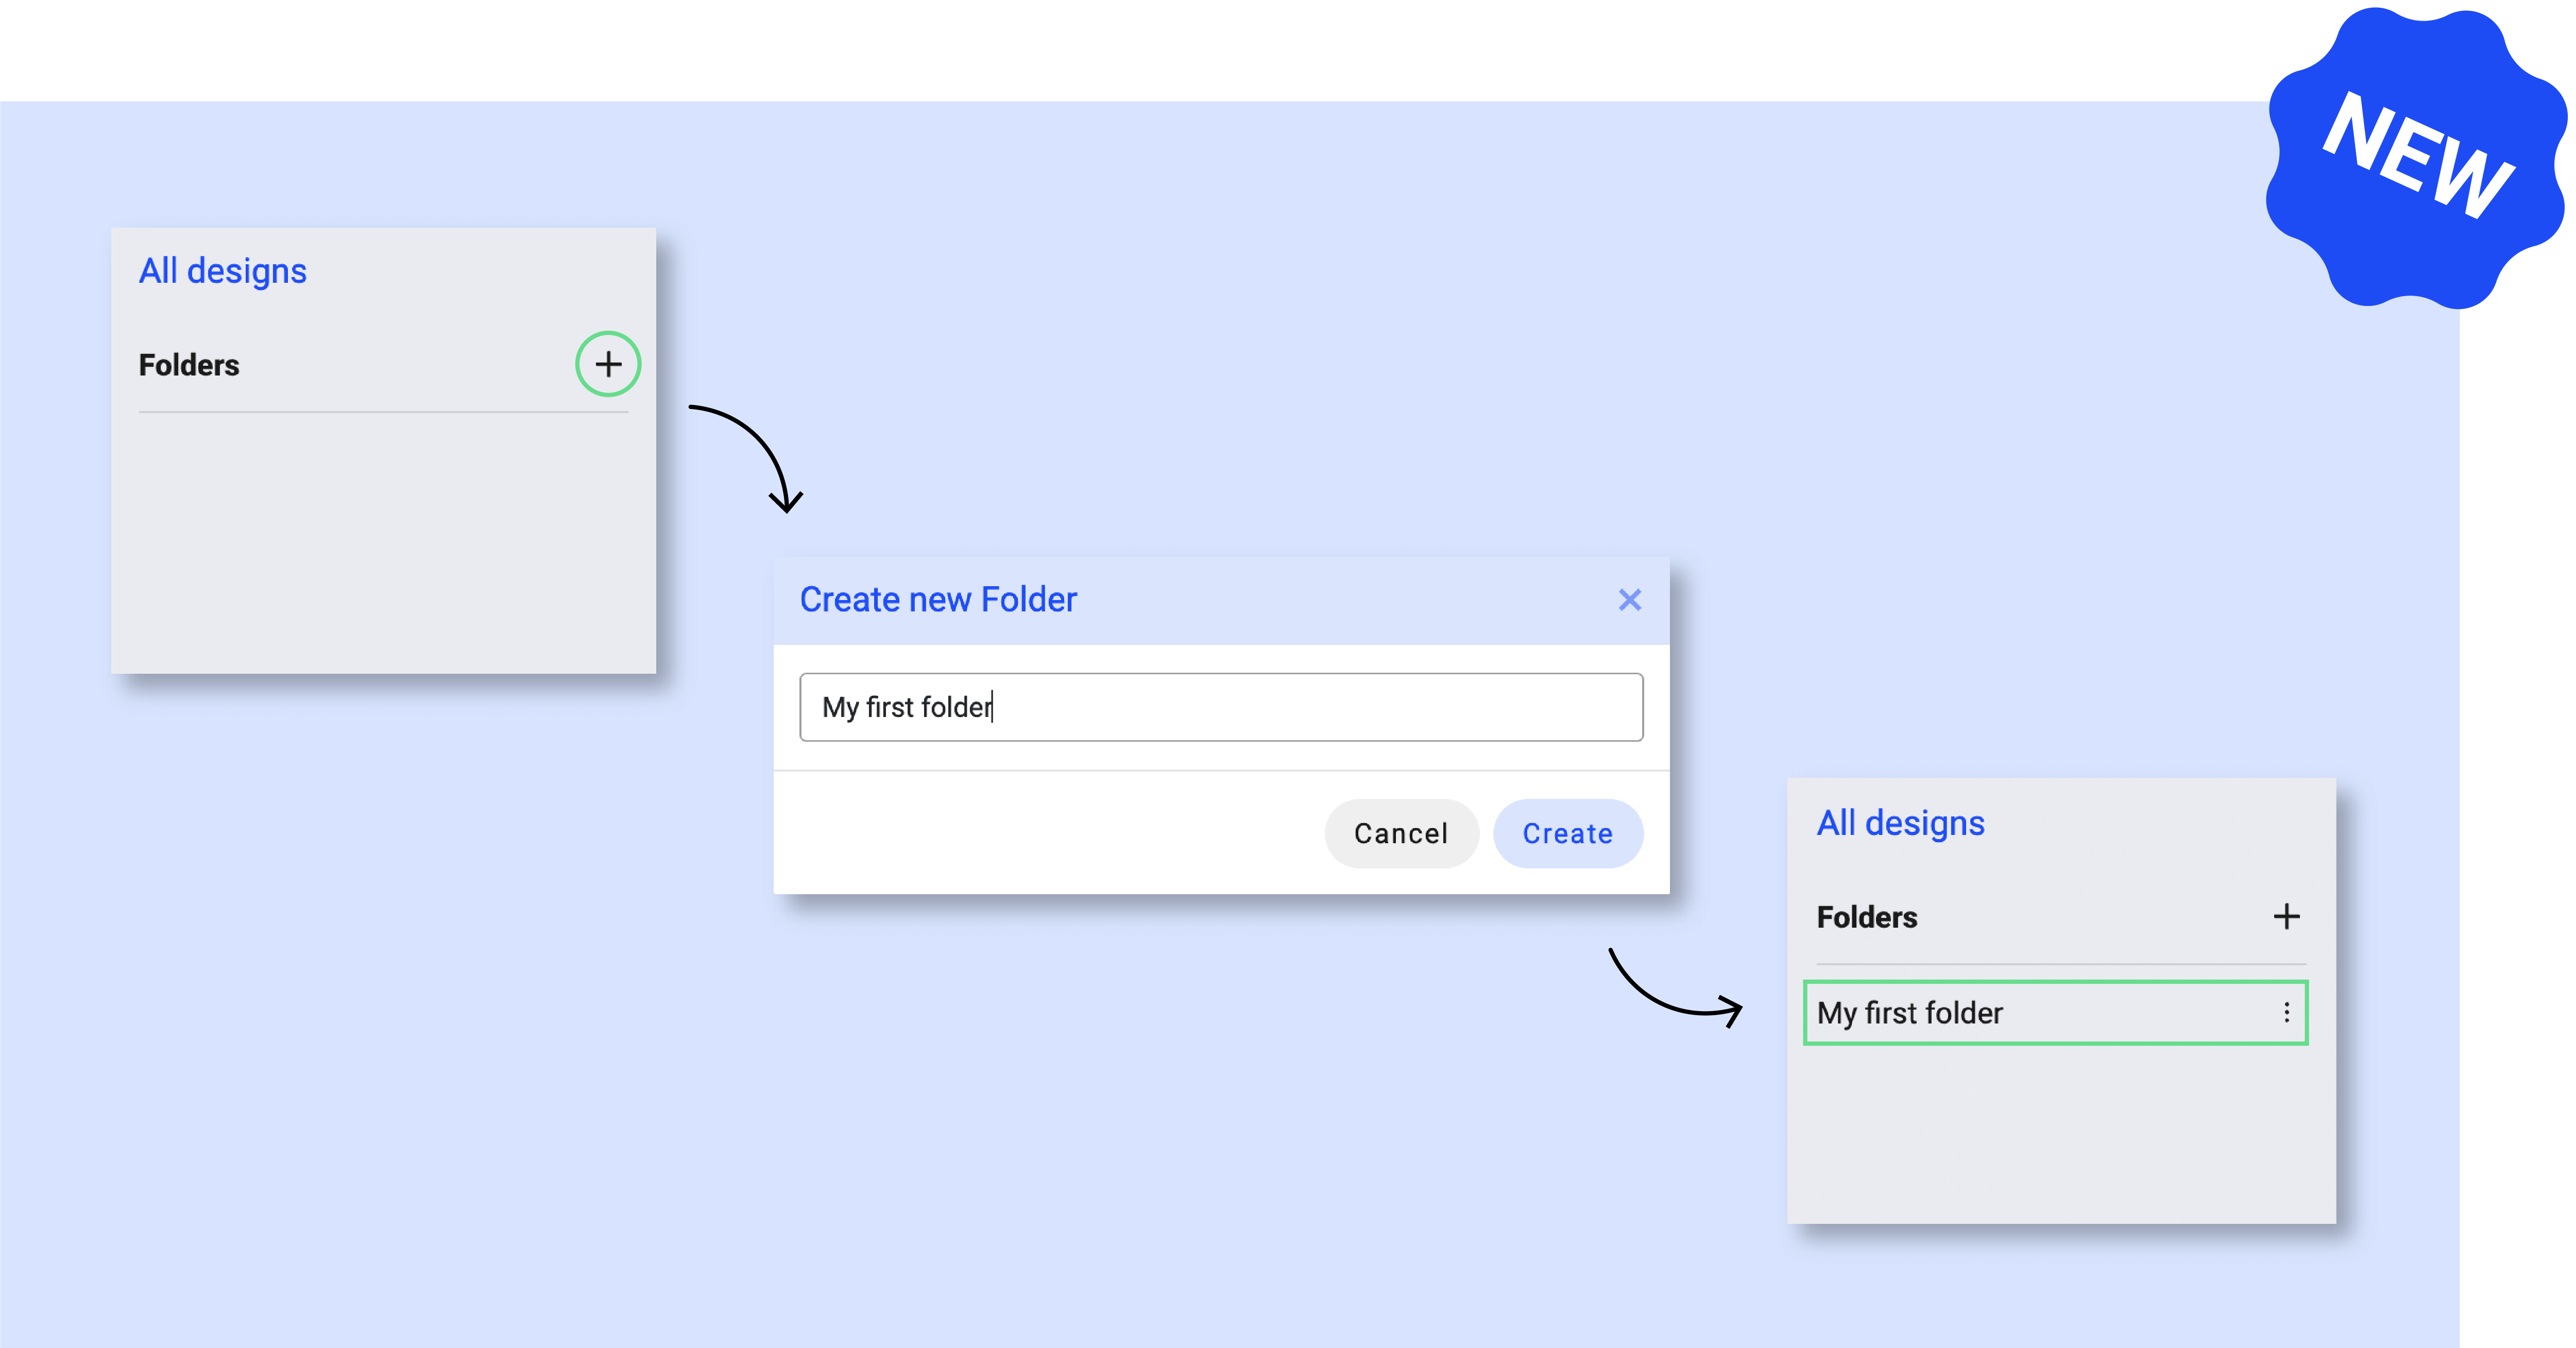
Folders for improved file management
More and more customers use the Datylon web app to produce frequent recurring charts or reports. To ease the management of this growing number of designs and reports, we created folders that you can name at your own preference. File management has never been this good!
The devil's in the detail, so there are still many more improvements and fixes we carried out for this product release. We covered them all in the R52 release notes in the Datylon Help Center.
Are you missing a feature? Use this link to request it now, so we can try to make it happen for the next releases!