Since the launch we’ve spent a lot of time talking to users. Priorities in our product roadmap are driven by their feedback. Most times that feedback is really positive, but in some cases users also highlight points of improvement. This type of feedback is always very helpful.
Table of contents
|
A golden nugget review
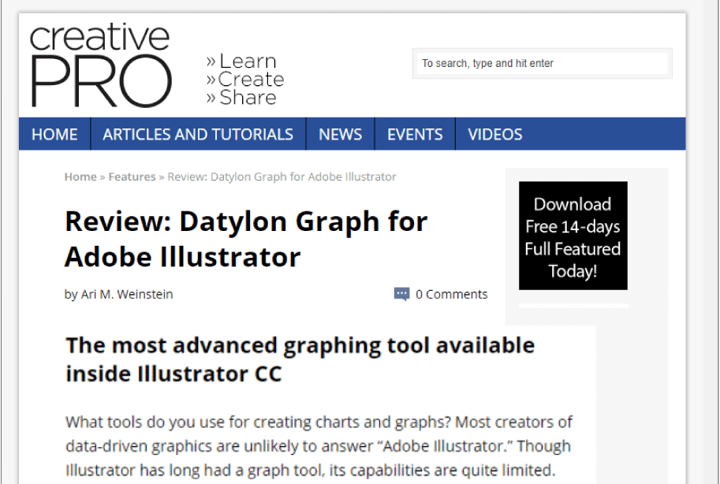
One of these more precious golden nuggets was the recent review by Ari Weinstein for Creative Pro. Towards the end of April, we got in touch with Mike Rankin, Editor in Chief of Creative Pro, who was curious to review Datylon for Illustrator. Ari - an Illustrator guru - was the lucky one who could do the review.
We had several conversations with Ari and it was always a pleasure to dive with him into the world of charting. His many years of experience in the field and professional background made him the perfect candidate to grill our tool and turn it inside out.
Giving something back
It was time to give something back. To Ari and to the many other users who have invested valuable time to help make our product better. So we decided to give feedback to their feedback. Letting everyone out here know: we hear you, and we’re working on it.
We hope you find our feedback insightful, like we did yours. And for those of you who want to join us on our mission, we included a little something special at the end of this blog post.
Our take on Ari's findings
We are very happy with Ari’s review of our plugin, it is an honest and balanced review, highlighting the positive points and points for improvement.
On the positive side, Ari stated: "The Datylon plug-in for Illustrator CC offers advanced graphing capabilities targeted at users who require robust control over their data-driven graphics within the world’s leading vector illustration application. Datylon overcomes numerous shortcomings of Illustrator’s built-in graph tool by providing many options and features, more control over data, as well as advanced graph types."
"The most advanced graphing tool available inside Illustrator CC"
But let’s also elaborate on the points for improvement:
“Datylon doesn’t format numerical data in ways that Excel easily can.”
Excel is what it is. Extremely useful, to the extent that you can create charts in Excel, leveraging all data manipulation features Excel offers and use those in Illustrator. But the net result still looks like an Excel chart.
One of Excel's goals is to format data, ours is to have branded reusable charts. Our strategy is not to compete with Excel, but to connect both tools. Live links to excel files are on the roadmap, allowing you to use the strength of each tool.
“You cannot use Illustrator’s main tools on a Datylon chart, as long as you want to use the plugin for formatting and data changes.“
Very true. But not an easy one to fix. We’re balancing between interactive editing vs. re-usability, whereas our focus is very much on chart reusability. Illustrator is a generic vector editor and it doesn't have tooling for smart labeling, data-driven colors, rescaling data-driven artwork, etc. We are adding these features via our plugin.
Re-usability is one of the most beloved features amongst users because it avoids a lot of manual rework. We need tight control over the chart styling properties, in order to make this happen. The result is that there are indeed fewer Illustrator tools working on our charts.
“You can’t save a Datylon chart as a Graphic Style to make it easy to re-use with other data.”
This is on a lot of users' wishlists. And we are happy to say it’s on our roadmap. We will not save it as an AI style though, but rather introduce an easy-to-use chart repository and chart themes, which will further improve chart re-usability.
“The plugin panel is very large and at times confusing because of the many layers.”
We agree, and we’re looking into fixing it.
“Datylon does not and will flag numbers with a percentage symbol as erroneous when it expects numerical data in that place on a sheet. Issues need to be fixed manually by re-entering the data.”
Transforming and formatting data is a constant challenge in chart design. In many cases, there are transformation or formatting operations required before you can visualize the data. We have formatting features available for numbers and datetime data but we plan to continuously improve our capabilities. Expect more powerful formatting features in future releases.
“The advanced styling options can become overwhelming, as so many things can be turned on or off and customized.”
All Datylon charts are fully customizable and reusable. There is no property you can’t edit, giving people maximum freedom of design. We expose properties that are typically reserved for people with coding skills.
But including all those options can be really challenging UX - wise. There is a learning curve for new users and we are continuously working on reducing it.
“The interface for applying fills and strokes is particularly frustrating. Each editable element has its own controls for selecting and applying colors.”
The fact that each editable element has its own controls is a big plus for those with advanced charting needs. We’re balancing between freedom of design vs. UX, whereas our focus at the start was very much on freedom of design. Now, thanks to feedback from users, we’re able to implement continuous improvements in terms of UX too. Specifically for this feature, the idea is to make the UI cleaner by only opening one color picker at the same time.
“Illustrator pattern and gradient swatches are not available in the plugin. The plugin’s gradient option provides only two-step linear gradients that have to be set up manually in the panel.”
That’s true, and we understand users miss it. Sometimes these trade-offs are very hard decisions to make. Developing our own color picker allowed us to support our data-driven coloring, which is a widely used and celebrated feature.
We also added dozens of sequential, diverging, qualitative color palettes specifically designed for chart design. In most cases, our color picker is a productivity booster but in some cases, it can indeed feel laborious.
“Customer support is great but the online Help Center is not good enough yet. People sometimes get stuck trying to figure out certain tasks.”
We are aware of the issue. It’s an important priority in the coming weeks and months. We are in the process of aligning content creation efforts within the company and we’re using feedback from users to learn more about their exact needs. On the roadmap is improved information architecture, making narrated videos a priority and creating more of our own charts for people to reuse, including how-to videos and articles.
We continue our mission
With each new release, we’re one step closer to our goal of making the perfect home for all your chart designs online or in Adobe Illustrator. Don’t hesitate to reach out and talk to us on Twitter, via chat or email.
Your #chartsmatter #staysafe and keep designing!