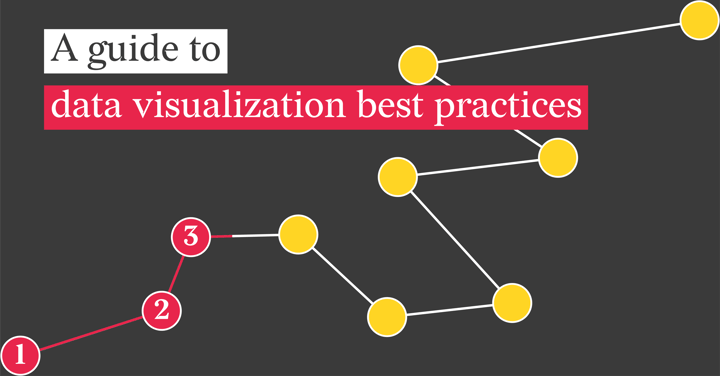
You have done the hard work of gathering the data. But let’s be honest: staring at a giant spreadsheet is confusing. The real magic happens when you turn those rows and columns into something people can actually understand. That is where data visualization comes in. By turning data into visuals, we make information easier to understand, compare, and communicate.
Becoming a master in data visualization best practices is a skill that makes most business aspects run smoothly. Professionals like analysts and entrepreneurs need to observe and decipher trends quickly to scale a business or make key decisions. The market is ever-changing, and keeping up with your data keeps you one step ahead of the competition.
Good data visualization is not just about making things look nice. It is about making your point immediately clear. It helps everyone, from the newest team member to the CEO, understand where things stand and what needs to happen next.
Here are some simple rules to follow to make your charts effective.
Table of contents
1. Start with the person, not the data 2. Pick the right chart for your question 3. Design for clarity: keep it clean and organized 4. Make it accessible for everyone |
1. Start with the person, not the data
Before you even open a charting tool, ask yourself: who is going to look at this? This should be the first question you ask when you are gathering and organizing your information.
It is important to think about your audience's needs and their knowledge level. Your data should tell a clear, concise story. That context is what turns raw numbers into useful insights that support better decision-making.
- If it is a high-level executive, they do not need the tiny details. They need a simple answer to a big question, such as “Are we making money”. A static overview works best here. It shows the results immediately and guides them through the narrative without requiring exploration. Keep it big-picture and highlight the main takeaway.
- If it is your team of analysts, they usually do want the details. In this case, interactive visualizations work best. Filters, drilldowns, and comparisons help analysts explore the data themselves and uncover patterns. They have the context to interpret more complexity, so you can include deeper layers of information.
- If it is the wider public or a general audience, the visual should be easy to understand and beginner-friendly. Use familiar chart types and make the design engaging without assuming any prior expertise.
When the chart matches the needs of the person viewing it, the message lands more clearly. You make it easier for your audience to understand, act, and stay aligned with your story.
If you want to explore these early planning steps even further, our earlier article “A guide to effective data visualization” breaks down the full process from analyzing data to building, designing, telling, and sharing your story.

2. Pick the right chart for your question
Don’t just use the first chart Excel suggests. Each type of chart answers a different kind of question. Choosing the wrong one is like using a screwdriver when you need a hammer.
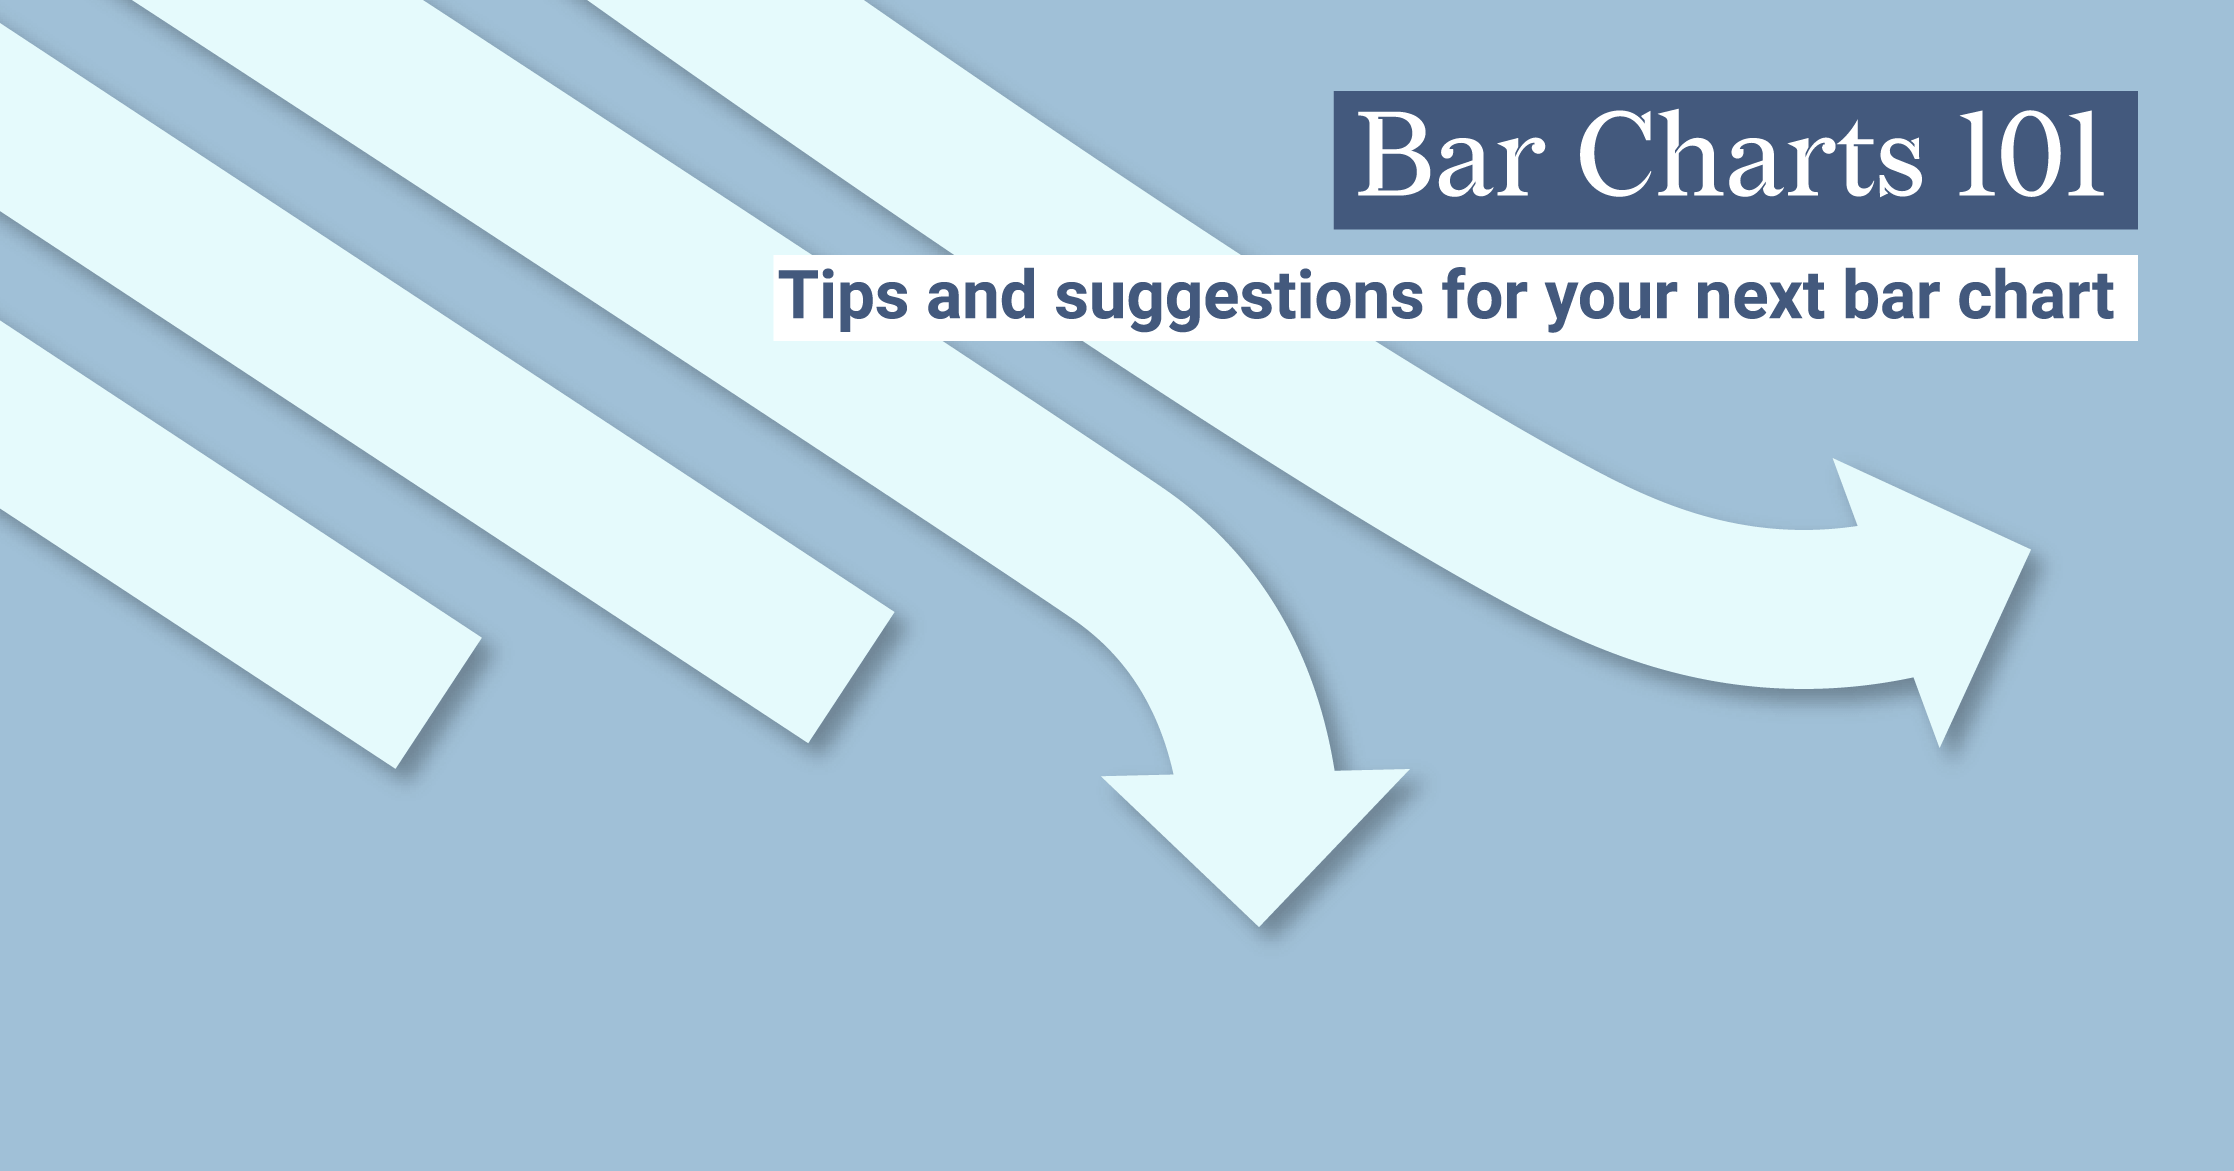
When you want to compare things...
Use bar or column charts. These are best when you want to show how different categories compare with each other. They’re easy to read because our brains are great at comparing bar lengths.
In a business context, they may be used for comparing:
- Sales figures
- Survey responses
- Market share analysis
- Inventory management
- Employee performance
- Financial analysis
- Marketing campaign effectiveness
- Budget allocations
Quick tip: Generally, bar charts (horizontal bars) are best because you have enough space to write out long category labels horizontally without tilting them. Only use column charts (vertical bars) when your data has a natural, sequential order (like months of the year or age groups) that needs to be read from left to right.
When you want to see changes over time...
Use line graphs. If you’re tracking growth, decline, or volatility across days, months, or years, the line chart is the clearest choice. It shows the data's journey.
Examples where you could use these types of graphs are:
- Tracking stock prices
- Observing temperature changes
- Monitoring website traffic
- Customer acquisition and retention
- Product development
- Market research
- Supply chain management
Variation: You can also use an area chart by filling the space under the line. This is great for showing cumulative totals or highlighting the differences between categories over time. Important: Area charts should always start the y-axis at zero to accurately represent the volume or total.
When you want to show parts of a whole...
Use donut charts (carefully). Donut charts are usually better than traditional pie charts because your eye compares the arc length of the slice instead of the surface area, which is easier to read accurately. Only use these when the pieces truly add up to 100% and you have just a couple of categories (less than five is ideal).
Businesses may use donut charts for:
- Market share analysis
- Budget allocation
- Product mix
- Customer segmentation
- Survey results
- Lead conversion rates
- Employee demographics
- Web traffic sources
If you have more than a handful of categories, a stacked bar chart is much clearer. If you have many categories you need to compare, consider using small multiples (multiple tiny charts) to show the breakdown across different dimensions.
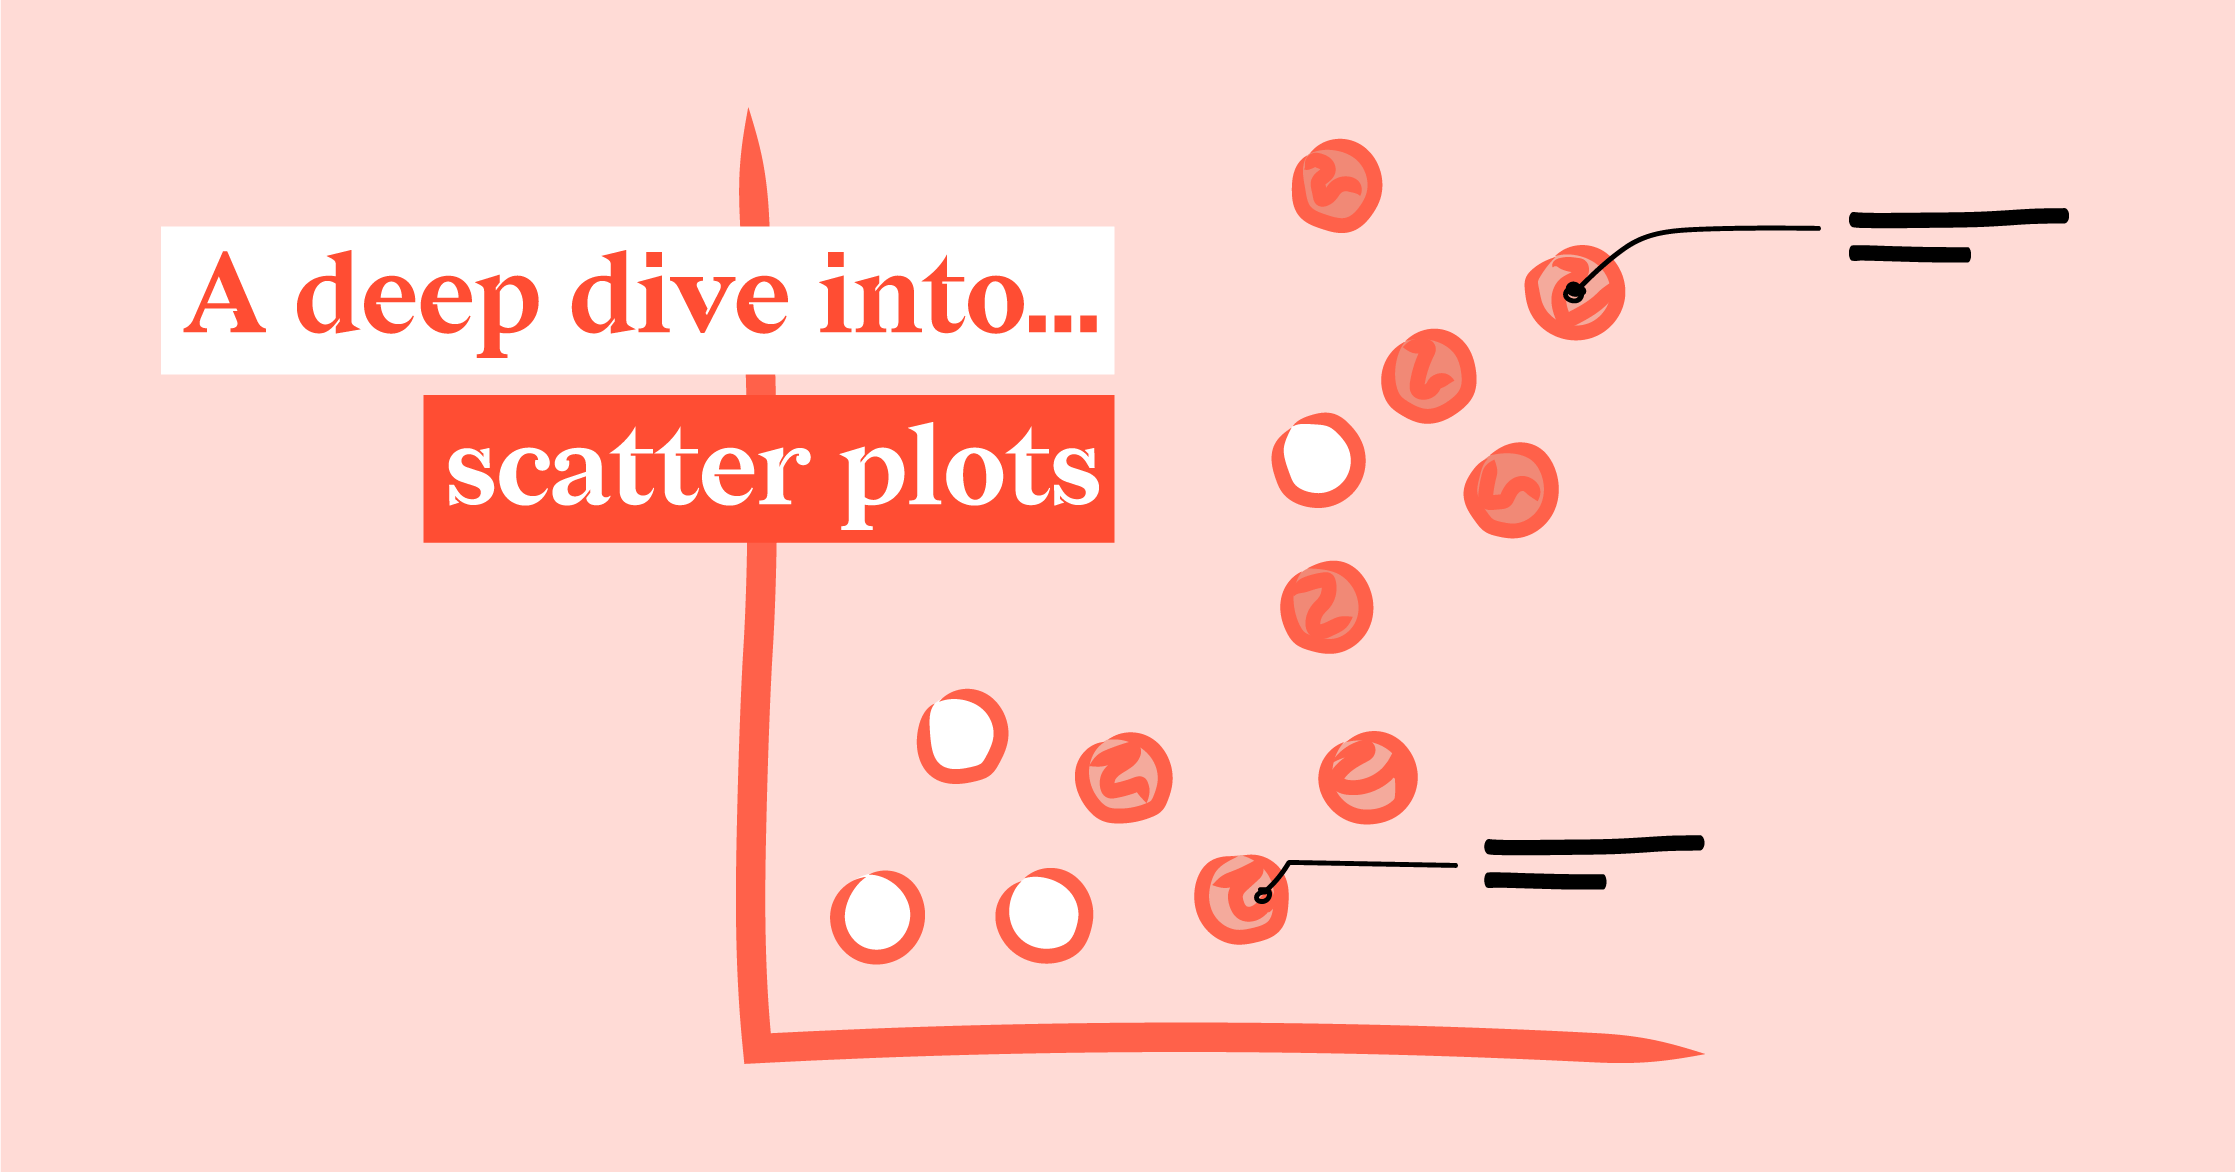
When you want to find a relationship...
Use scatter plots. Use these when you want to see if one variable affects another. For example, does the amount we spend on ads relate to the number of clicks we get? A scatter plot shows if there’s a pattern or correlation.
Examples where scatter plots get used include:
- Sales and marketing expenditure analysis
- Examining customer engagement metrics
- Observing customer satisfaction data for product development
- Measuring operational efficiency between production inputs and output levels.
Advanced tip: If you have more than two variables, you can upgrade this to a bubble chart. The third variable is typically used to determine the size of the bubbles. You can even add more variables using color, stroke, or icons, but be very careful here that the chart doesn't become impossible to read.
When you want to track performance against a goal...
Use bullet charts. Bullet charts are ideal for showing how a single metric performs against a target and within defined performance zones (such as poor, average, or good). They pack a lot of information into very little space.
They are great for KPI dashboards like:
• Revenue vs. target
• Monthly signups vs. goal
• Customer satisfaction score vs. benchmark
• Production output vs. quota
• Cost vs. budget target
Because they are so compact, you can display many bullet charts side by side to compare performance across teams or departments.
When you want to summarize density or intensity...
Use heatmaps. Heatmaps use color intensity to show patterns in a matrix format. They reveal hotspots instantly because the eye is naturally drawn to color changes.
Common examples:
• User activity by day and hour
• Website scroll-depth patterns
• Risk scoring matrices
• Sales performance by region and product
• Correlation matrices in analytics
• Attendance or booking patterns across time slots
Heatmaps are especially useful when you want to highlight where things are “hot” or “cold” without needing fine-grained numeric precision.
Want to dig deeper? Check out our article on 80 different types of charts.

3. Design for clarity: keep it clean and organized
When you have a lot of data, it can be tempting to put everything on the page. Try not to. Clutter hides the insight you are trying to communicate.
Your goal is to make the important information stand out. Every pixel should have a purpose, either showing data or adding essential context. This is the idea behind the data ink ratio: show as much meaningful data as possible while removing anything that distracts from it.
Clear design principles (decluttering)
Remove extra labels and lines
If a chart already has data labels, you do not need axis labels or a forest of grid lines. Keep only what helps the viewer read the chart.
Avoid decoration
Skip 3D effects, drop shadows, gradients, and textured backgrounds. Flat, simple design is usually the easiest to interpret.
Use color with intent
Choose color only when it adds meaning. Highlight the one or two elements you want people to notice, such as the highest value or the most important category.
Creating visual hierarchy (organization)
Good design is not only about simplifying. It is also about telling a clear story and guiding the viewer through it.
Start with the headline
Use your title to communicate the main message, such as “Revenue grew 20 percent”. Subtitles and small annotations can provide quick context.
Guide the eye
People naturally look at elements that are large, bold, or strongly colored. Use this to your advantage. Make your key metric bigger or highlight a crucial value with a contrasting color.
Prioritize legibility
Typography matters. Choose clean, readable fonts, and keep sizes consistent. If someone has to squint to read an axis label, the design needs improvement.
When these elements come together, your visualization becomes both clean and effective. The viewer understands the message quickly, follows your story without effort, and focuses on exactly what matters.

4. Make it accessible for everyone
Good design is inclusive design. With hundreds of millions of people worldwide experiencing some form of vision impairment, making your data accessible isn't just ethical, it's a smart business choice that benefits everyone.
Any improvement you make for a user with low vision or color blindness will make the chart clearer for all users.
Addressing color blindness
Around 8% of men (and 0.5% of women) are colorblind, making red/green combinations a major hazard. The goal is to make sure your chart works even when color fails.
- Don't rely on color alone: This is the biggest rule. Instead of only using color to differentiate data points, use non-color elements like patterns, icons, dashed lines, or lines with various stroke thicknesses.
- Mind your palette: If you need color, use color blind-safe hues like blue and red/orange. Avoid combining red and green as opposites. If you need many data points, using a single-hue palette (just varying shades of one color) is the safest choice, especially since it works even for complete color blindness.
- Test it: Use color-blind simulators (like those in Adobe Illustrator) or simply check your visualization in grayscale. If it works in black and white, you're safe.
Addressing general visual impairment
For users who rely on assistive technologies like screen readers, we need to focus on structure and text.
- Use descriptive text: Always include Alt Text and a brief summary of the visualization. The Alt Text should contain the chart type, the data presented, the main conclusion, and ideally a link to the full dataset.
- Prioritize text clarity: Use clean, sans serif typefaces and ensure the font size is large enough to be legible (using 12pt or 16px is generally recommended).
- Use direct labels: Place labels directly on the data elements instead of forcing the user to rely on a separate legend. This increases readability for everyone and gives screen readers more specific information.
- Keyboard accessibility: For interactive visualizations, ensure all navigation and actions can be performed using the keyboard only. Static visualizations are often preferred for maximum accessibility, but if data changes frequently, use automated reporting tools to generate updated static charts on a schedule.
For more in-depth guidance on designing for these audiences, check out our resources: The best charts for color blind viewers and 11 tips for designing accessible charts for visually impaired readers.

5. Test, get feedback, and stay fresh
Your work isn't done just because the chart looks finished. Before presenting, you must ensure your data visualization shares the insights you intended to communicate.
Testing and feedback
You've been staring at the data for too long, and it makes perfect sense to you. That's why you need a fresh pair of eyes.
The squint test: Show your visual to a colleague or friend who hasn't seen the data before. Ask them to give you their main takeaway in just a few seconds. If their answer doesn't match your intended insight, you have a usability issue that needs fixing.
Identify pain points: Use surveys or quick interviews to gather feedback. Look for areas where viewers get confused, encounter usability issues, or spot gaps in the context. This feedback is essential for assessing how the visuals are actually being interpreted. To share a survey you can use a link or QR code via tools like Uniqode
Testing automated data visualizations
Automated data visualization is becoming increasingly important as organizations move toward faster and more consistent reporting. It refers to generating charts automatically from templates and data sources, reducing manual work and the risk of errors. Tools like the Datylon Report Server optimize this process by offering customizable templates, scheduling options, flexible distribution, and smooth connections to data sources. This helps you create reliable, on-brand charts and reports at scale.
If you use tools to automate chart generation, such as templates linked to (live) data, testing becomes essential. Automation saves time but can introduce design issues when the data changes dramatically.
Test with varied datasets: Check whether your chart still works with small values, large spikes, outliers, or volatile data.
Check for overlaps: Make sure labels always fit, and no elements collide or disappear. These issues often show up only when the data changes.
Keeping up with trends
The landscape of data visualization is always evolving. To keep your work engaging and effective, stay inspired by new methods and trends. These are the trends we currently see shaping the field, though they are not universal rules and may evolve as the industry grows:
Inclusivity: As society becomes more aware of topics like gender, culture, and accessibility, it is likely that these conversations will continue to influence data visualization as well. Inclusive dataviz means thinking beyond color blindness and considering a wider range of user needs from the start.
This can include using respectful labels, avoiding stereotypes in icons or colors, and being thoughtful with categories like “Other”, which can unintentionally marginalize groups. It may also involve accounting for cultural differences such as reading direction or color associations, and ensuring charts remain readable for people with low vision through strong contrast and accessible typography. These kinds of choices can help visualizations feel more considerate, balanced, and welcoming to a broader audience.
Data storytelling: Data storytelling is becoming a key skill because people want clarity, not complexity. A good story helps the audience understand why the data matters and what they should take away from it. This usually means using clear headlines, short annotations, and a logical flow so the viewer moves naturally from context to insight to conclusion. A strong narrative also helps avoid misinterpretation by guiding the viewer toward the correct message instead of leaving them to draw their own, potentially incorrect conclusions.
Mobile-friendly design: With more people viewing dashboards and reports on their phones, mobile-first design is essential. This means checking legibility at small sizes, simplifying layouts, and avoiding dense, crowded visuals. Touch-friendly interactions and larger tap targets help on dashboards, while static reports may require simplified versions or alternative layouts that stack cleanly on narrow screens. A chart that works beautifully on desktop but becomes unreadable on mobile loses its value.
AI (with human interpretation): AI tools are increasingly involved in data analysis and visualization workflows, helping clean data, find patterns, or even suggest chart types. These tools can speed up repetitive work, but the human role remains crucial. Interpretation, nuance, and tone still rely on human judgment. AI may highlight a trend, but you decide what it means and how to communicate it responsibly. The best results come when AI supports the process without replacing the designer’s experience and awareness.
Automated and interactive data visualizations: Interactive dashboards, filters, and drilldowns make it easier for users to explore data and find their own answers. At the same time, we think static reporting remains essential. Interactive visuals are ideal for exploration, while static charts are better for explaining a clear takeaway without any extra clicks. Both formats have their own place when used intentionally, and both can be automated so they stay up to date without manual effort.
Augmented reality and virtual reality visualizations: Interacting with data has never been this immersive before. The methods allow audience members to visualize complex data sets in a new and exciting manner.

Conclusion: turning your data into insightful stories
Data visualization is not just a technical skill. It is a way of thinking, communicating, and helping people make sense of the world. When you choose the right chart, design with clarity, and keep your audience in mind, your visuals stop being decorations and start becoming real decision-making tools.
The truth is, no one gets everything perfect on the first try. The best visualizations come from testing, refining, and staying curious about new methods and ideas. If you keep practicing these principles, your charts will become clearer, more thoughtful, and more impactful over time.
Most importantly, dataviz is something you learn by doing. So open your tool of choice, experiment with a few charts, and see what story your data wants to tell. The more you practice, the more confident and creative you will become.
And when you are ready to take things a step further, explore our tools to help you create, automate, and polish your visualizations. With the right foundation, you can turn any dataset into something meaningful, understandable, and worth sharing.