Automated Data Visualization Trends: What to Look for in Report Server Tools

In today's data-driven world, manually creating reports and charts is a time-consuming and error-prone. Automated reporting, powered by server-based tools, offers a transformative solution. Organizations can significantly enhance efficiency, accuracy, and overall productivity by automating the process of generating reports and visualizations.
It's important to clarify what we mean by 'automated reporting' in this context. While automation can encompass many types of reporting, our focus is on generating static reports and charts. These are not interactive data visualizations, but in-depth pages and documents that can be automatically generated.
A report server tool acts as the central hub in automated reporting; it automates the retrieval of data from various sources, applies the data to predefined templates, and generates reports or charts in desired formats. This streamlined approach eliminates manual intervention, reduces human error, and ensures consistent, timely delivery of critical information.
In the following sections, we will dive into the specific challenges that server-based reporting tools effectively address compared to manual report generation. We will then explore the essential features and capabilities that distinguish modern report server tools, helping organizations to use the full potential of their data. Finally, we will provide a practical checklist to guide your evaluation process when selecting the optimal tool for your specific needs.
The Rise of Report Server Tools
Manual report generation often presents significant challenges, including time-consuming tasks, human error, inconsistencies, and difficulties with distribution and collaboration. In this section, we will explore these challenges in detail and demonstrate how report server tools can provide effective solutions.
- Time-consuming: Repetitive tasks like formatting, data entry or copying numbers are manual processes that consume significant resources. By using a report server tool, these time-consuming tasks are eliminated, freeing up valuable time and resources for more strategic activities.
- Error-prone: Human error is inevitable, leading to inaccuracies in reports and compromised decision-making. With a report server, the risk of human error is significantly reduced as data extraction and transformations, are performed by software, which is less susceptible to mistakes than humans, especially when dealing with large or complex datasets.
- Inconsistent: Lack of standardization leads to discrepancies in reports, making comparisons difficult. Automated reporting addresses this by utilizing pre-designed templates that establish a consistent layout, formatting, and structure for all reports. These templates serve as a foundation, ensuring that only the data changes while the overall presentation remains uniform. This standardization simplifies the creation of multiple reports, facilitates comparisons, and enhances data clarity.
- Always up-to-date reports: Manually updating reports is a time-consuming and error-prone process, often leading to outdated and inaccurate information. By using pre-designed templates that automatically refresh with new data, you ensure everyone accesses the most current and accurate information in a centralized location.
- Scheduling reports: Manually generating reports on demand is inefficient and prevents proactive decision-making. By scheduling reports to run automatically at specific intervals, consistent reporting is ensured, eliminating the need to manually seek out the latest information.
- Easy teamwork: Coordinating report creation across teams often involves time-consuming email exchanges and version control challenges. By enabling multiple users to work simultaneously on reports, report server tools facilitate efficient teamwork. This eliminates the need for lengthy email chains and version control, improving overall productivity and communication.
- Better communication: Distributing reports manually can be time-consuming and often leads to inconsistencies in information across the organization. Automated reporting platforms facilitate the easy distribution of reports to relevant stakeholders, ensuring everyone has access to the same information. This promotes consistency, alignment, and informed decision-making across the organization.
By addressing the common pitfalls of manual reporting, report server tools support organizations to optimize processes, improve data accuracy, and make more informed decisions.
Key Features of an Automated Report Server
But what makes a report server tool truly effective? To maximize the benefits of automation, you need the right features. Therefore, let's examine the essential characteristics to consider when choosing a report server solution, which can range from off-the-shelf to a custom development service.
Data Connectivity and Integration
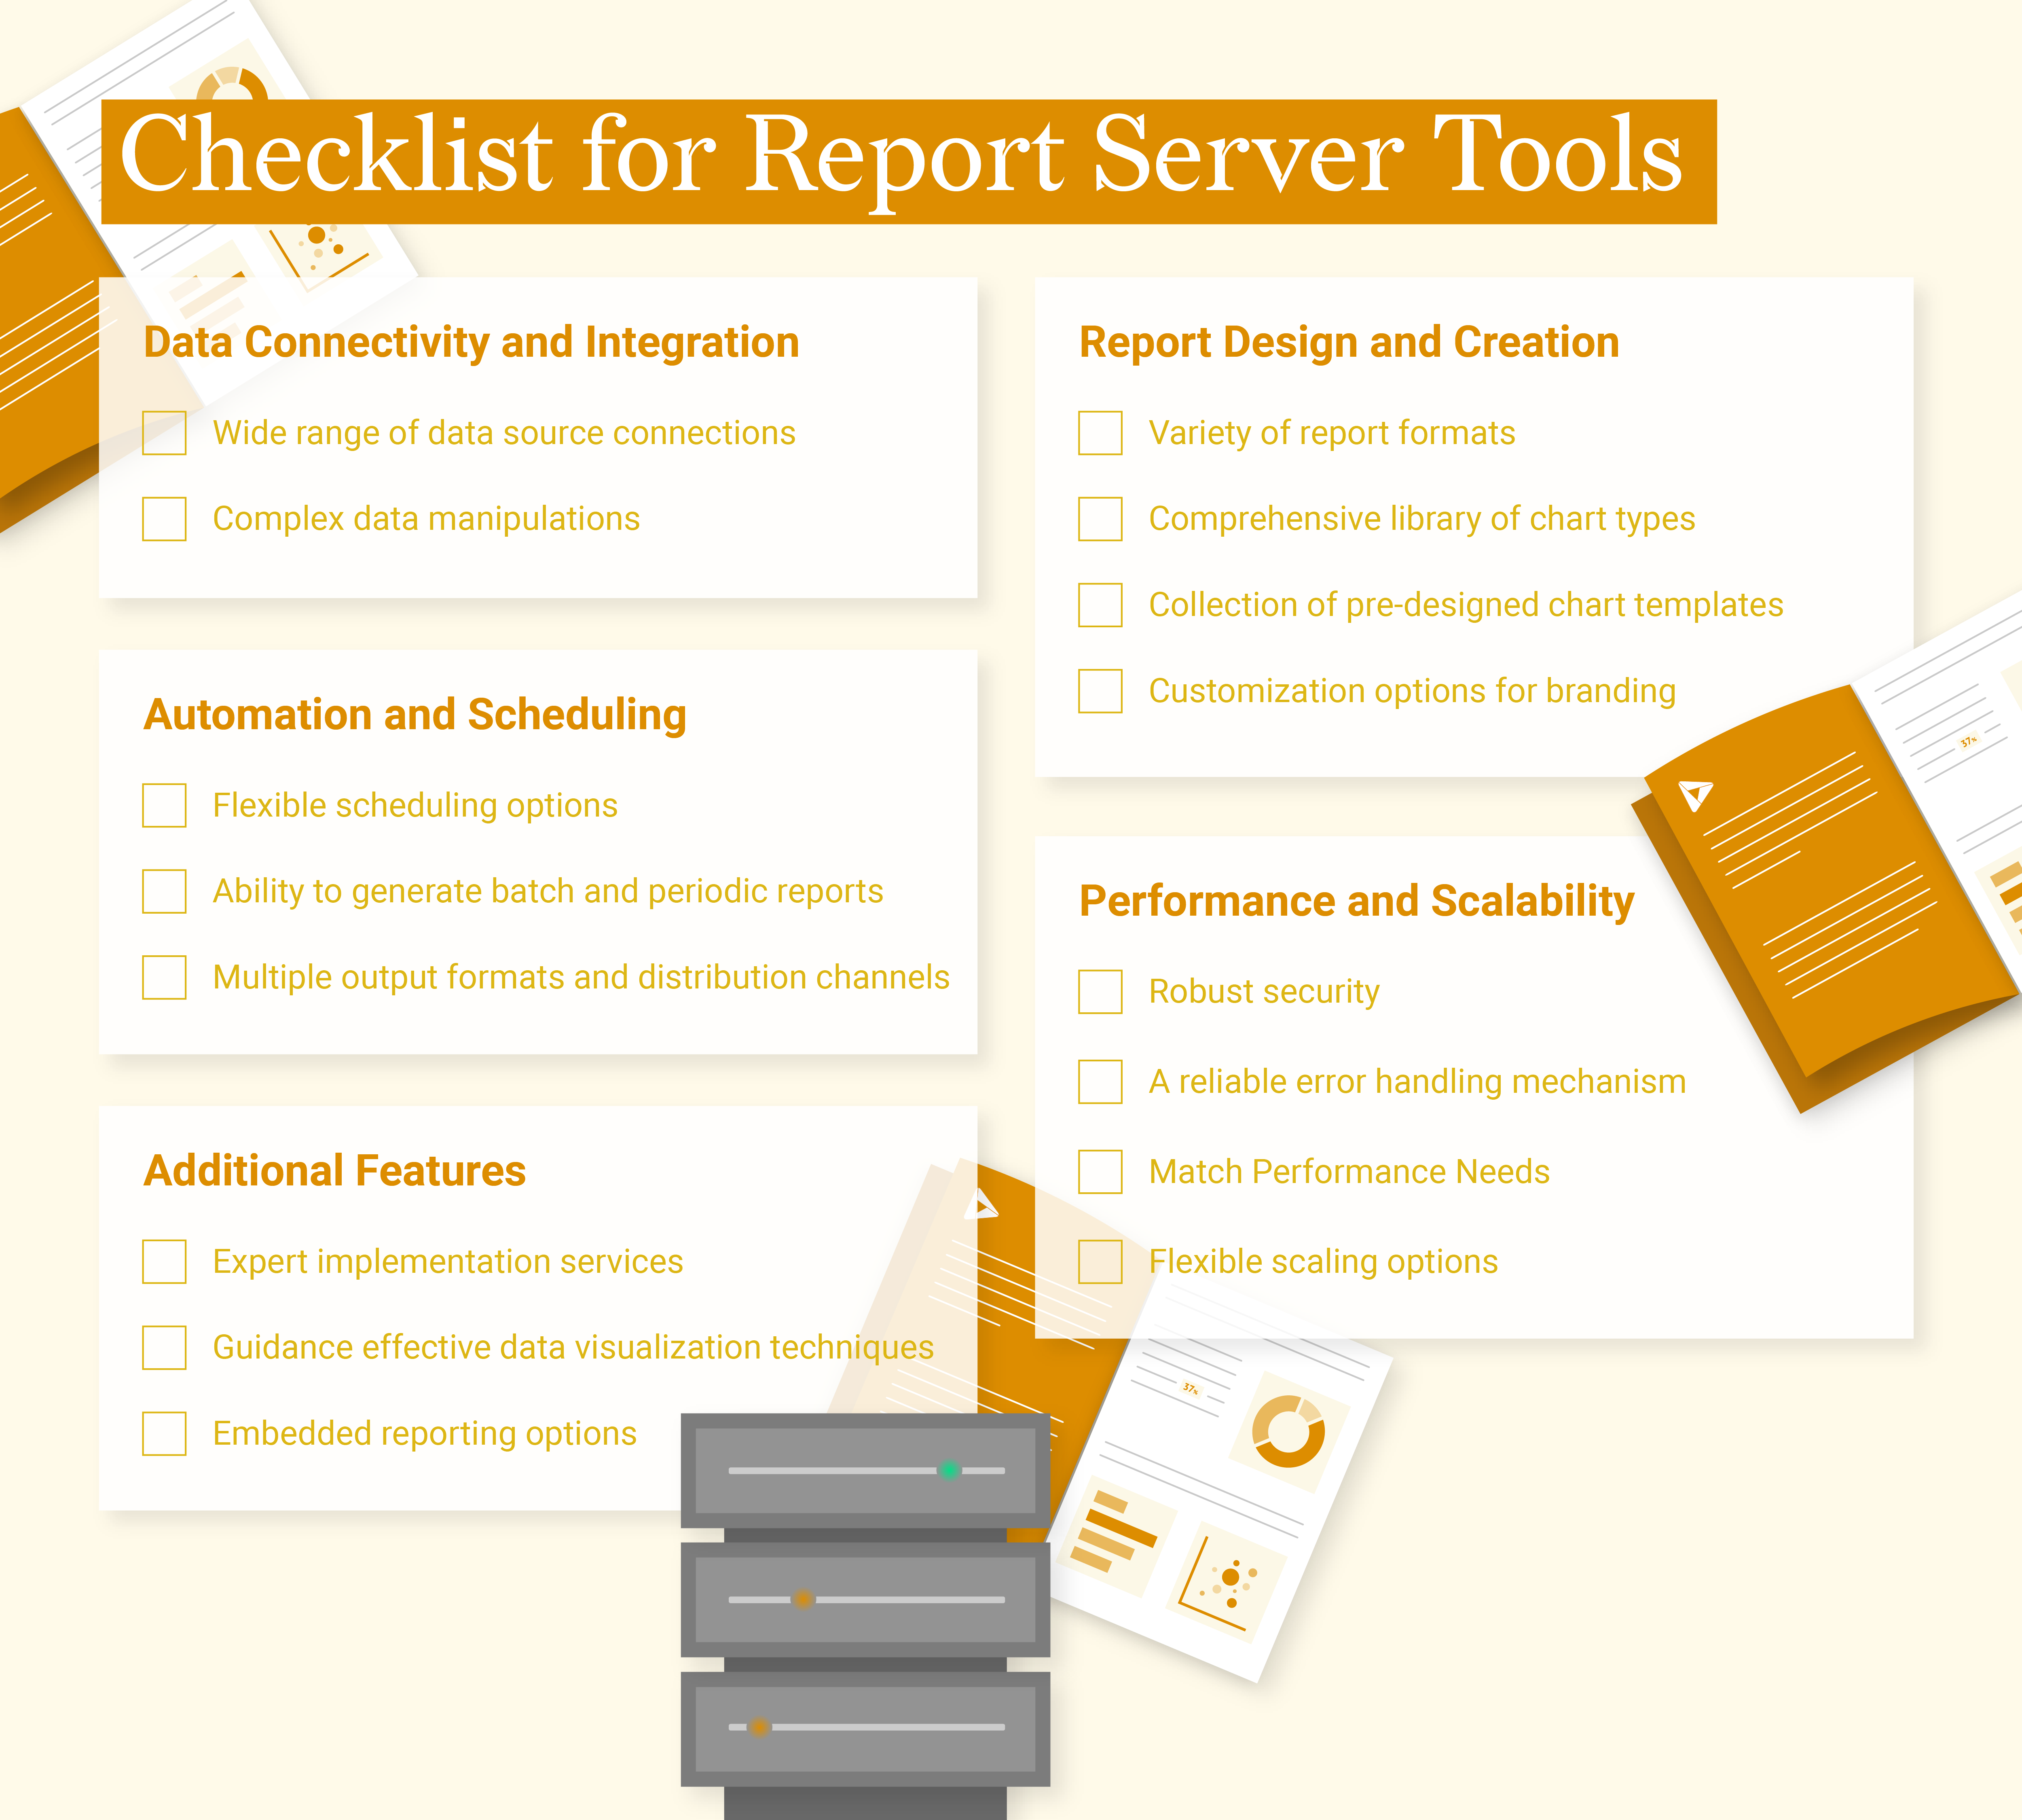
- Data Connectivity: The solution should offer seamless connections to a wide range of data sources, for example, relational databases (SQL Server, Oracle, MySQL), cloud-based data warehouses (Snowflake, Amazon Redshift), spreadsheets (Excel), and various APIs. Consider the ability to connect to real-time data sources for up-to-date insights. If the tool lacks built-in connectivity, explore whether custom development services are available.
- Data Transformation Capabilities: Robust data transformation features are essential for cleaning, filtering, and aggregating data into a usable format. Look for tools that support complex data manipulations, such as calculations, joins, and data blending, to derive meaningful insights. Consider custom development options if the tool doesn't offer the necessary data transformation features.
Report Design and Creation
- Report Types: A versatile report server tool should support a variety of report formats, including charts, infographics, and multi-page reports. The ability to create custom report layouts and templates provides flexibility in meeting diverse reporting needs.
- Chart Types: A comprehensive library of chart types is crucial for effective data visualization. Beyond basic charts, look for options like statistical charts (histogram, box plot), financial charts (candlestick, waterfall), and correlation charts (scatterplot, heatmap) to cater to different data analysis requirements.
- Pre-build visualizations and templates: A robust template library, including pre-built options and the ability to create custom designs, significantly accelerates report creation and enhances visual appeal. Industry-specific templates can further streamline the design process, while a centralized template library enables easy sharing and reuse of templates across the organization.
- Customization and Branding: Flexible design options allow you to tailor reports to match your organization's branding and visual identity. Look for tools that offer customization features for fonts, colors, logos, and report layouts.
Automation and Scheduling
- Scheduling: Automated report generation saves time and ensures timely delivery of information. Look for tools that offer flexible scheduling options, including recurring reports, and event-triggered reports.
- Flexible Reporting: The ability to generate both batch and periodic reports provides flexibility to meet different reporting needs. Consider the tool's performance in handling large-scale report generation.
- Diverse Output Delivery: Support for multiple output formats (PDF, PNG, SVG, HTML, etc.) and distribution channels (email, print) ensures that reports can be accessed and consumed in various ways.
Performance and Scalability
- Robust Security: Data security is paramount in report server tools. Look for features like data encryption along with using a vpn, to always keep your sensitive data and designs secure.
- Error Handling and Notification: A reliable error-handling mechanism is a good add-on for identifying and resolving issues promptly. Effective notification systems keep users informed about report generation status and failures.
- Match Performance Needs: Select a report server that seamlessly handles your data volume while delivering reports promptly. Evaluate the tool's performance metrics, scalability options, and cost to find the ideal balance for your specific needs.
- Scalability: Look for tools that offer flexible scaling options to accommodate future needs.
Additional Features
- Expert Implementation Services: Dedicated implementation support can help you maximize the value of your report server tool. Consider the availability of training, consulting, and customization services.
- Visualization Best Practices: Guidance on effective data visualization techniques can help you create clear and compelling reports. Look for tools that offer access to expert resources.
- Embedded Reporting: Integration with other business applications enhances data accessibility and workflow automation. Consider the tool's options to integrate reports into your application.
By carefully evaluating these features, you can select a report server tool that aligns with your organization's specific needs and drives data-driven decision-making.
Conclusion: Choosing the Right Report Server Tool
The demand for accurate, timely, and insightful reports has never been higher. Manual report creation is a time-consuming and error-prone process that can hinder decision-making. Automated report server tools offer a transformative solution by streamlining report generation, enhancing data accuracy, and enabling organizations to focus on strategic initiatives.
By carefully considering key features such as data connectivity, report design capabilities, automation options, and performance, businesses can select a report server tool that aligns with their specific needs. A well-implemented solution can drive significant improvements in efficiency, productivity, and overall business performance.
Datylon Report Server stands out as a powerful platform for automated and embedded reporting. With it's ability to automate the publication of the most visually appealing and informative reports using carefully designed templates, Datylon empowers organizations and individuals to make data-driven decisions with confidence.
To explore how Datylon can benefit your organization, book a demo with our experts today. Our experts are ready to guide you through the process and demonstrate how our solution can improve your reporting capabilities.
👉If you're keen on crafting custom data visualizations, visit our Bespoke Data Visualization Solution page, where we showcase numerous examples of our past projects.
Additional Resources
What is automated data reporting? A complete guide
Climbing the Ladder of Automated Reporting Solutions with Datylon
The Great Report Debate: Manual, Automated, or Interactive?
Automated reports: Defining Data Resources, Data Extraction and Transformation Options
Mastering Versioned Stand-Alone Reports
Building an automated reporting solution with Datylon Report Server
Automated reporting for various industries:
Revolutionizing Marketing and Media: The Power of Automated Reporting
Automated Reporting in Asset and Wealth Management: Trends and Best Practices
Boosting Efficiency: How Automated Reporting Transforms Associations
The Power of Automated Reporting in the Pharmaceutical Industry
Why embedded reporting is a game changer for SaaS companies

Dieuwertje van Dijk - Data Visualization Designer
Data, graphic design, illustration, food and mountains let her dopamine neurons spark on a daily basis. Most of the year she lives in Georgia where she spends her free time enjoying nature in a rooftop tent, eating khinkali and drinking wine.


