Datylon
  • Solutions
    • Chart Design
    • Report Design
    • Automated Reporting
    • ESG Report Publishing
    • Embedded Reporting
    • Bespoke Dataviz Solutions
    • Datylon Foundry - Software Services
  • Products
    • Datylon for Illustrator
    • Datylon Report Studio
    • Datylon for PowerPoint
    • Datylon ChartRunner
    • Datylon Report Server
  • Pricing
  • Resources
    • Help Center
    • Inspiration
    • Chart Library
    • Blog
    • Customer Stories
    • FAQ
  • Contact us
Sign in
Explore free options
Blog> Product News

What's new in Release 54

SHARE

Product update - release 54

We're excited to announce the revitalization of our Datylon online platform, with the newly named Datylon Report Studio as the central hub.

It's a space where you can effortlessly produce reports using templates created in Datylon for Illustrator or the Datylon online chart maker. 

If you haven't had a chance yet, we invite you to explore Report Studio and generate stunning reports with ease.

Sign in to Datylon Report Studio and enjoy the new version of the most advanced report maker!


DATYLON REPORT STUDIO

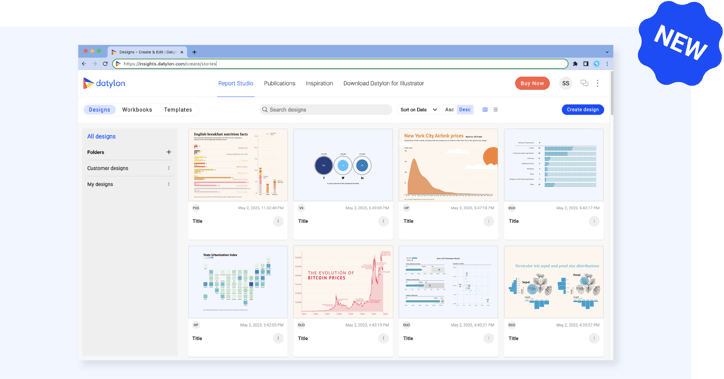
Polished Datylon workspace

Users who use a lot of templates, either to create reports manually or automatically with Datylon Report Server, can enjoy some more file management features such as search, sorting and different views. This is only the start of more, so stay tuned!

datylon-release-R54-image1

Sign in to Datylon Report Studio →


DATYLON FOR ILLUSTRATOR, DATYLON ONLINE
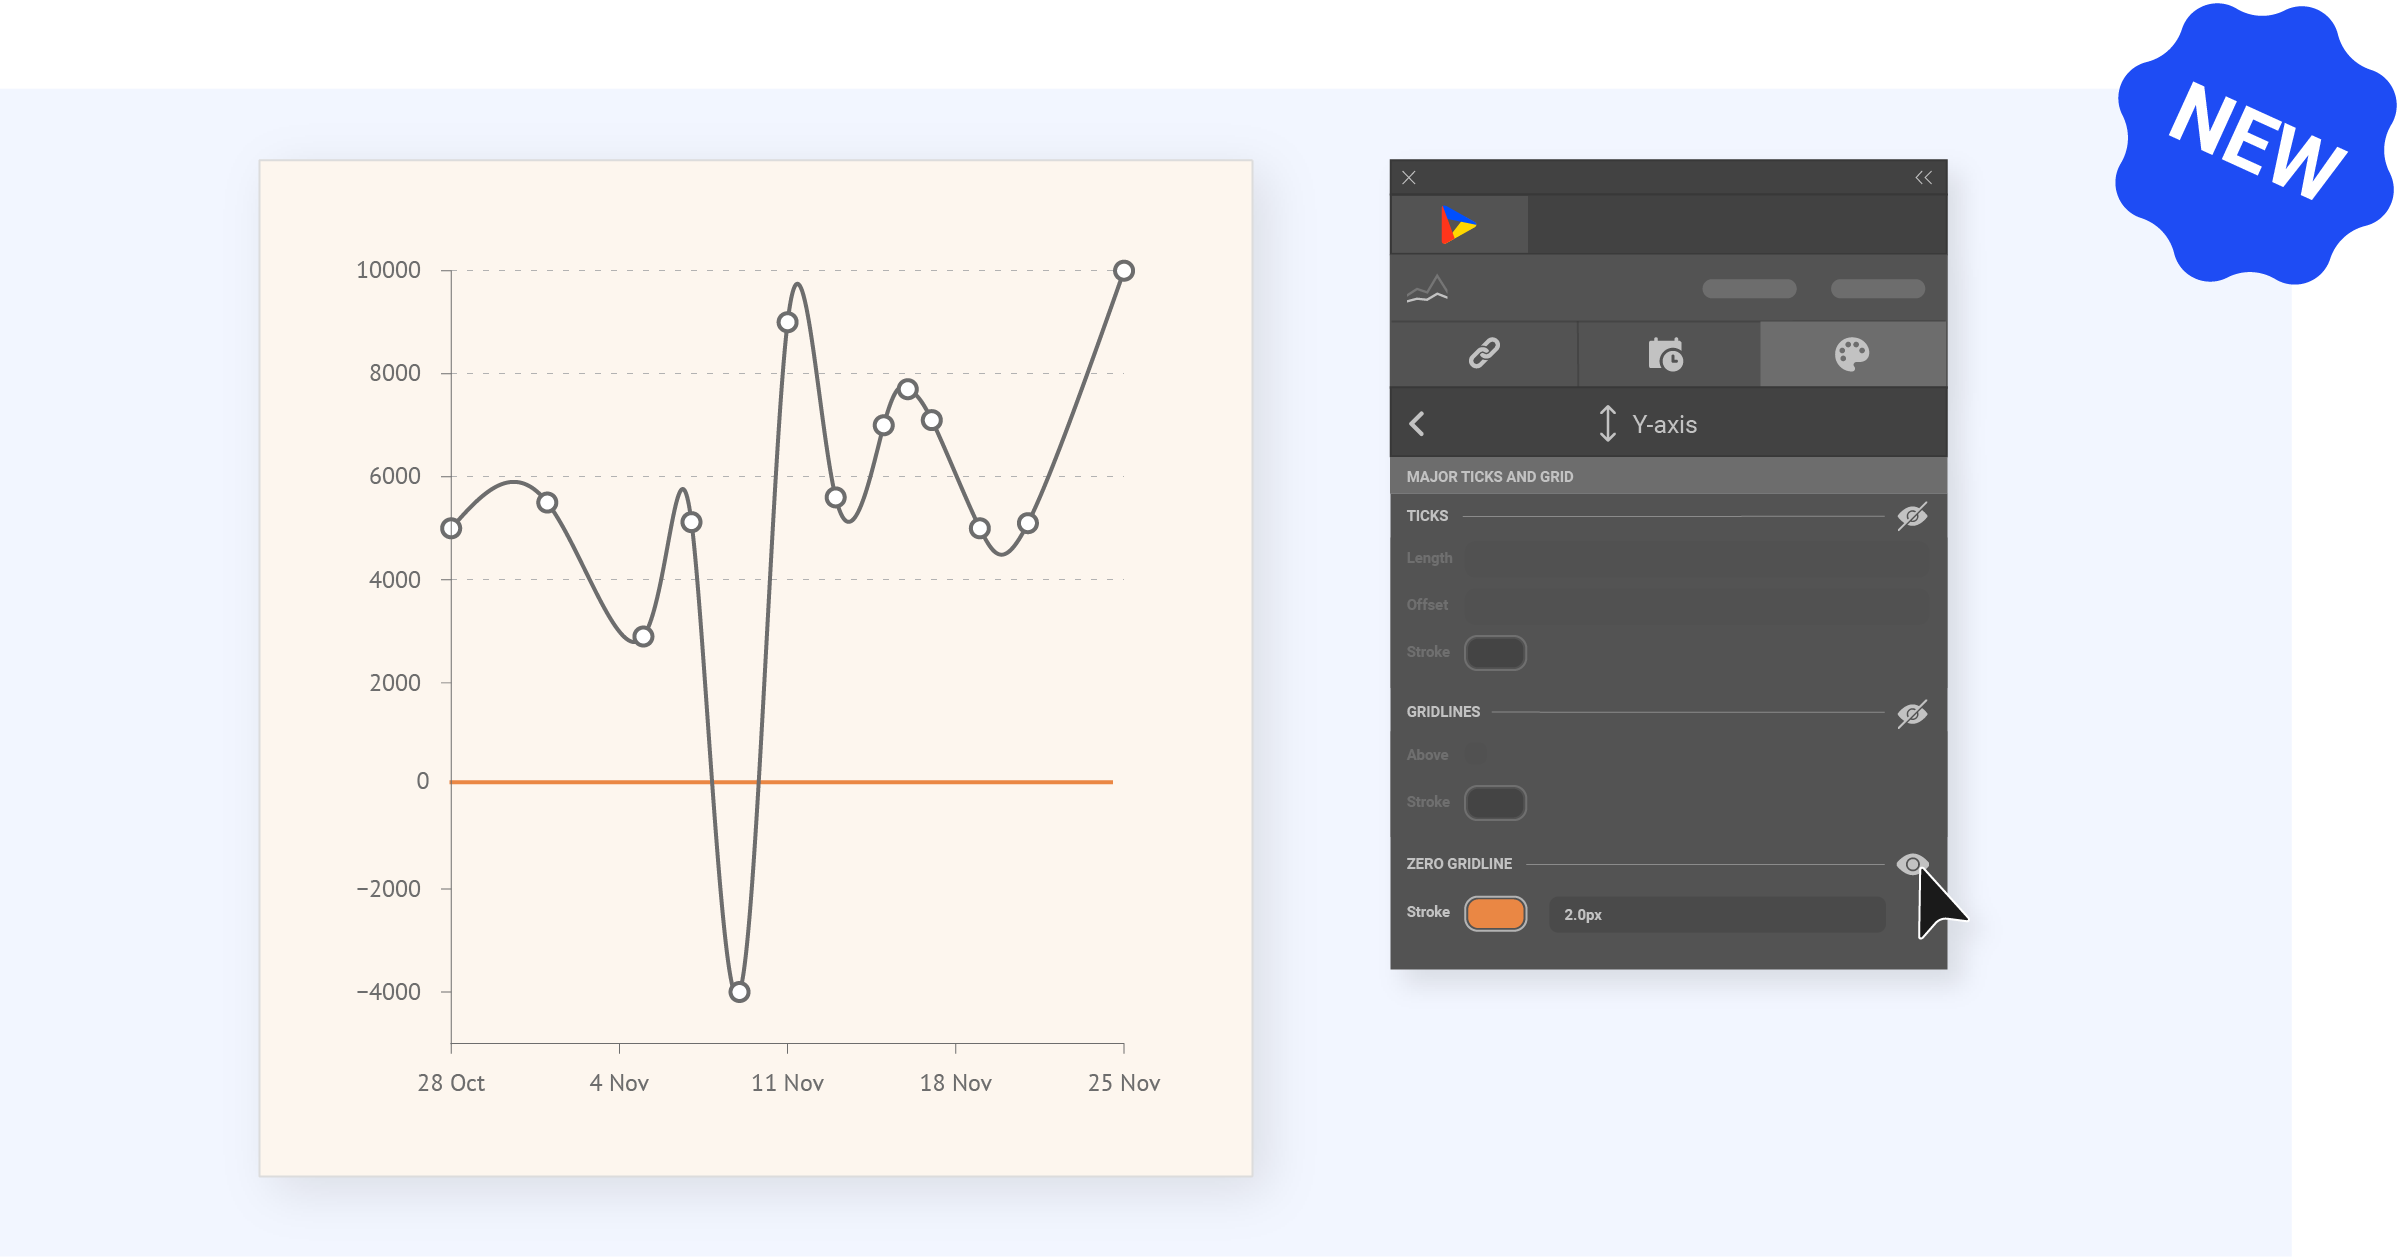
Off the grid

For all charts where applicable, the zero gridline can now be styled differently from the other gridlines allowing you to highlight it as a reference in your chart, next to the axes.

datylon-release-R54-image2
Download Datylon for Illustrator, R54 →


And as always, we also fixed a bunch of smaller issues.

Are you missing a feature? Use this link to request it now, so we can try to make it happen for the next releases!

Related blog posts

Datylon chart maker - new release 51
Product News

What's new in Release 51

Today we released yet another Datylon version packed with improvements and new features on...

Read more
The header of the blog shows a logo of Datylon with an icon symbolizing the process of updating. The text in the image reads
Product News

What's new in Release 52

Happy New Year! 🎉 We hope this year is full of great health and happiness. Until then, cheers to...

Read more

Subscribe to our newsletter

Receive inspiration, practical advice, customer stories and news right in your mailbox.

Newsletter
Company
  • About us
  • Jobs
  • Contact us
  • Data security
  • Datylon reviews
Solutions
  • Embedded Reporting
  • Automated Reporting
  • Chart Design
  • Report Design
  • ESG Reporting
  • Bespoke Solutions
  • Software Services
Product
  • Datylon Report Studio
  • Datylon Report Server
  • Datylon for Illustrator
  • Datylon ChartRunner
  • Datylon for PowerPoint
  • Datylon Enterprise
  • Pricing
  • Free trial
  • Release notes
Resources
  • Chart library
  • Inspiration
  • Blog
  • Customer stories
  • FAQ
  • Help center
  • Video tutorials
Create
  • Area chart
  • Bar chart
  • Bubble chart
  • Bullet chart
  • Density plot
  • Dot plot
  • Heatmap
  • Histogram
  • Icon array
  • Icon chart
  • Line chart
  • Pie chart
  • Range plot
  • Scatter plot
  • Stream graph
  • Treemap
Learn
  • Tips for report design
  • Do you speak data?
  • Do you speak dataviz?
  • Effective dataviz guide
  • 80 types of charts
  • 9 types of dataviz
  • Best dataviz tools
  • Charts for colorblind
  • Accessible charts
  • Break the rules
  • Dataviz in Illustrator
  • Datylon vs. Illustrator
  • Static or interactive?
  • Outside the box charts
  • Mind your dataviz
  • Data storytelling

All rights reserved. © 2025 Datylon BV

  • Legal Terms
  • Privacy Policy

Manage Cookies