Datylon
  • Product
    • Product Overview
    • Datylon Chart Library
    • Datylon for Illustrator
    • Datylon Server
    • Datylon Enterprise
  • Inspiration
  • Pricing
  • Projects
  • Resources
    • Customer Stories
    • Blog
    • FAQ
    • Help Center
  • About us
    • Why Datylon
    • Jobs
Sign in
Get started
Blog> Product News

What's new in Release 39

Stijn Simoens - Partner & Head of Customer Success
June 09, 2020
SHARE

It's time again for some new improvements and additions to our charting platform. We invested in our web app to facilitate online collaboration and made this available as a free plan so charts can be easily shared with more people. An icon chart was added to the chart library and the styling options were improved. 

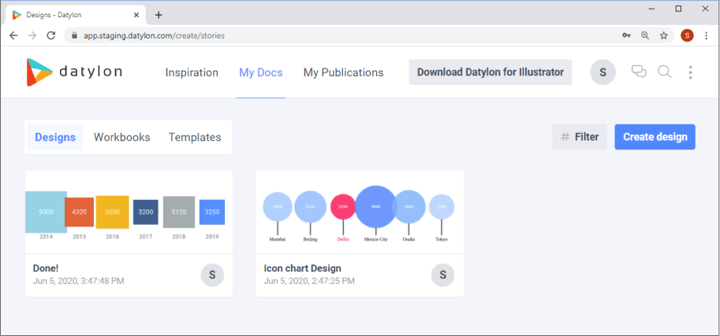
Online collaboration

With more and more people working from home, remote teams need to stay productive no matter where they’re working from. By stepping up our investments in our web app, Datylon now also helps you automate your workflow and collaborate online:

  • You can share chart templates with other people who can then view, edit and update your templates with new data — without losing your styling efforts;
  • Charts and reports can be published online, shared via email, social, embedded on your blog or website, or exported in different formats.

Datylon Chart Maker web app supports online collaboration

Learn more about the differences between our web app and Datylon for Illustrator in this article.


Free plan

Because your charts matter even more when they are being shared, we created a Free Plan that includes all functionalities in our web app. Cancel anytime. No credit card required.

View our pricing plans or contact sales for more info.


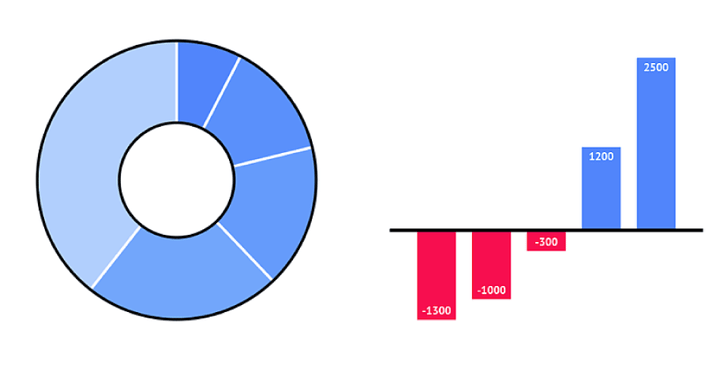
New chart: icon chart

Icon charts are great for showing your audience an overall comparison between usually smaller sets of data. You can scale and color icons for this chart type: two properties that are very popular in business communication or media.


Datylon icon chart

Of course you maintain full creative control over your designs, thanks to the advanced styling options available. For more info on how to create an icon chart with Datylon, view the Icon Chart Video Tutorial

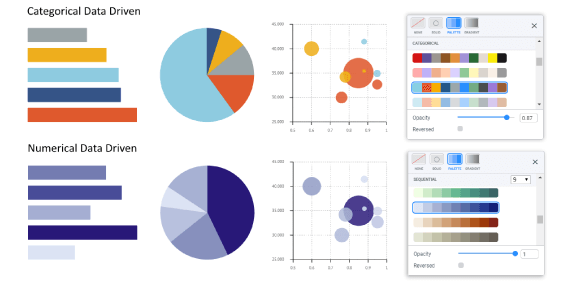
Even More Styling Options

  • More stroke options around and between slices of a pie chart
  • Negative text tracking enabled for labels
  • Palettes can be filtered down to 2 colors


Even more styling options


We continue our mission

With your feedback, you can help us fulfill our mission. Don’t hesitate to reach out and talk to us on Twitter, via chat or email.

Your #chartsmatter #staysafe and keep designing !


Stijn Simoens - Partner & Head of Customer Success

The Datylon user group is a rapidly growing community and Stijn is striving for Datylon's customers success. Need help? Talk to Stijn.

Related blog posts

Datylon release R42 provides new features that speed up your chart design
Product News

What's new in Release 42

Here at Datylon, we are working flat-out to make our chart maker the perfect home for your chart...

Read more
New default charts in Datylon Chart Library
Product News

What's new in Release 41

Although we are in the middle of a hot summer at this side of the globe, we keep on working hard to...

Read more

Subscribe to our newsletter

Receive inspiration, practical advice, customer stories and news right in your mailbox.

Newsletter
Company
  • About us
  • Projects
  • Jobs
  • Contact us
  • Data security
  • Datylon reviews
Product
  • Product overview
  • Chart library
  • Datylon for Illustrator
  • Datylon Server
  • Datylon Enterprise
  • Pricing
  • Release notes
  • Free trial
  • Charts in InDesign
Resources
  • Inspiration
  • Customer stories
  • Blog
  • FAQ
  • Help Center
  • Video tutorials
Create
  • Graph maker
  • Illustrator chart plugin
  • Pie chart maker
  • Bar graph maker
  • Line graph maker
  • Scatter plot maker
  • Bubble chart maker
  • Dot plot maker
  • Free chart maker
Learn
  • Getting started with Datylon for Illustrator
  • Getting started with Datylon web app
  • Mind your data visualization
  • 9 types of data visualization
  • The best charts for color blind viewers
  • 80 types of charts & graphs
  • A guide to effective data visualization
  • The best data visualization tools

    All rights reserved. © 2023 Datylon BV

    • Legal Terms
    • Privacy Policy

    Manage Cookies