Datylon
  • Solutions
    • Chart Design
    • Report Design
    • Automated Reporting
    • ESG Report Publishing
    • Embedded Reporting
    • Bespoke Dataviz Solutions
    • Datylon Foundry - Software Services
  • Products
    • Datylon for Illustrator
    • Datylon Report Studio
    • Datylon for PowerPoint
    • Datylon ChartRunner
    • Datylon Report Server
  • Pricing
  • Resources
    • Help Center
    • Inspiration
    • Chart Library
    • Blog
    • Customer Stories
    • FAQ
  • Contact us
Sign in
Explore free options
Blog> Product News

What's new in Release 42

Stijn Simoens - Co-founder & Head of Customer Success
November 03, 2020
SHARE

Datylon Product Update R42 - What's new?

Here at Datylon, we are working flat-out to make our chart maker the perfect home for your chart design. With our new release (R42), the Datylon online chart maker and Datylon for Illustrator now contain even more built-in chart templates, next to new features to increase productivity and reduce manual repetitive work.

This new version of Datylon for Illustrator runs on Adobe CC 2021 (v25, released October 2020), so you can now benefit from the latest features of both Illustrator and Datylon.


DATYLON CHART LIBRARY

Power up with our expanded chart library

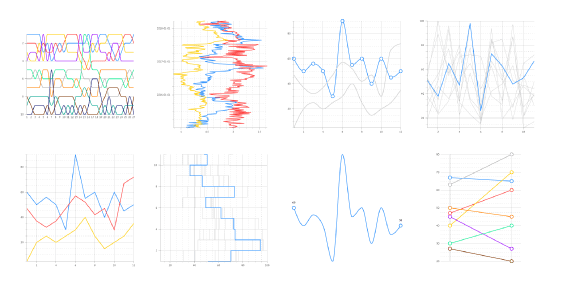
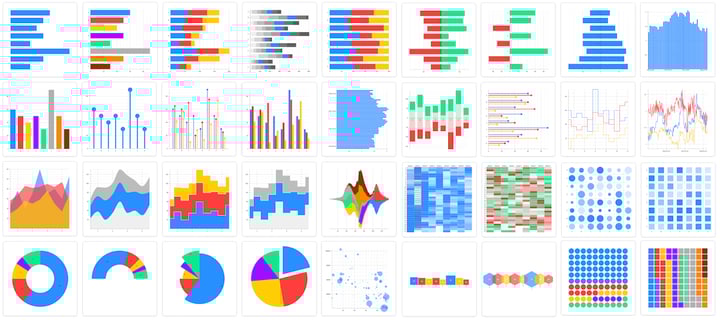
The built-in Datylon chart library now contains over 120 chart templates that will help you create charts quicker, easier and with more variation. They can also be used to create your own on-brand custom templates. Discover all chart templates. 


Datylon chart library now contains over 120 chart templates


DATA MANAGEMENT

Gain time with 'Swap workbook' functionality

The 'Swap workbook' button is a bit hidden in the data management tool but oh so efficient when data changes frequently and/or last minute while designing charts. In one click you can update a complete workbook containing multiple data sheets. And now, your data point styling and formatting settings are kept reducing the manual work to none when updating charts. Read more about data management.


Gain time with 'swap workbook' functionality


ADVANCED STYLING OPTIONS

From zero to hero

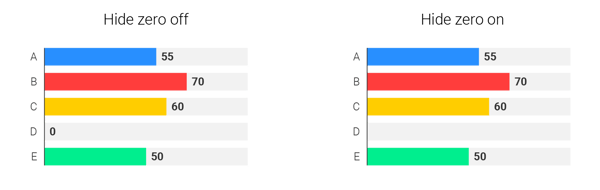
Yet another useful Datylon styling option. Sometimes a zero in your data is very significant. Sometimes it is not. You can now choose to show or hide zero’s in your data labels for Bar, Pie, Icon and Bullet charts. Discover more styling options.


Flexible styling option for your zero's


DATYLON CHART MAKER WEB APP

Improved UX & reducing clicks 

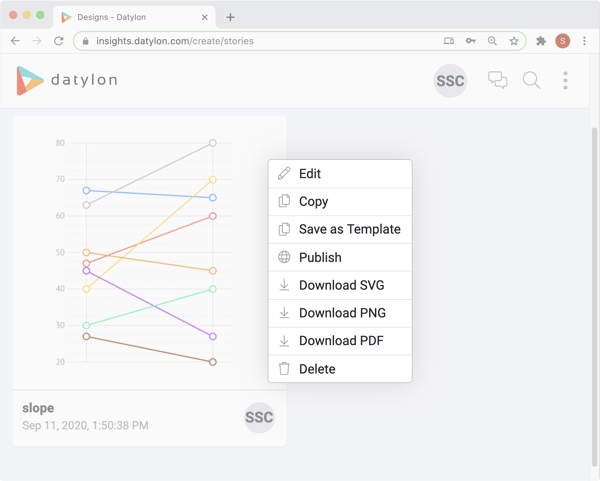
Simply by using 'Control-Click' or 'Right-Click', you get a shortcut menu with all the relevant options for any of your designs, workbooks or templates. For instance, creating a copy or a template from a design is now literally just one click away.   


Datylon chart maker web app has improved ux


We hope we have given you plenty of reasons to join the growing community of Datylon users. Try out our online chart maker and discover the above and other features for free.

You may also learn more about how you can supercharge your chart design, online and in Illustrator with a free expert demo session.

Your #chartsmatter and enjoy designing! 😉 


Stijn Simoens - Co-founder & Head of Customer Success

Stijn Simoens - Co-founder & Head of Customer Success

The Datylon user group is a rapidly growing community and Stijn is striving for Datylon's customers success. Need help? Talk to Stijn.

Related blog posts

New default charts in Datylon Chart Library
Product News

What's new in Release 41

Although we are in the middle of a hot summer at this side of the globe, we keep on working hard to...

Read more
Datylon bullet chart, Datylon further develops data point styling
Product News

What's new in Release 38

We are happy to announce once again a new release of Datylon! This time we added the bullet chart...

Read more

Subscribe to our newsletter

Receive inspiration, practical advice, customer stories and news right in your mailbox.

Newsletter
Company
  • About us
  • Jobs
  • Contact us
  • Data security
  • Datylon reviews
Solutions
  • Embedded Reporting
  • Automated Reporting
  • Chart Design
  • Report Design
  • ESG Reporting
  • Bespoke Solutions
  • Software Services
Product
  • Datylon Report Studio
  • Datylon Report Server
  • Datylon for Illustrator
  • Datylon ChartRunner
  • Datylon for PowerPoint
  • Datylon Enterprise
  • Pricing
  • Free trial
  • Release notes
Resources
  • Chart library
  • Inspiration
  • Blog
  • Customer stories
  • FAQ
  • Help center
  • Video tutorials
Create
  • Area chart
  • Bar chart
  • Bubble chart
  • Bullet chart
  • Density plot
  • Dot plot
  • Heatmap
  • Histogram
  • Icon array
  • Icon chart
  • Line chart
  • Pie chart
  • Range plot
  • Scatter plot
  • Stream graph
  • Treemap
Learn
  • Tips for report design
  • Do you speak data?
  • Do you speak dataviz?
  • Effective dataviz guide
  • 80 types of charts
  • 9 types of dataviz
  • Best dataviz tools
  • Charts for colorblind
  • Accessible charts
  • Break the rules
  • Dataviz in Illustrator
  • Datylon vs. Illustrator
  • Static or interactive?
  • Outside the box charts
  • Mind your dataviz
  • Data storytelling

All rights reserved. © 2025 Datylon BV

  • Legal Terms
  • Privacy Policy

Manage Cookies