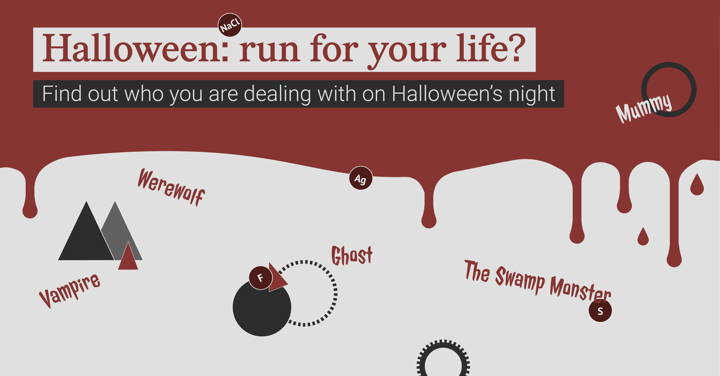
It’s that time of the year again when you shouldn’t be surprised if you bump into terrifying-looking people with teeth covered in blood. Or… are they really people? So you’d better be prepared if this happens to you. Read this infographic and you will know why you should stuff your pockets on Halloween with salt, your grandma’s silver earrings, a bottle of water, and a lighter.
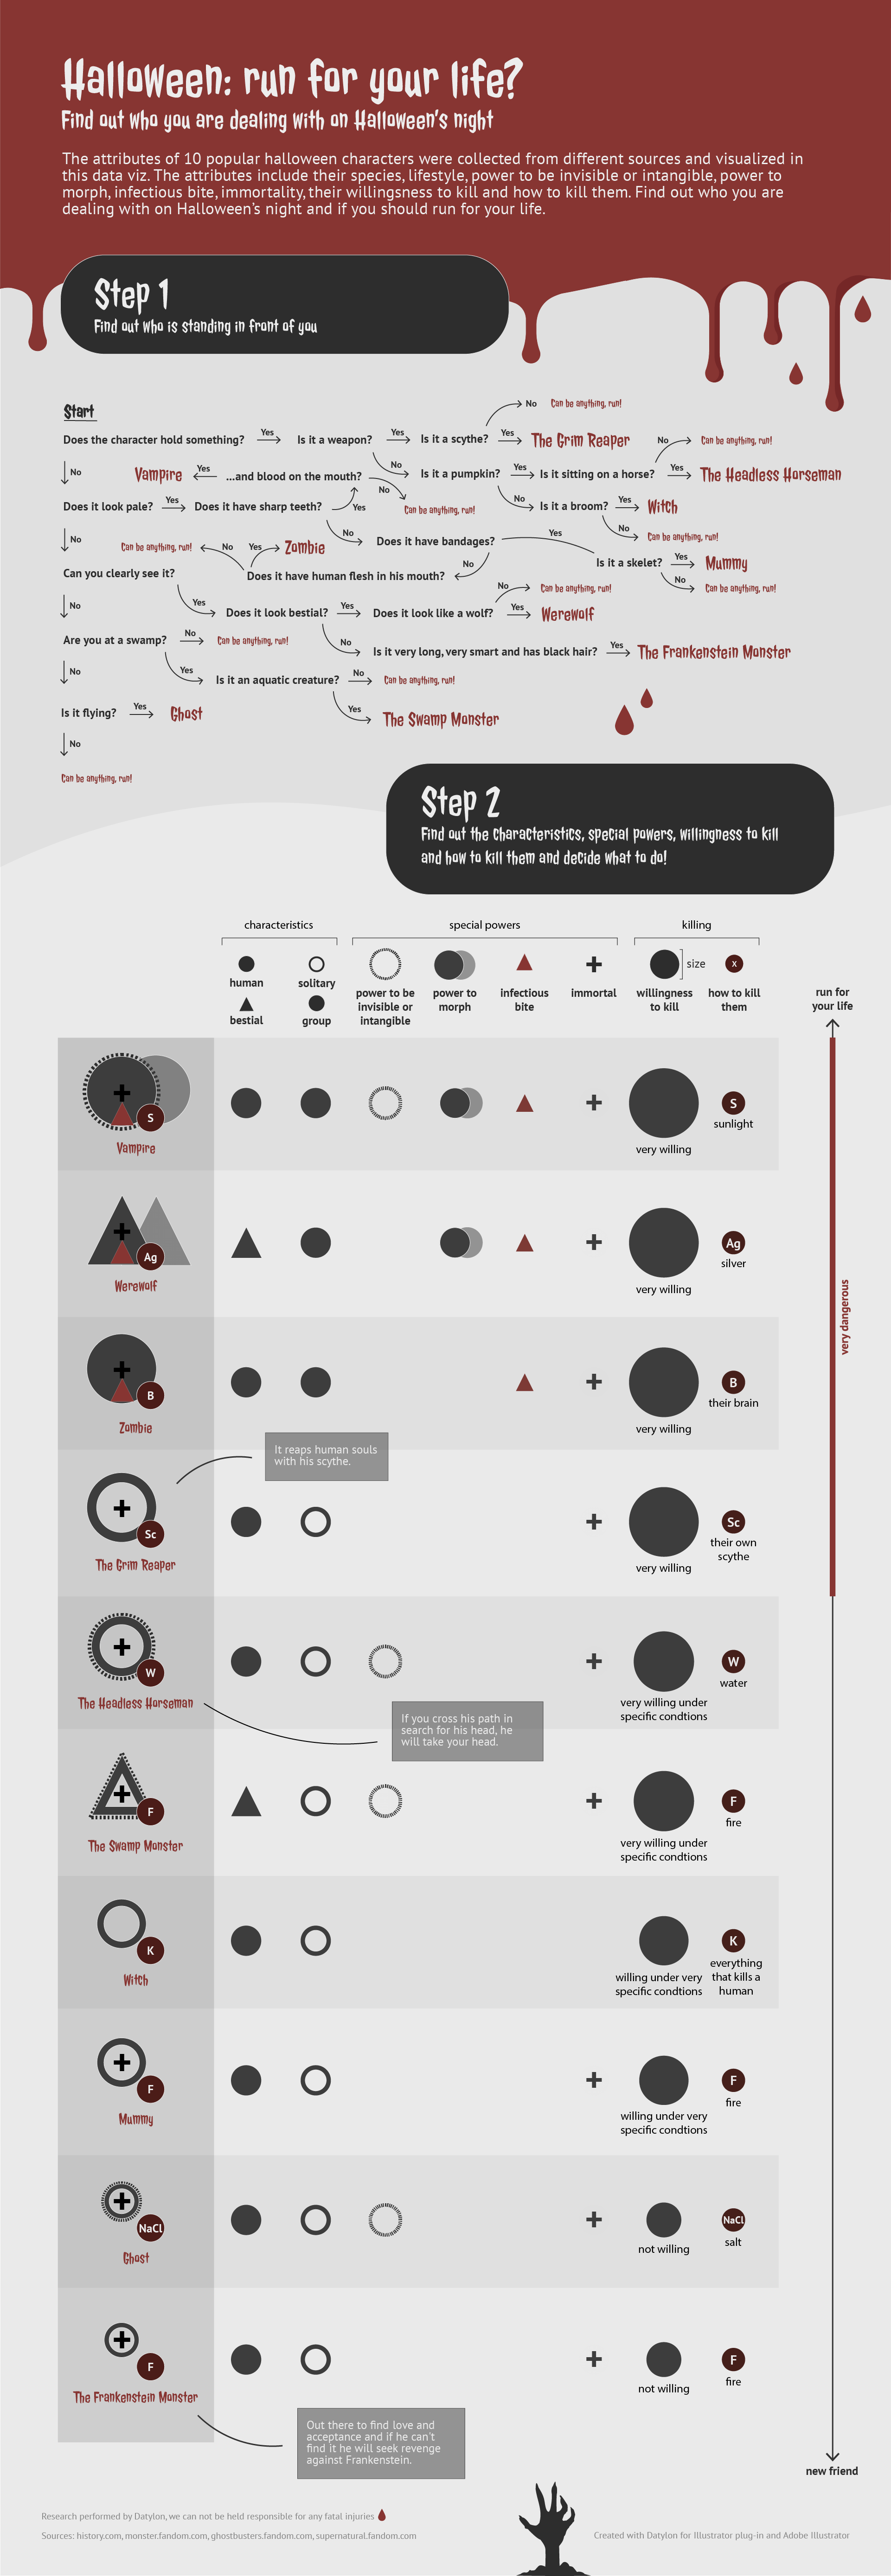
To help people know what to expect today, we researched ten popular Halloween characters you might come across, depending on how unlucky you are. We collected data about their characteristics including their species and lifestyle. Secondly, we collected data about their special powers such as invisibility or intangibility, the power to morph (shapeshifting), if they have an infectious bite, and if they are immortal. Lastly, we analyzed their willingness to kill you and how you can kill them. But we advise you not to try to kill anyone and for legal reasons, we always recommend you to run, as we don’t want to be held accountable.
Follow the steps to find who you are dealing with, what you can expect from them, and how to kill them if that could save your life.
Interested in learning how to craft a holiday-themed data visualization similar to this one? Continue reading below the infographic for a detailed guide.
How a holiday-themed data visualization can be created
Step 1: Collect holiday-themed data
If you are lucky, you might be able to find a complete holiday-themed or season-themed dataset that matches your initial idea. However, sometimes it might be the case that you have to create your dataset around the topic.
For the infographic in this blog article, we gathered data from different sources about ten popular Halloween characters. We collected data about their characteristics, special powers, willingness to kill you, and how you can kill them.
While creating your dataset may require additional effort, it can also be an enjoyable process.
Step 2: Select the suitable chart types for your data and create them
Data visualizations with a holiday theme demand a unique and creative approach compared to regular ones. It's your opportunity to showcase your skills and create a memorable visualization that captures the essence of the season.
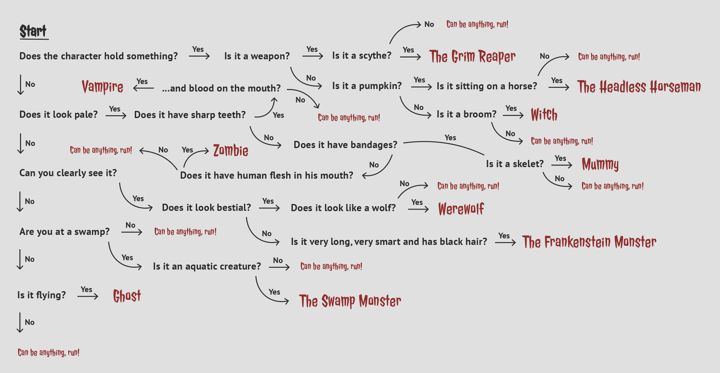
For the first part of this infographic, we created a decision tree with Adobe Illustrator to find out what character is most probably standing in front of you and what to do if you can not determine the character.
This type of chart is most commonly used in decision analysis and determines consequences based on choices you make while going down the tree. Strategies can be found at the end of each branch, like in this infographic “Can be anything, run!”.
We chose not to put strategies at each end of the branches but to show you who you are dealing with instead. In the second part of the infographic, more information can be found about the characters on which you can base your strategy.
 Decision tree created with Adobe Illustrator
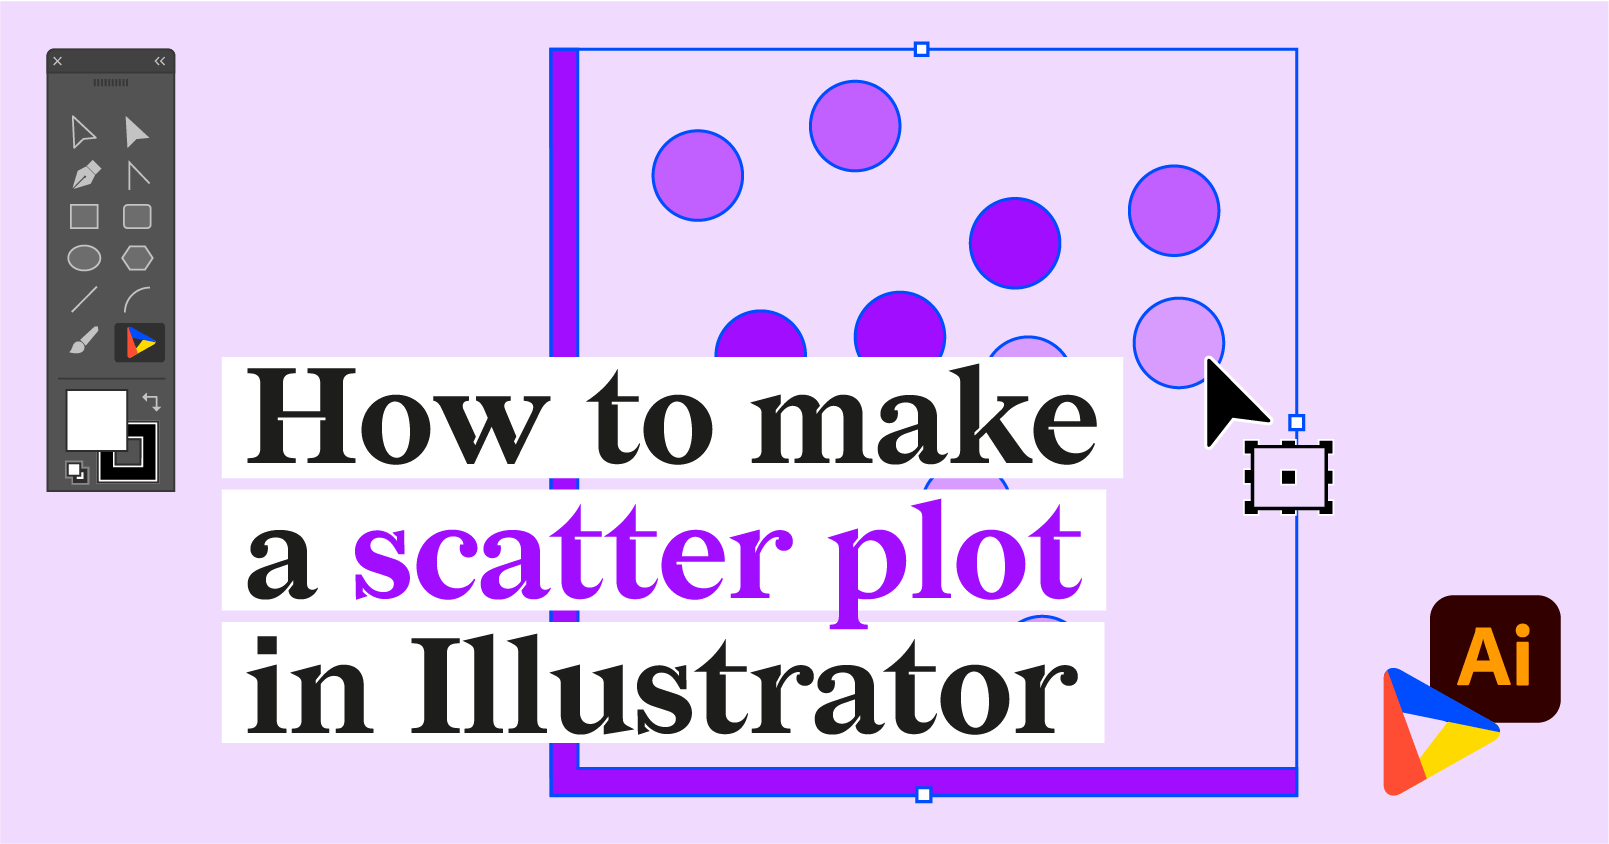
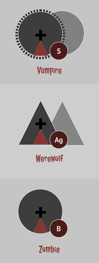
In the second part of the infographic, we created multiple scatter plots with the main attributes of the ten Halloween characters. These charts were created with the Datylon for Illustrator plug-in. The plug-in makes it very easy to create technical solid charts but makes it also possible to add visual elements to the infographic easily with Adobe Illustrator.
For the left part of the design, we created multiple scatter plots and accumulated them. We started with a scatter plot representing the characteristics of the characters, including their species (circle or triangle icons) and their lifestyle (filled or outlined icons). Moreover, this scatter plot also shows their willingness to kill (you or anyone on their way) by the size of the icon. Hereafter we added separate scatter plots for all the special powers and their weakness on top of the other scatter plot.
 Multiple scatter plots on top of each other created with Datylon for Illustrator
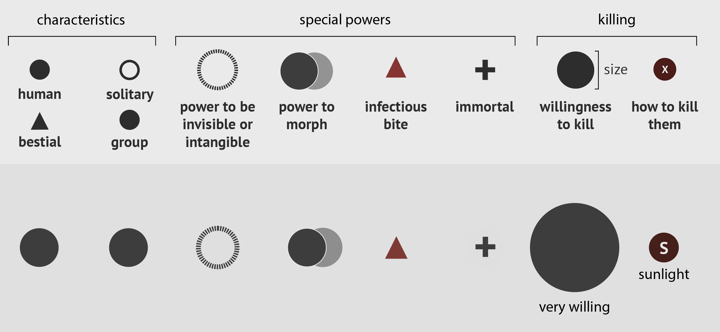
On the right side of the design you can find the same information but now in the form of an iconized checklist. This checklist was also created with a scatter plot with the Datylon for Illustrator plug-in. This checklist is at the same time a legend which makes it easy to interpret the data without looking back and forth between a legend and the visual. Moreover, the checklist makes it possible to easily find out how many of the characters have a specific attribute.
 Iconized checklist created with Datylon for Illustrator
Step 3: Add holiday-themed design elements, colors and fonts
When creating holiday-themed data visualizations, it's essential to infuse them with holiday-specific design elements, colors, and fonts. That's precisely what we also did with this infographic as well.
In addition to these elements, in this infographic we incorporated icons in our visualizations that directly corresponded to their intended meanings; for instance, using a red triangle to represent a contagious bite and a cross to symbolize immortality. Furthermore, in our aggregated scatter plots, we aimed to evoke the creepy feelings and unsettling atmosphere associated with Halloween.
Step 4: Revise revise revise
After a lot of revisions, we decided to use both the iconized checklist and the accumulated scatter plots although they both show the same data. At Datylon we think that both, evoking the right emotions and interpreting the data easily, are very important in data visualization.
Datylon also promotes the use of annotations for providing context to data, which is why we made it very easy to add them with the Datylon for Illustrator plug-in. Since probably not all of the characters are well known by the viewers, we added annotations to show the goal in life of some of the characters.
Automated reporting for recurring events
For recurring events like Halloween or other holidays, automated reporting can significantly optimize the process of creating and updating charts and reports. By setting up automated workflows, you can ensure that your visualizations are always up-to-date with the latest data without manual intervention.
While the specific example in this blog article may not be directly applicable due to the nature of the data, automated reporting can be a valuable asset for creating and maintaining recurring visualizations for a variety of events and topics.
Here's how it works with Datylon:
1. Template design: Design the chart or report template with the Datylon for Illustrator plugin.
2. Export template: Export the chart or report template to the Datylon Report Studio to become available for the Datylon Report Server.
3. Automation Setup: Connect with the Datylon Report Server via the API and provide a connection to the new data and the template ID.
4. Distribution: Automatically send the updated reports to relevant stakeholders via email or other channels.
Want to learn more about automating your recurring charts and reports? Book a demo or check out our dedicated blog article.
Happy Halloween 🎃 Please be safe.