Datylon
  • Solutions
    • Chart Design
    • Report Design
    • Automated Reporting
    • ESG Report Publishing
    • Embedded Reporting
    • Bespoke Dataviz Solutions
    • Datylon Foundry - Software Services
  • Products
    • Datylon for Illustrator
    • Datylon Report Studio
    • Datylon for PowerPoint
    • Datylon ChartRunner
    • Datylon Report Server
  • Pricing
  • Resources
    • Help Center
    • Inspiration
    • Chart Library
    • Blog
    • Customer Stories
    • FAQ
  • Contact us
Sign in
Explore free options
Blog> Product News

What's new in Release 45

Kosma Hess - Marketing Manager
May 28, 2021
SHARE

Datylon for Illustrator plugin & Datylon online chart maker new version R45 - now you can select multiple charts and discover our brand new identity

You asked, we listened! If you design charts and reports, sometimes you surely need to change the color, font, or another styling property for several charts. Editing every chart, one by one, was the only option. But now we have good news for you!

Our new updated Datylon version (R45) supports multi-selection, making updating your charts faster and more efficient. Freeing up your time for more design!

A few smaller updates and bug fixes make this release even better. Read more below.

Download Datylon for Illustrator now or sign in to the Datylon web app and enjoy the new version!


ADVANCED STYLING

Multi-selection


This new feature allows you to select multiple charts of the same type and change the common properties, all at once. It helps you to save time with faster styling. This is particularly useful in a production environment and for small multiples where by definition you want to style all the charts at the same time. Learn how to change multiple charts at once. 

Chart multi-selection


DATYLON

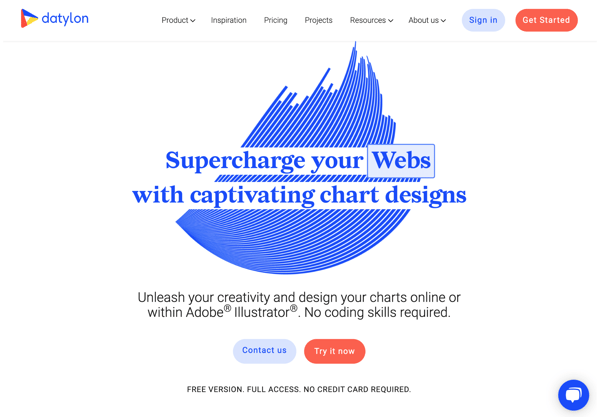
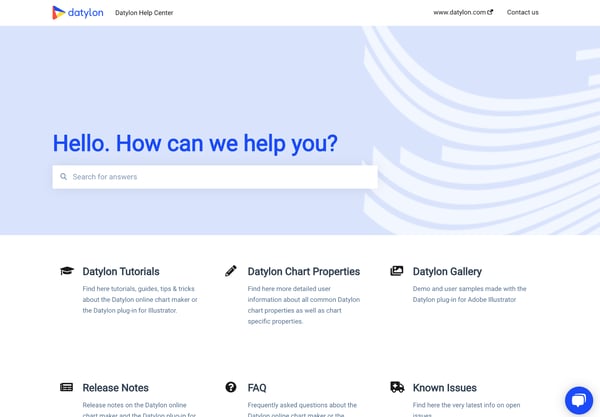
Updated brand identity


Good design is at the core of Datylon. We believe it is essential for creating easily understood and impactful data visualizations. But we felt that as a company we should also emphasize the importance of design in our overall brand identity. That’s why we gave our various domains - website, help center, and platform - an updated look & feel with more vibrant colors and illustrations. We hope you like it!

Datylon Website - Homepage R45

Datylon Website - Help Center R45


As usual, we work on spotting and eliminating any bugs to make your designing smoother. Read more in detail about all fixes in the R45 release notes in the Datylon Help Center. 

Don't forget to download the latest version of Datylon for Illustrator to benefit from all these improvements! Alternatively, you can also try them out in our Datylon web app. 

Your #chartsmatter and enjoy designing! 😉 

Kosma Hess - Marketing Manager

Kosma Hess - Marketing Manager

Global citizen, world traveler, content creator, marketing specialist, can't sing to save his life. In his free time, he's mastering Datylon for Illustrator for no reason.

Related blog posts

Datylon Product Update R43 - What's new?
Product News

What's new in Release 43

First of all, we wish you a healthy and inspiring 2021! Let's hope that we can soon go back to our...

Read more
Datylon Chart Maker Product Update R48 - What's new? Treemap chart / treemap graph and new arrows for a range chart
Product News

What's new in Release 48

The end of the year is approaching very soon. Although some of us at Datylon are still busy...

Read more

Subscribe to our newsletter

Receive inspiration, practical advice, customer stories and news right in your mailbox.

We are committed to protecting your privacy. For more information, please review our privacy policy.

Newsletter
Company
  • About us
  • Jobs
  • Contact us
  • Data security
  • Datylon reviews
Solutions
  • Embedded Reporting
  • Automated Reporting
  • Chart Design
  • Report Design
  • ESG Reporting
  • Bespoke Solutions
  • Software Services
Product
  • Datylon Report Studio
  • Datylon Report Server
  • Datylon for Illustrator
  • Datylon ChartRunner
  • Datylon for PowerPoint
  • Datylon Enterprise
  • Pricing
  • Free trial
  • Release notes
Resources
  • Chart library
  • Inspiration
  • Blog
  • Customer stories
  • FAQ
  • Help center
  • Video tutorials
Chart makers
  • Graph maker
  • Pie chart maker
  • Bar graph maker
  • Histogram maker
  • Line graph maker
  • Scatter plot maker
  • Bubble chart maker
  • Dot plot maker
Learn
  • Tips for report design
  • Do you speak data?
  • Do you speak dataviz?
  • Effective dataviz guide
  • 80 types of charts
  • 9 types of dataviz
  • Best dataviz tools
  • Charts for colorblind
  • Accessible charts
  • Break the rules
  • Dataviz in Illustrator
  • Datylon vs. Illustrator
  • Static or interactive?
  • Outside the box charts
  • Mind your dataviz
  • Data storytelling

All rights reserved. © 2025 Datylon BV

  • Legal Terms
  • Privacy Policy

Manage Cookies