

Draw on the full potential of Adobe Illustrator®
Datylon delivers dataviz capabilities equal to none right into Adobe's most powerful drawing software. Design stunning charts with our plug-in, then enrich them by adding annotations, titles, or any additional artwork using Illustrator's tools. Truly the best of both worlds.


Full freedom of design
With tons of styling options, your charts are completely customizable. Tweak all chart elements such as labels, axes, data marks, etc. in the smallest graphic detail to perfection. Use your own fonts and color palettes to keep your design on-brand.
Join now and start designing your own charts
Create endless variations
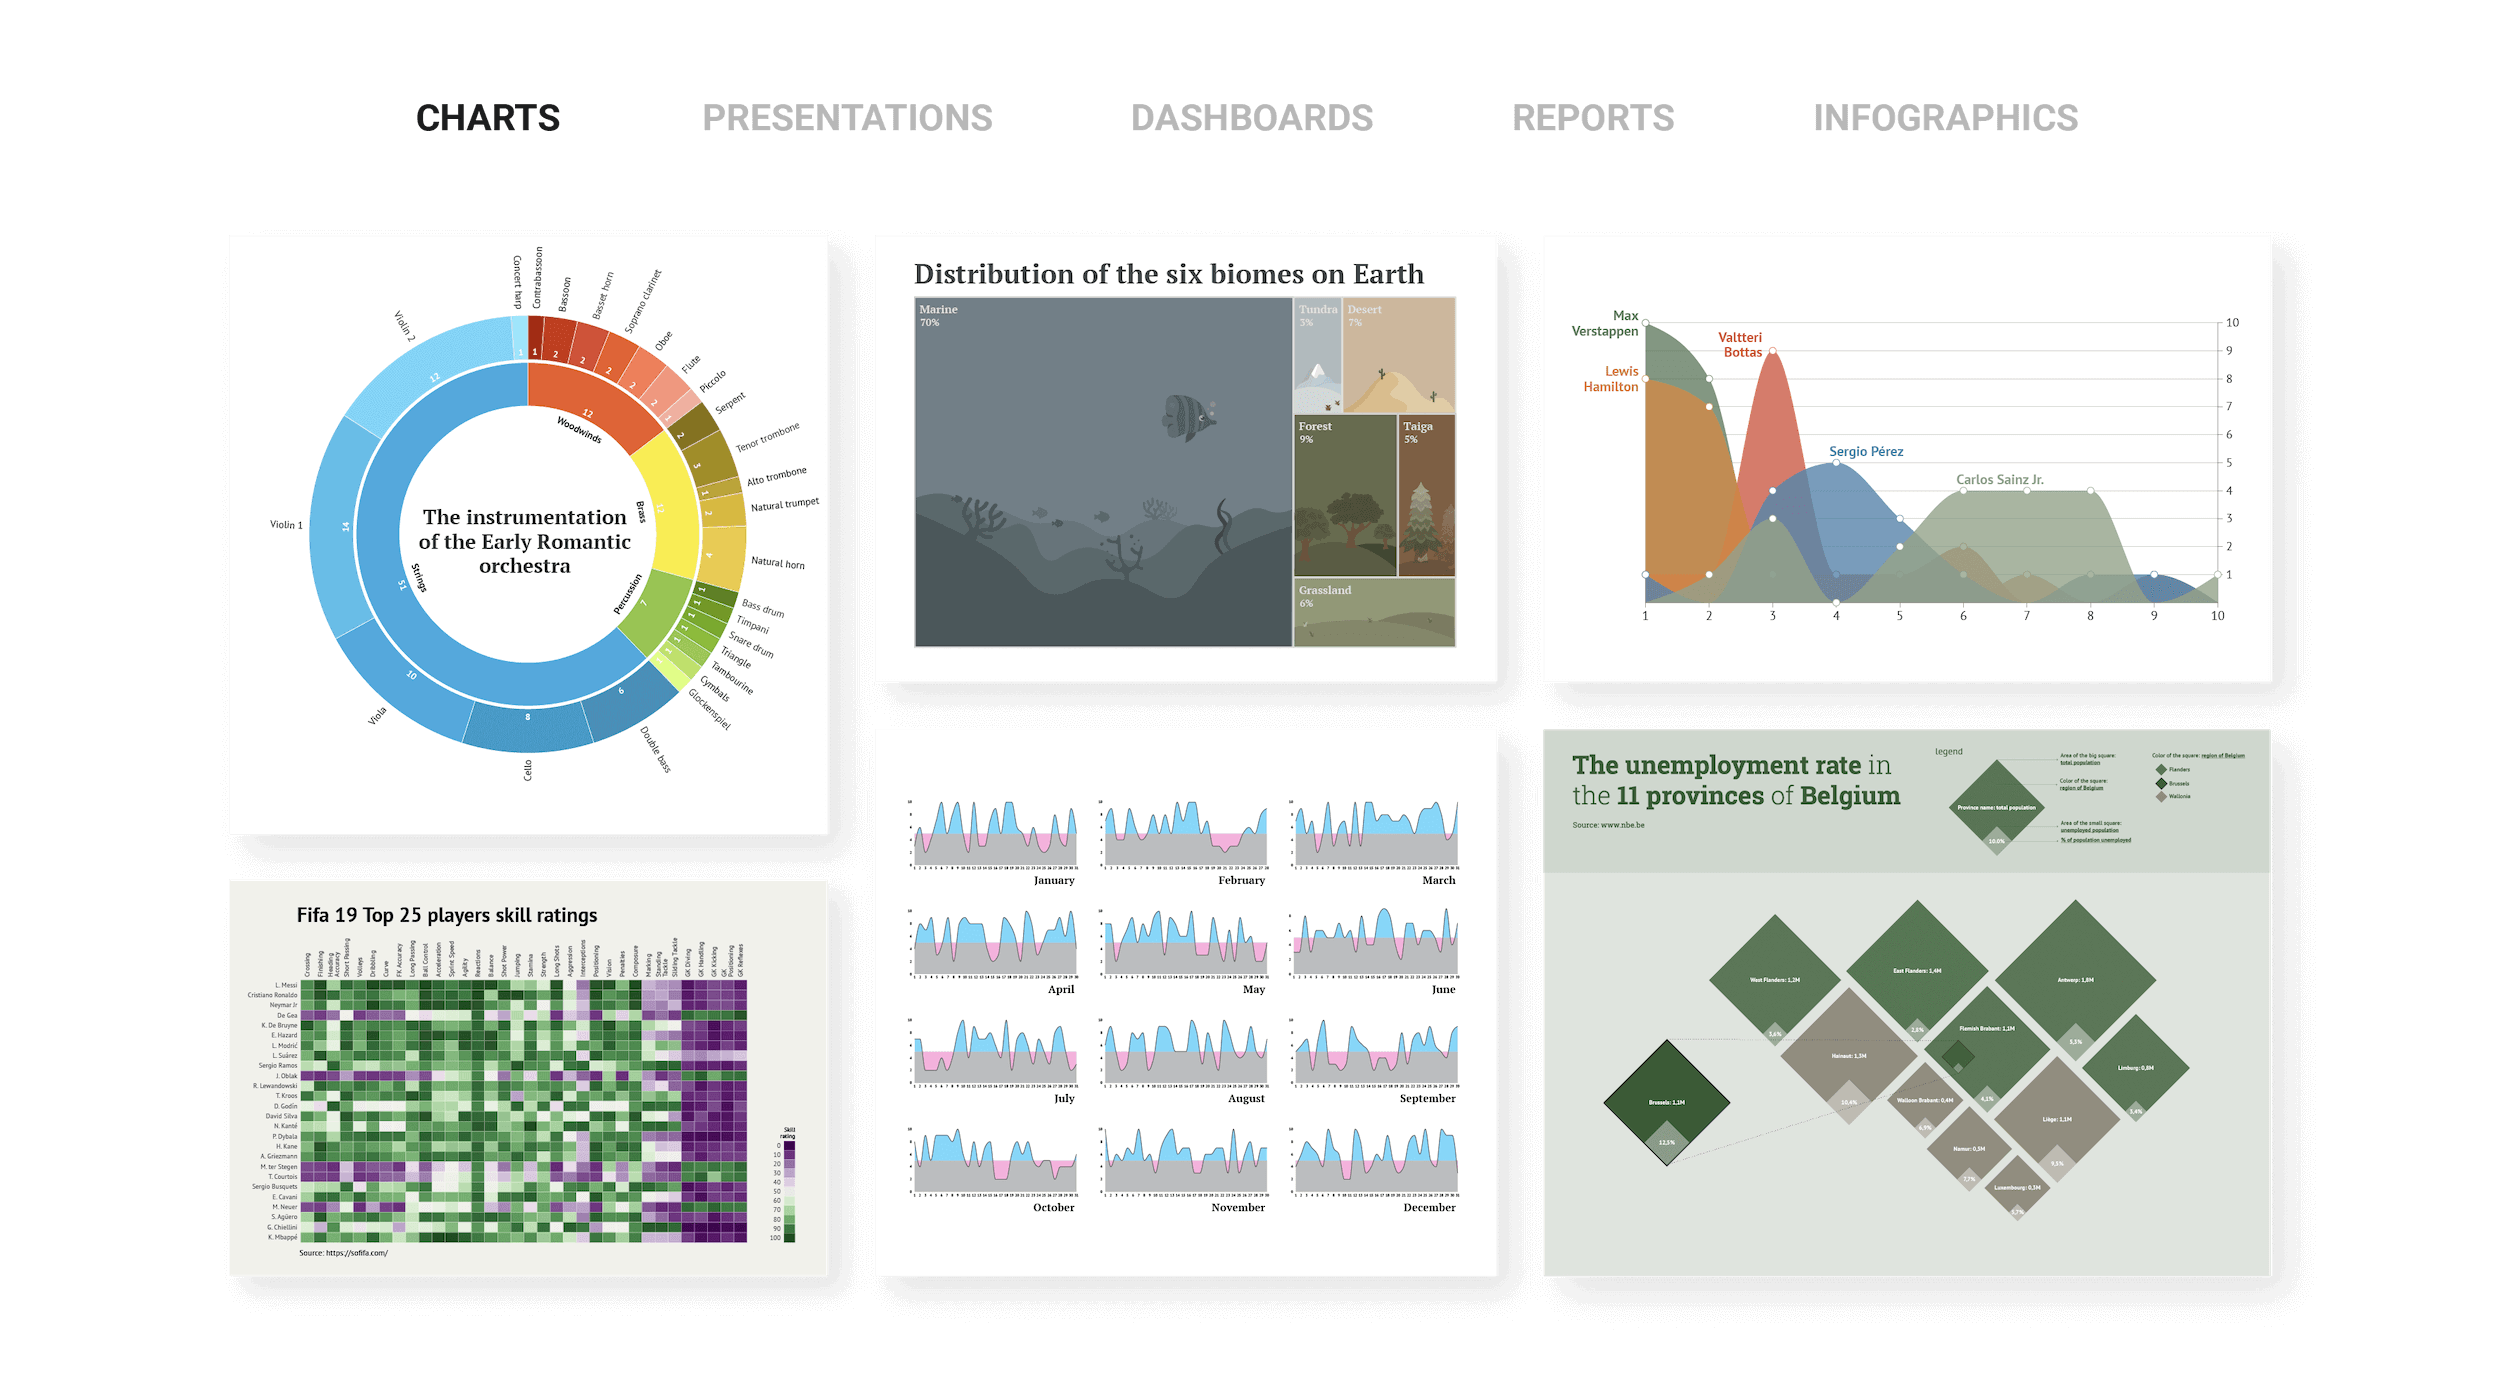
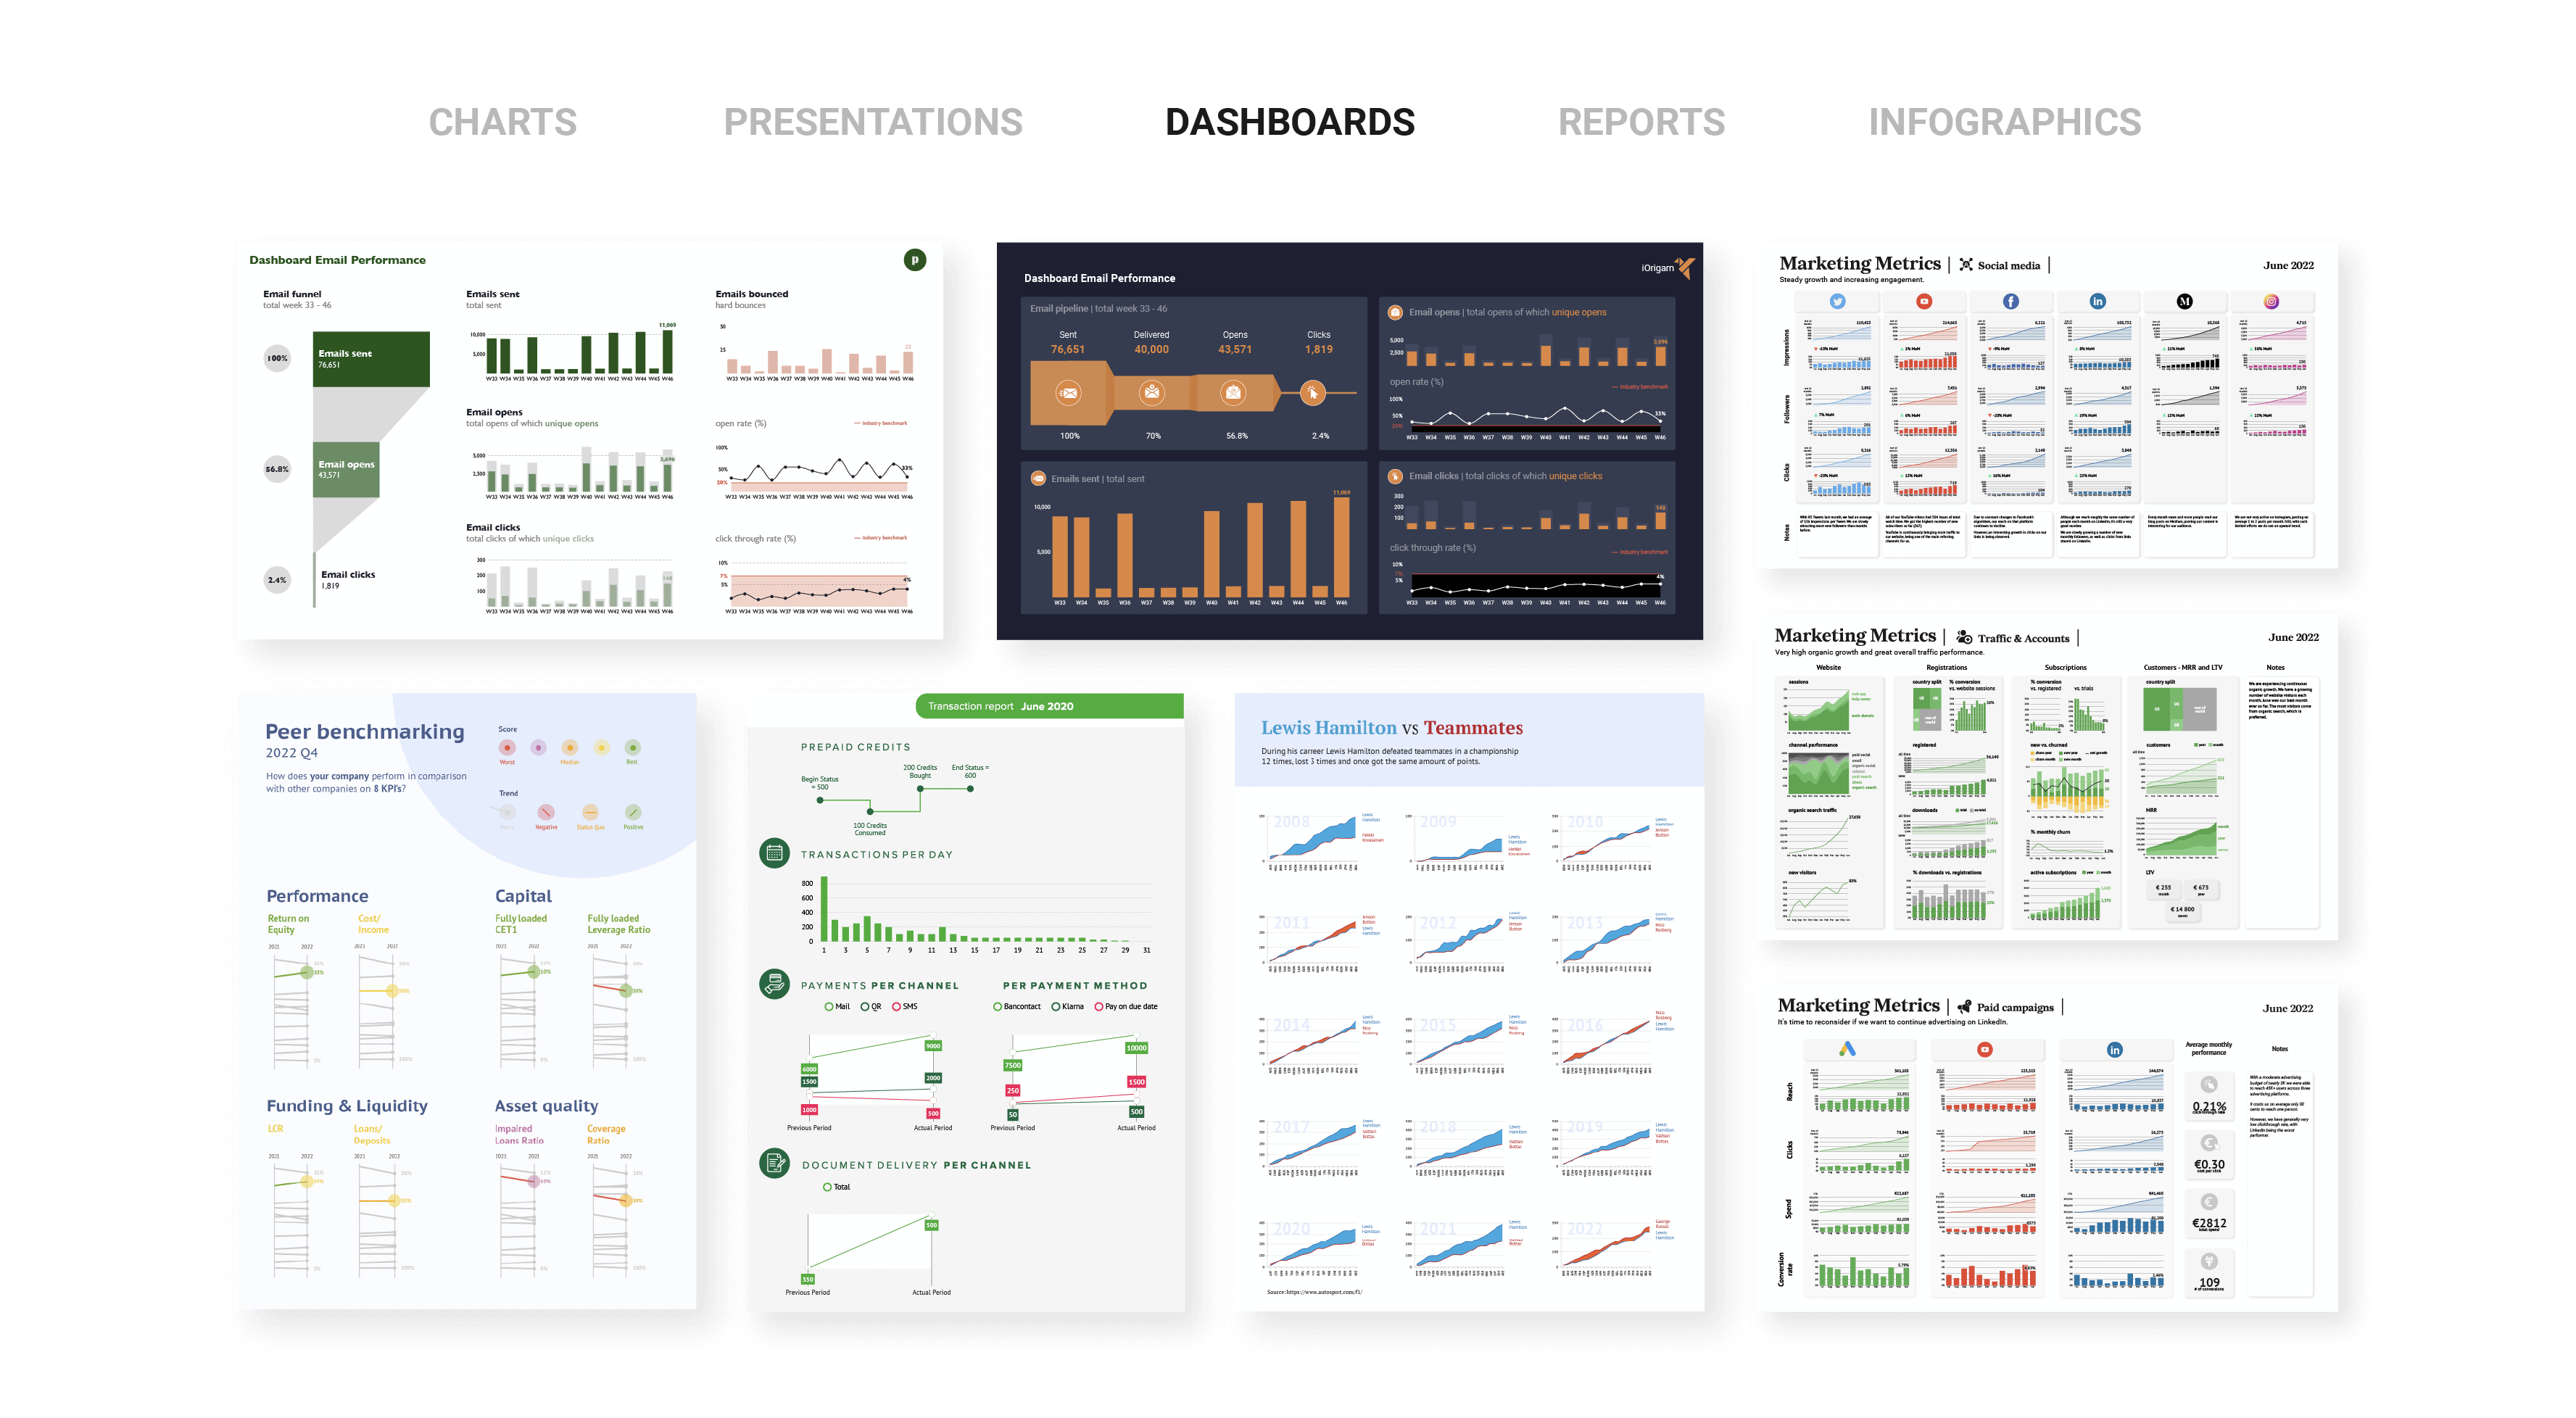
Choose from a collection of 130+ charts to get started. Superimpose charts in Illustrator to create new exciting visuals that can be driven by one dataset for one-click updates.
Get started with a 14-day free trial

Efficient data management
Import data from a file (.xls, .xlsx and .csv) or link to an online data source (Google Sheets, OneDrive XLS) and link it with one or more charts in your designs. Manage your data sheets in workbooks and keep everything nicely organized.
Download Datylon for Illustrator
Chart design for every platform
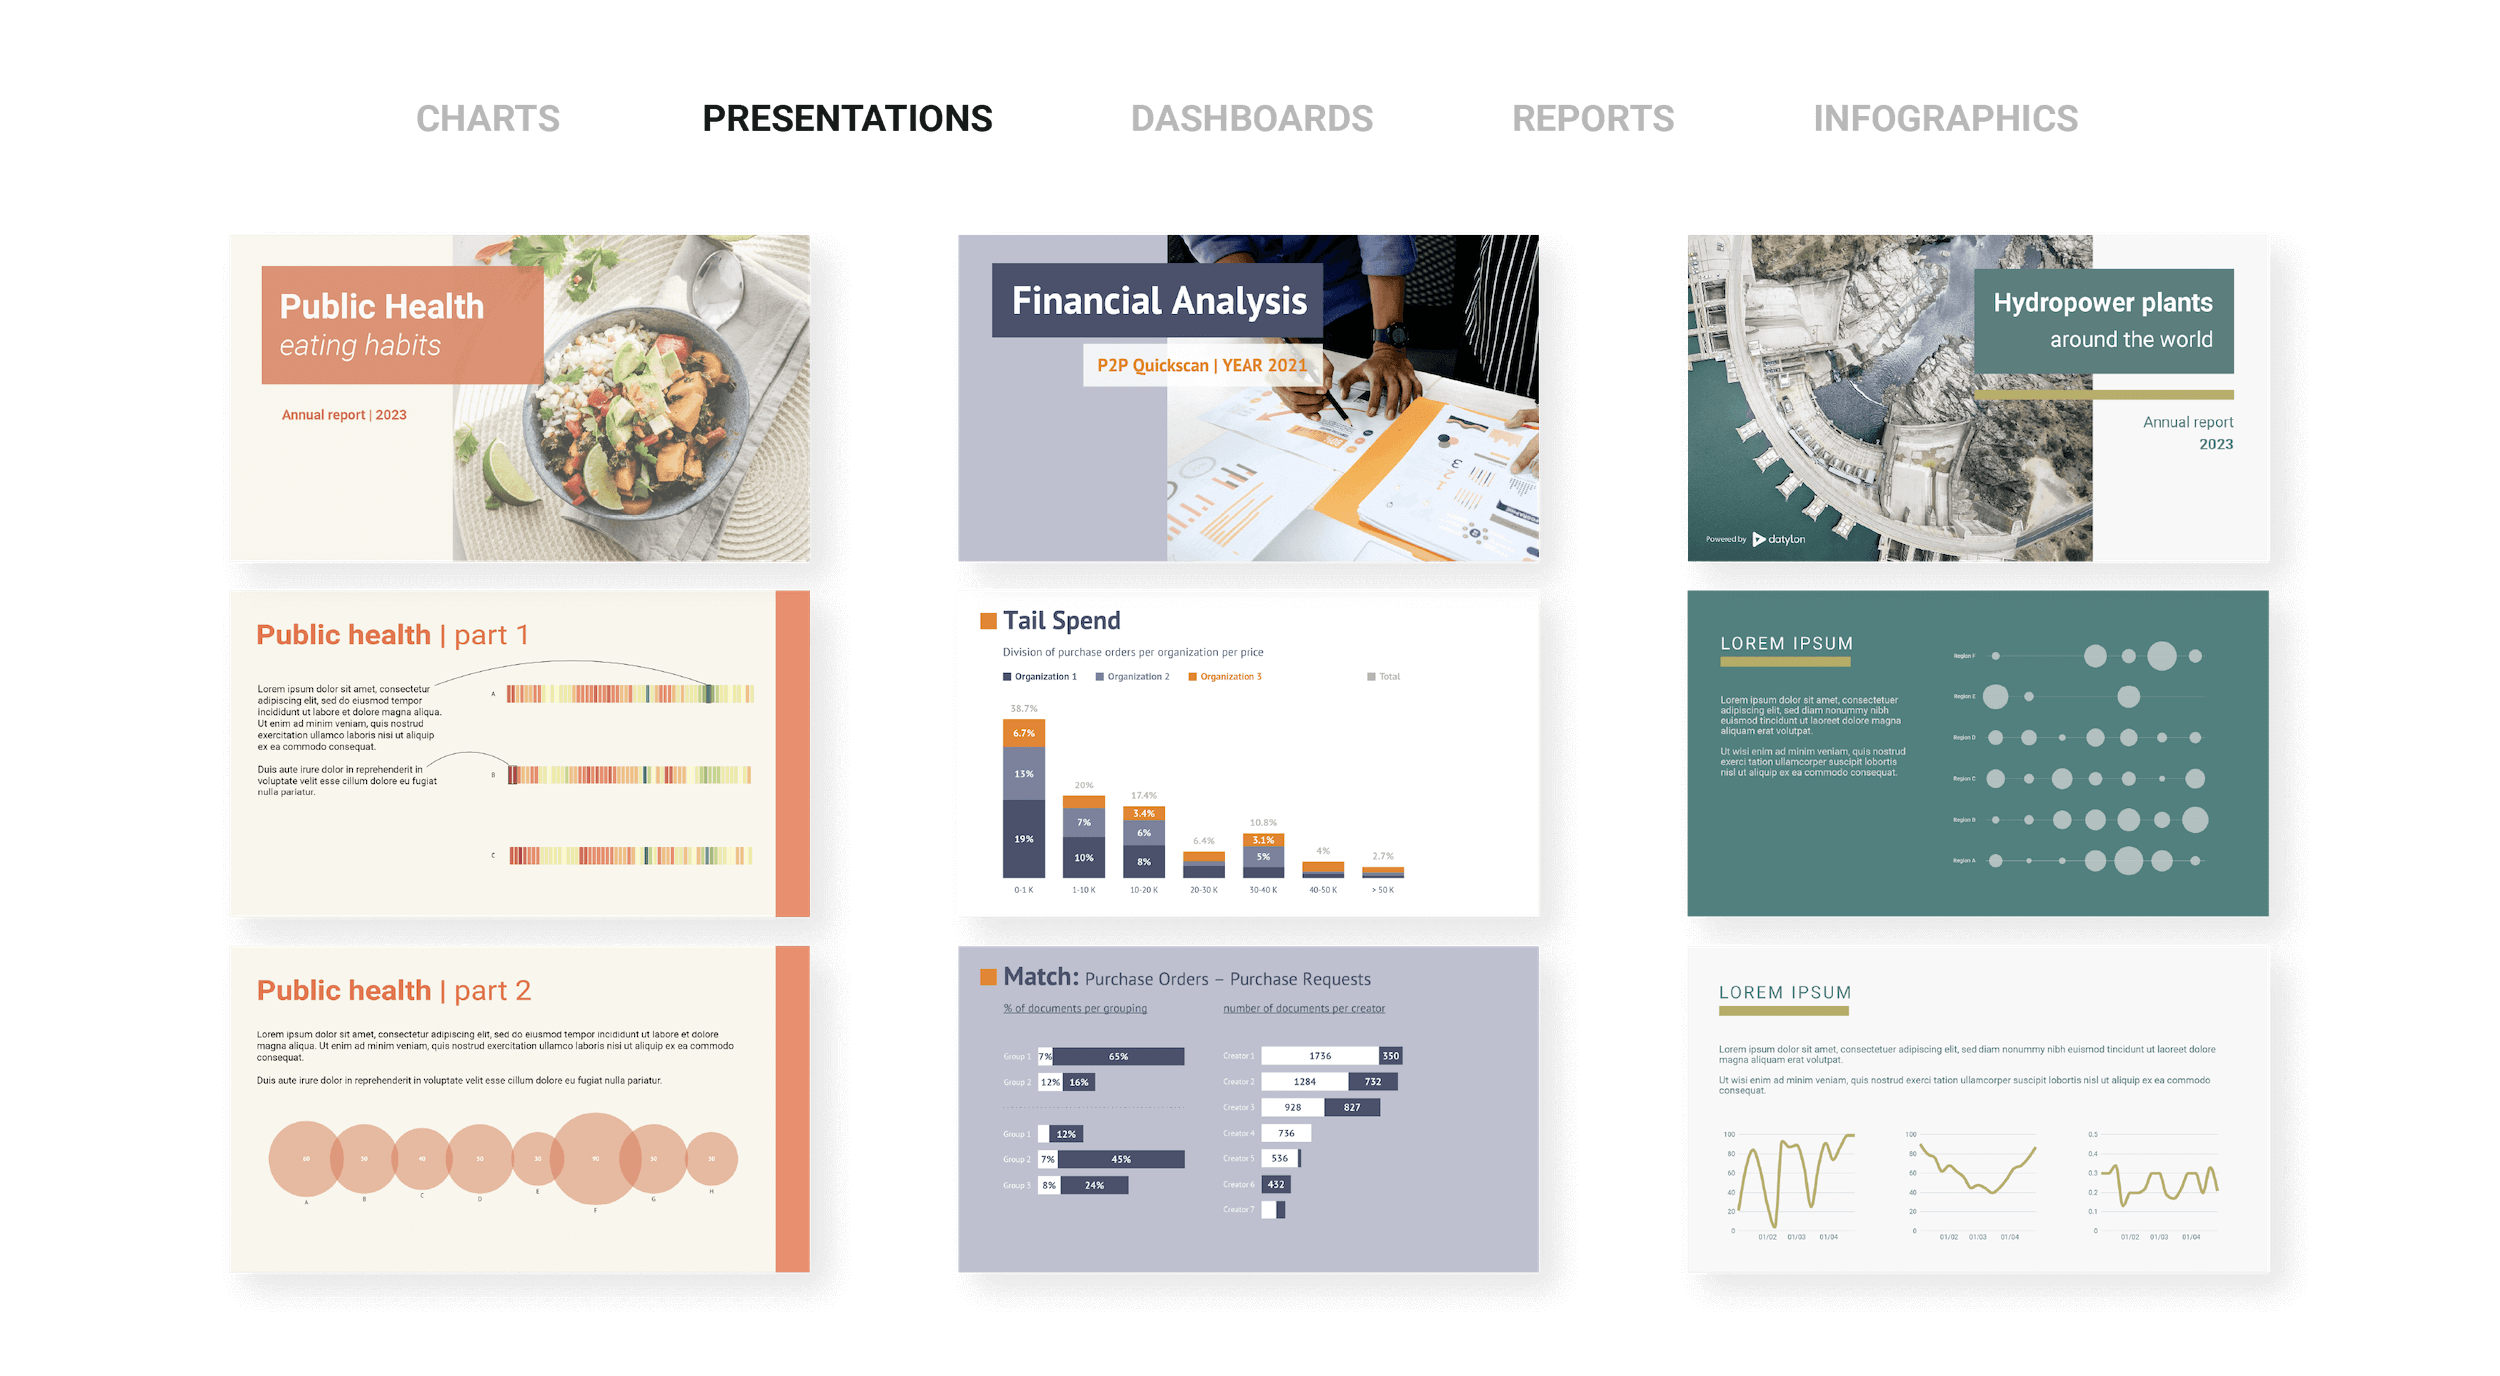
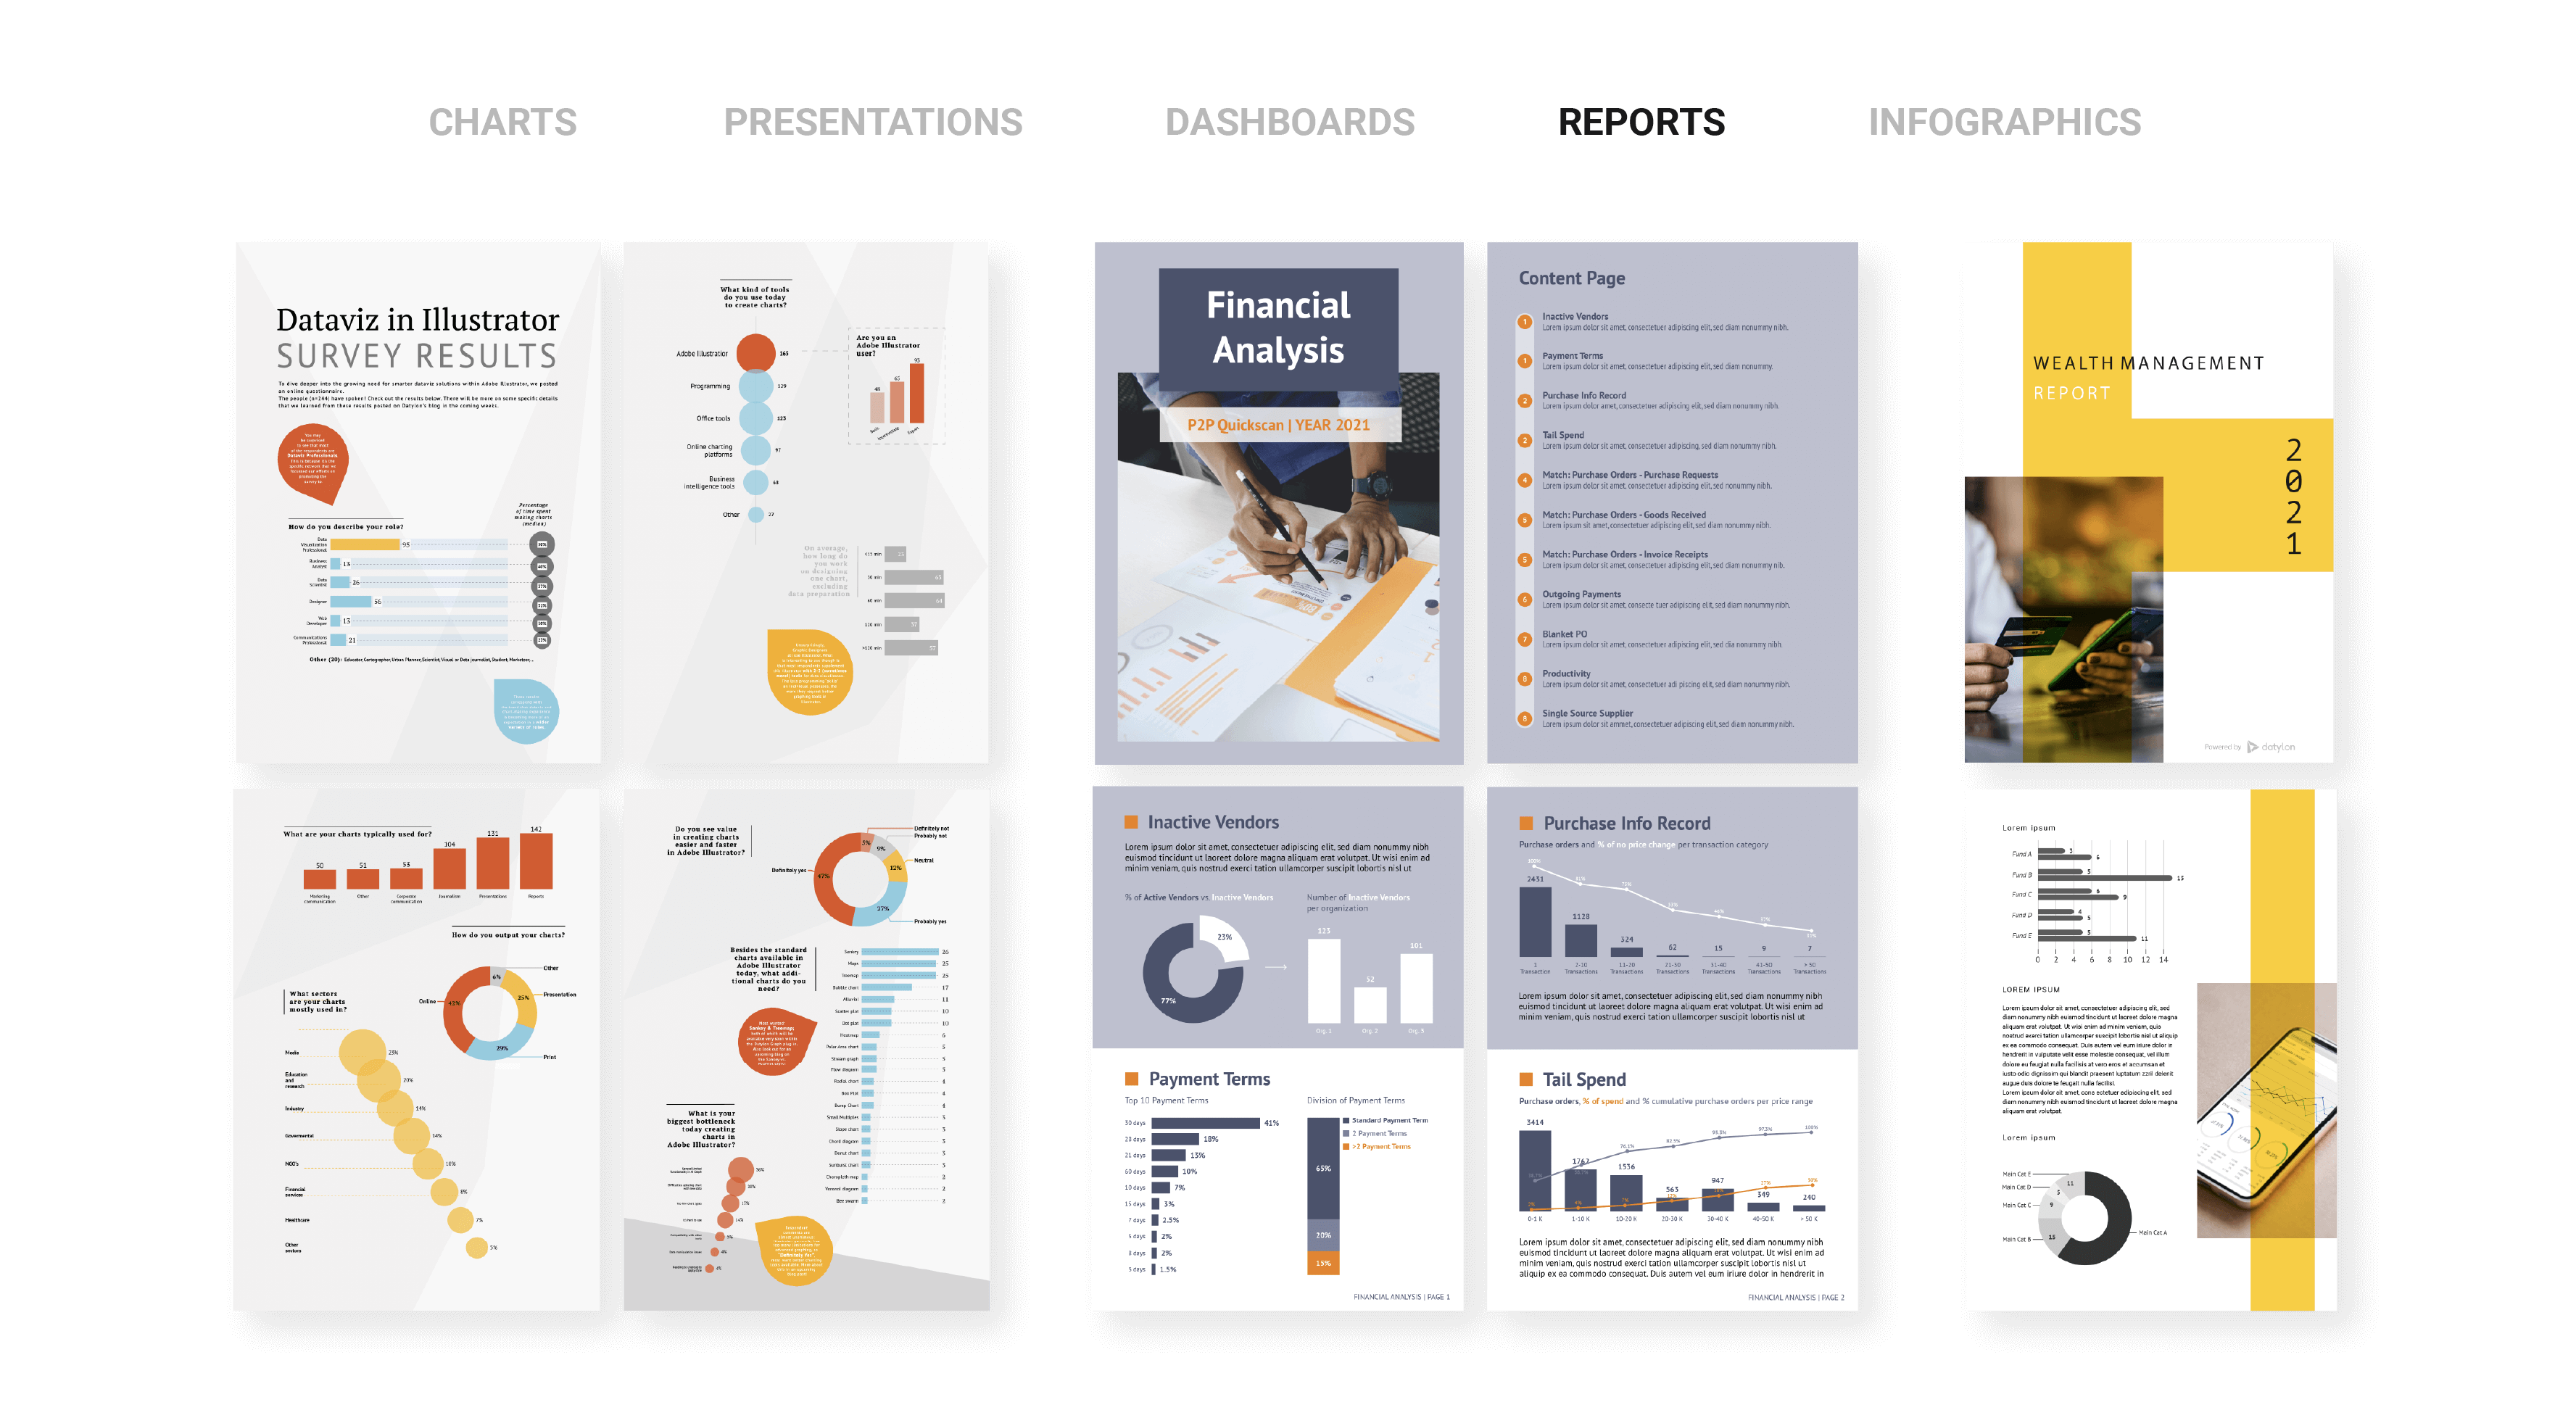
Optimize chart design and scale for different output formats like PDF, web, social media or even print. And keep all versions linked to one and the same data set.
Get started with your design
Work smarter, not harder
Create your own chart library to be reused. Make styling properties data-driven and avoid re-design when the data changes. Edit multiple charts at once or update them all in one click with local or online data.
Supercharge your chart design with Datylon for Illustrator