Datylon
  • Solutions
    • Chart Design
    • Report Design
    • Automated Reporting
    • ESG Report Publishing
    • Embedded Reporting
    • Bespoke Solutions
    • Software Services
  • Products
    • Datylon for Illustrator
    • Datylon Report Studio
    • Datylon for PowerPoint
    • Datylon ChartRunner
    • Datylon Report Server
  • Pricing
  • Resources
    • Help Center
    • Inspiration
    • Chart Library
    • Blog
    • Customer Stories
    • FAQ
  • About us
    • Why Datylon
    • Jobs
    • Contact us
Sign in
Explore free options
-customer-story-pro-alliance-header
Customer Stories> Project, Industry

Pro Alliance – A collaborative supply chain platform

SHARE

A collaborative supply chain platform for sharing and visualizing data in real-time.

Challenge:

The retail supply chain has seen limited optimization in recent years. Pro Alliance saw the typical silo-focused solutions only allowed for local-level optimization at best. Due to the perception that it was too difficult for data collection, stakeholder comprehension and informed collaboration to exist, the industry remained relatively unoptimized. As a result it was missing out on some huge gains.

Solution:

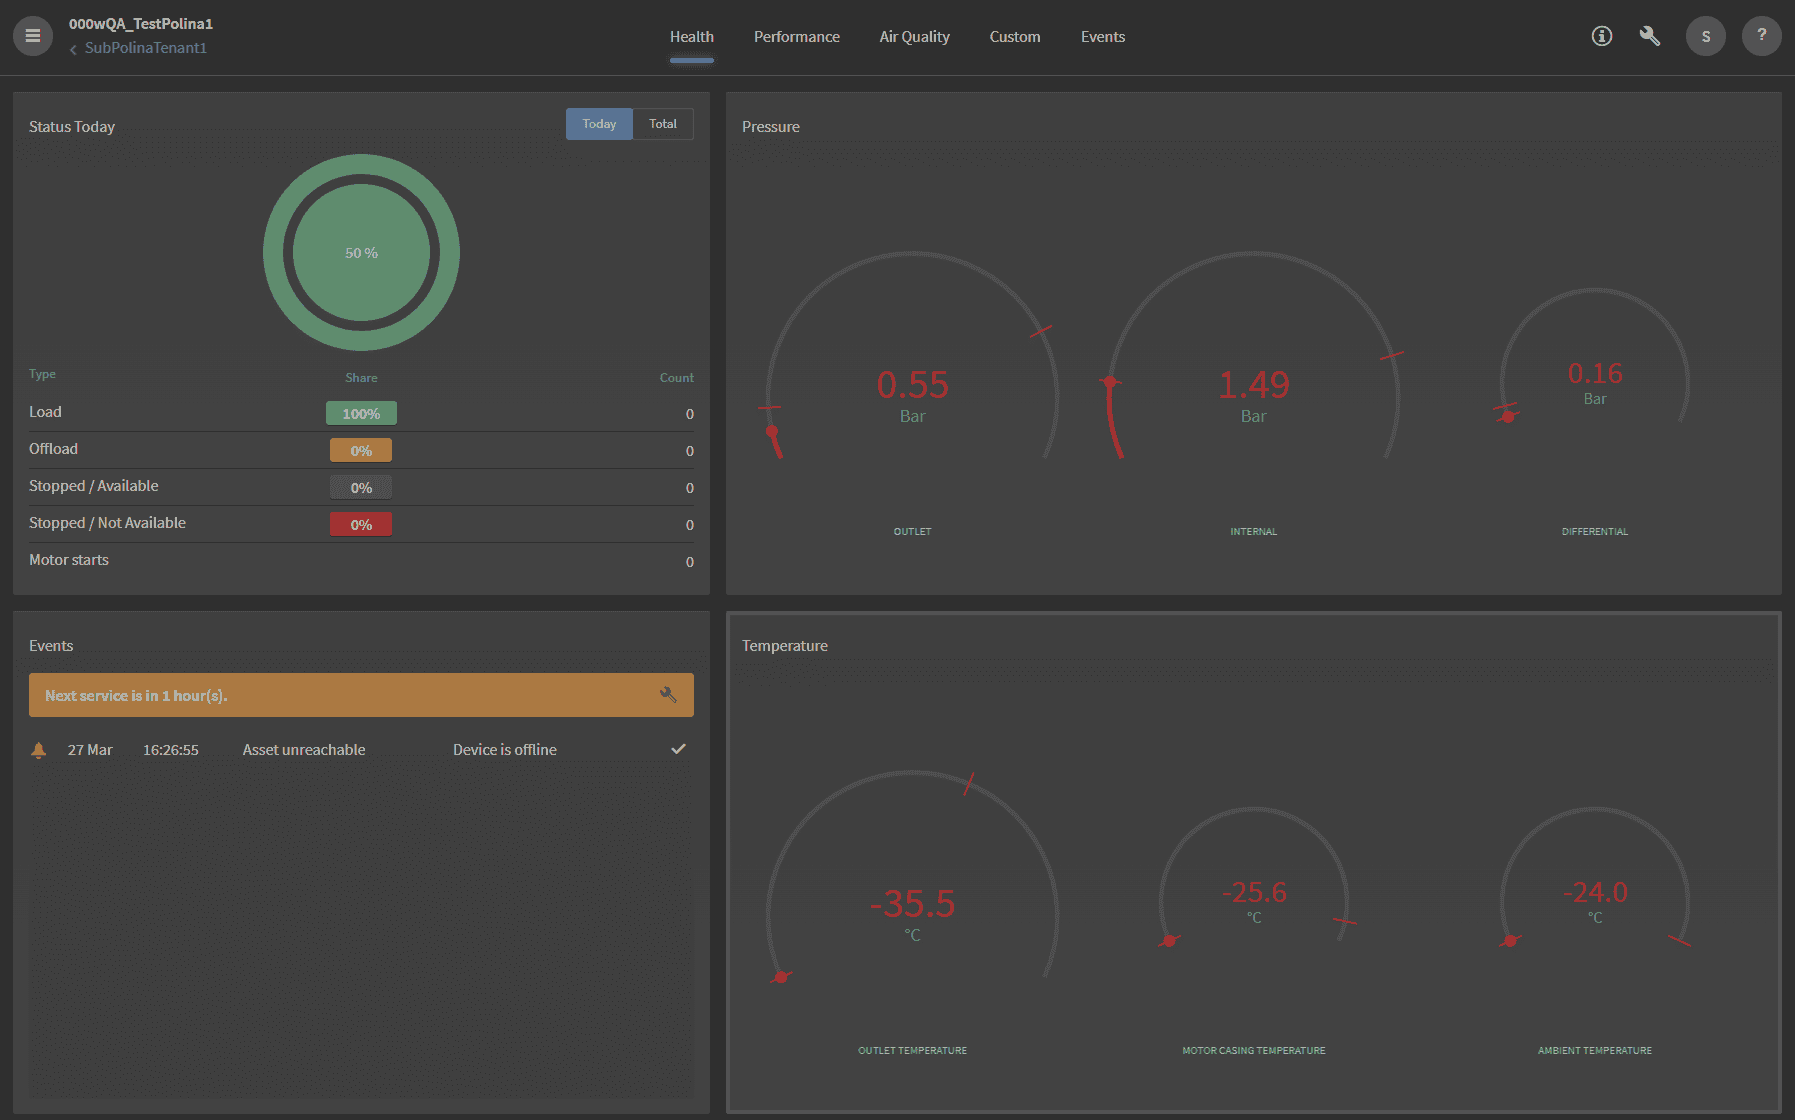
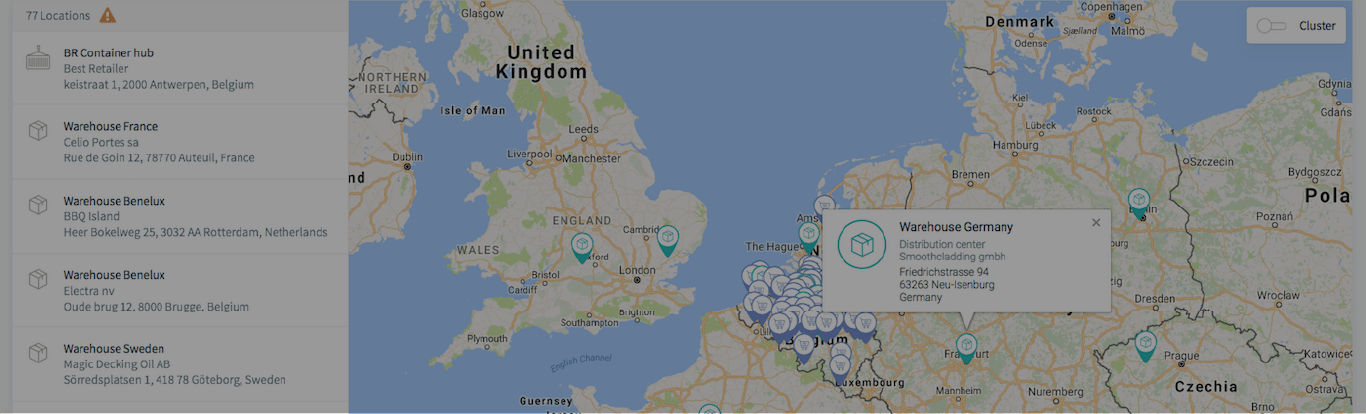
Focusing on a method of horizontal inclusive collaboration, Pro Alliance developed a platform for data sharing and cleansing, and visualized this in a way that allowed all stakeholders in the supply chain to easily detect optimization opportunities at a global level. The platform allows users to easily monitor what’s going on and proactively take action accordingly. 

Value:

With suppliers, retailers, carriers and stores all able to access the same insights, supply chain processes can see benefits of speed and efficiency, lower costs, transparency and agility for all stakeholders. But if you’re after real world evidence, how does less trucks on the road sound? Pro Alliance are just getting started. 


customer-story-pro-alliance-in-text

Read more customer stories

daylon-customer-story-cmc-header-2
Project, Industry

Creating an IoT platform for predictive maintenance for CMC

CMC, Belgium based global expert in compressed air control, performance and monitoring solutions,...

Read more
datylon-blog-Jaaf-Information-Design-Unleashing-the-Power-of-Clarity-featured-image
Design Agency, Report Design, Report Server, Automated Reporting

Jaaf Information Design Unleashing the Power of Clarity

Nestled in the Netherlands with its vibrant design scene, Jaaf Information Design stands out as a...

Read more

Subscribe to our newsletter

Receive inspiration, practical advice, customer stories and news right in your mailbox.

Newsletter
Company
  • About us
  • Jobs
  • Contact us
  • Data security
  • Datylon reviews
Solutions
  • Embedded Reporting
  • Automated Reporting
  • Chart Design
  • Report Design
  • ESG Reporting
  • Bespoke Solutions
  • Development Services
Product
  • Datylon Report Studio
  • Datylon Report Server
  • Datylon for Illustrator
  • Datylon ChartRunner
  • Datylon for PowerPoint
  • Datylon Enterprise
  • Pricing
  • Free trial
  • Release notes
Resources
  • Chart library
  • Inspiration
  • Blog
  • Customer stories
  • FAQ
  • Help center
  • Video tutorials
Create
  • Area chart
  • Bar chart
  • Bubble chart
  • Bullet chart
  • Density plot
  • Dot plot
  • Heatmap
  • Histogram
  • Icon array
  • Icon chart
  • Line chart
  • Pie chart
  • Range plot
  • Scatter plot
  • Stream graph
  • Treemap
Learn
  • Tips for report design
  • Do you speak data?
  • Do you speak dataviz?
  • Effective dataviz guide
  • 80 types of charts
  • 9 types of dataviz
  • Best dataviz tools
  • Charts for colorblind
  • Accessible charts
  • Break the rules
  • Dataviz in Illustrator
  • Datylon vs. Illustrator
  • Static or interactive?
  • Outside the box charts
  • Mind your dataviz
  • Data storytelling

All rights reserved. © 2025 Datylon BV

  • Legal Terms
  • Privacy Policy

Manage Cookies