DATYLON > CHART LIBRARY > GROUPED BAR CHART
What is a grouped bar chart?
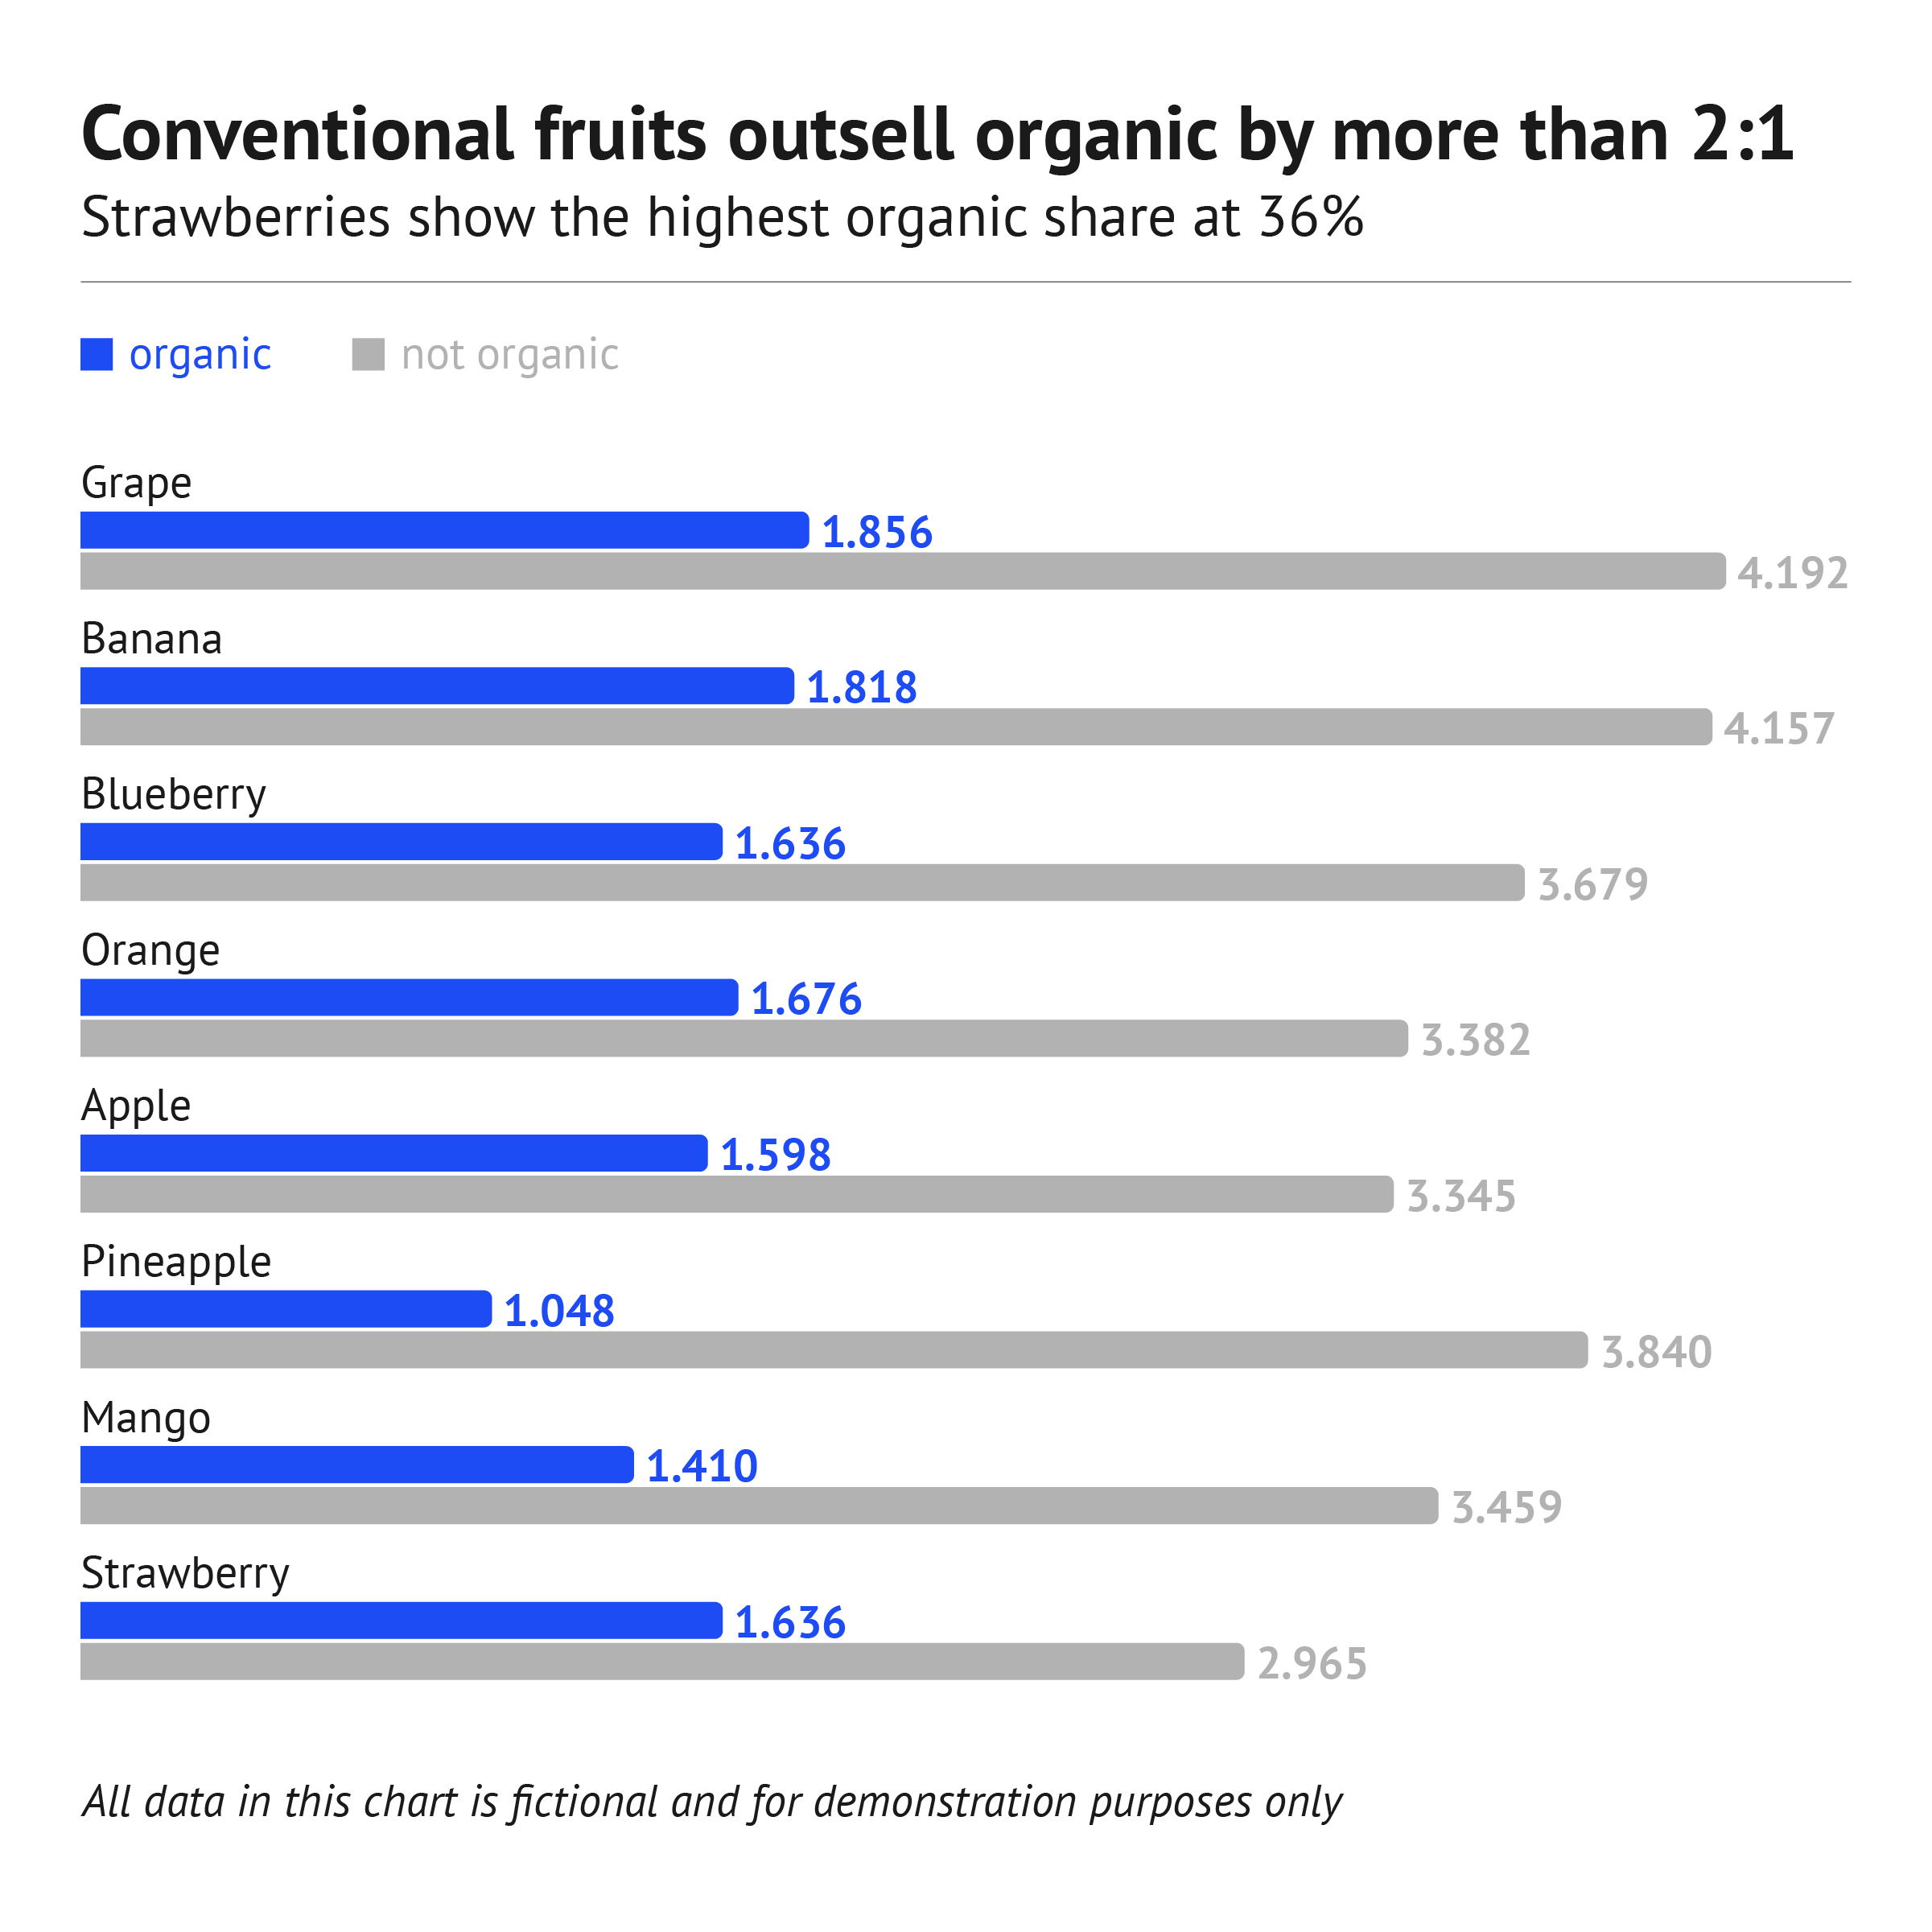
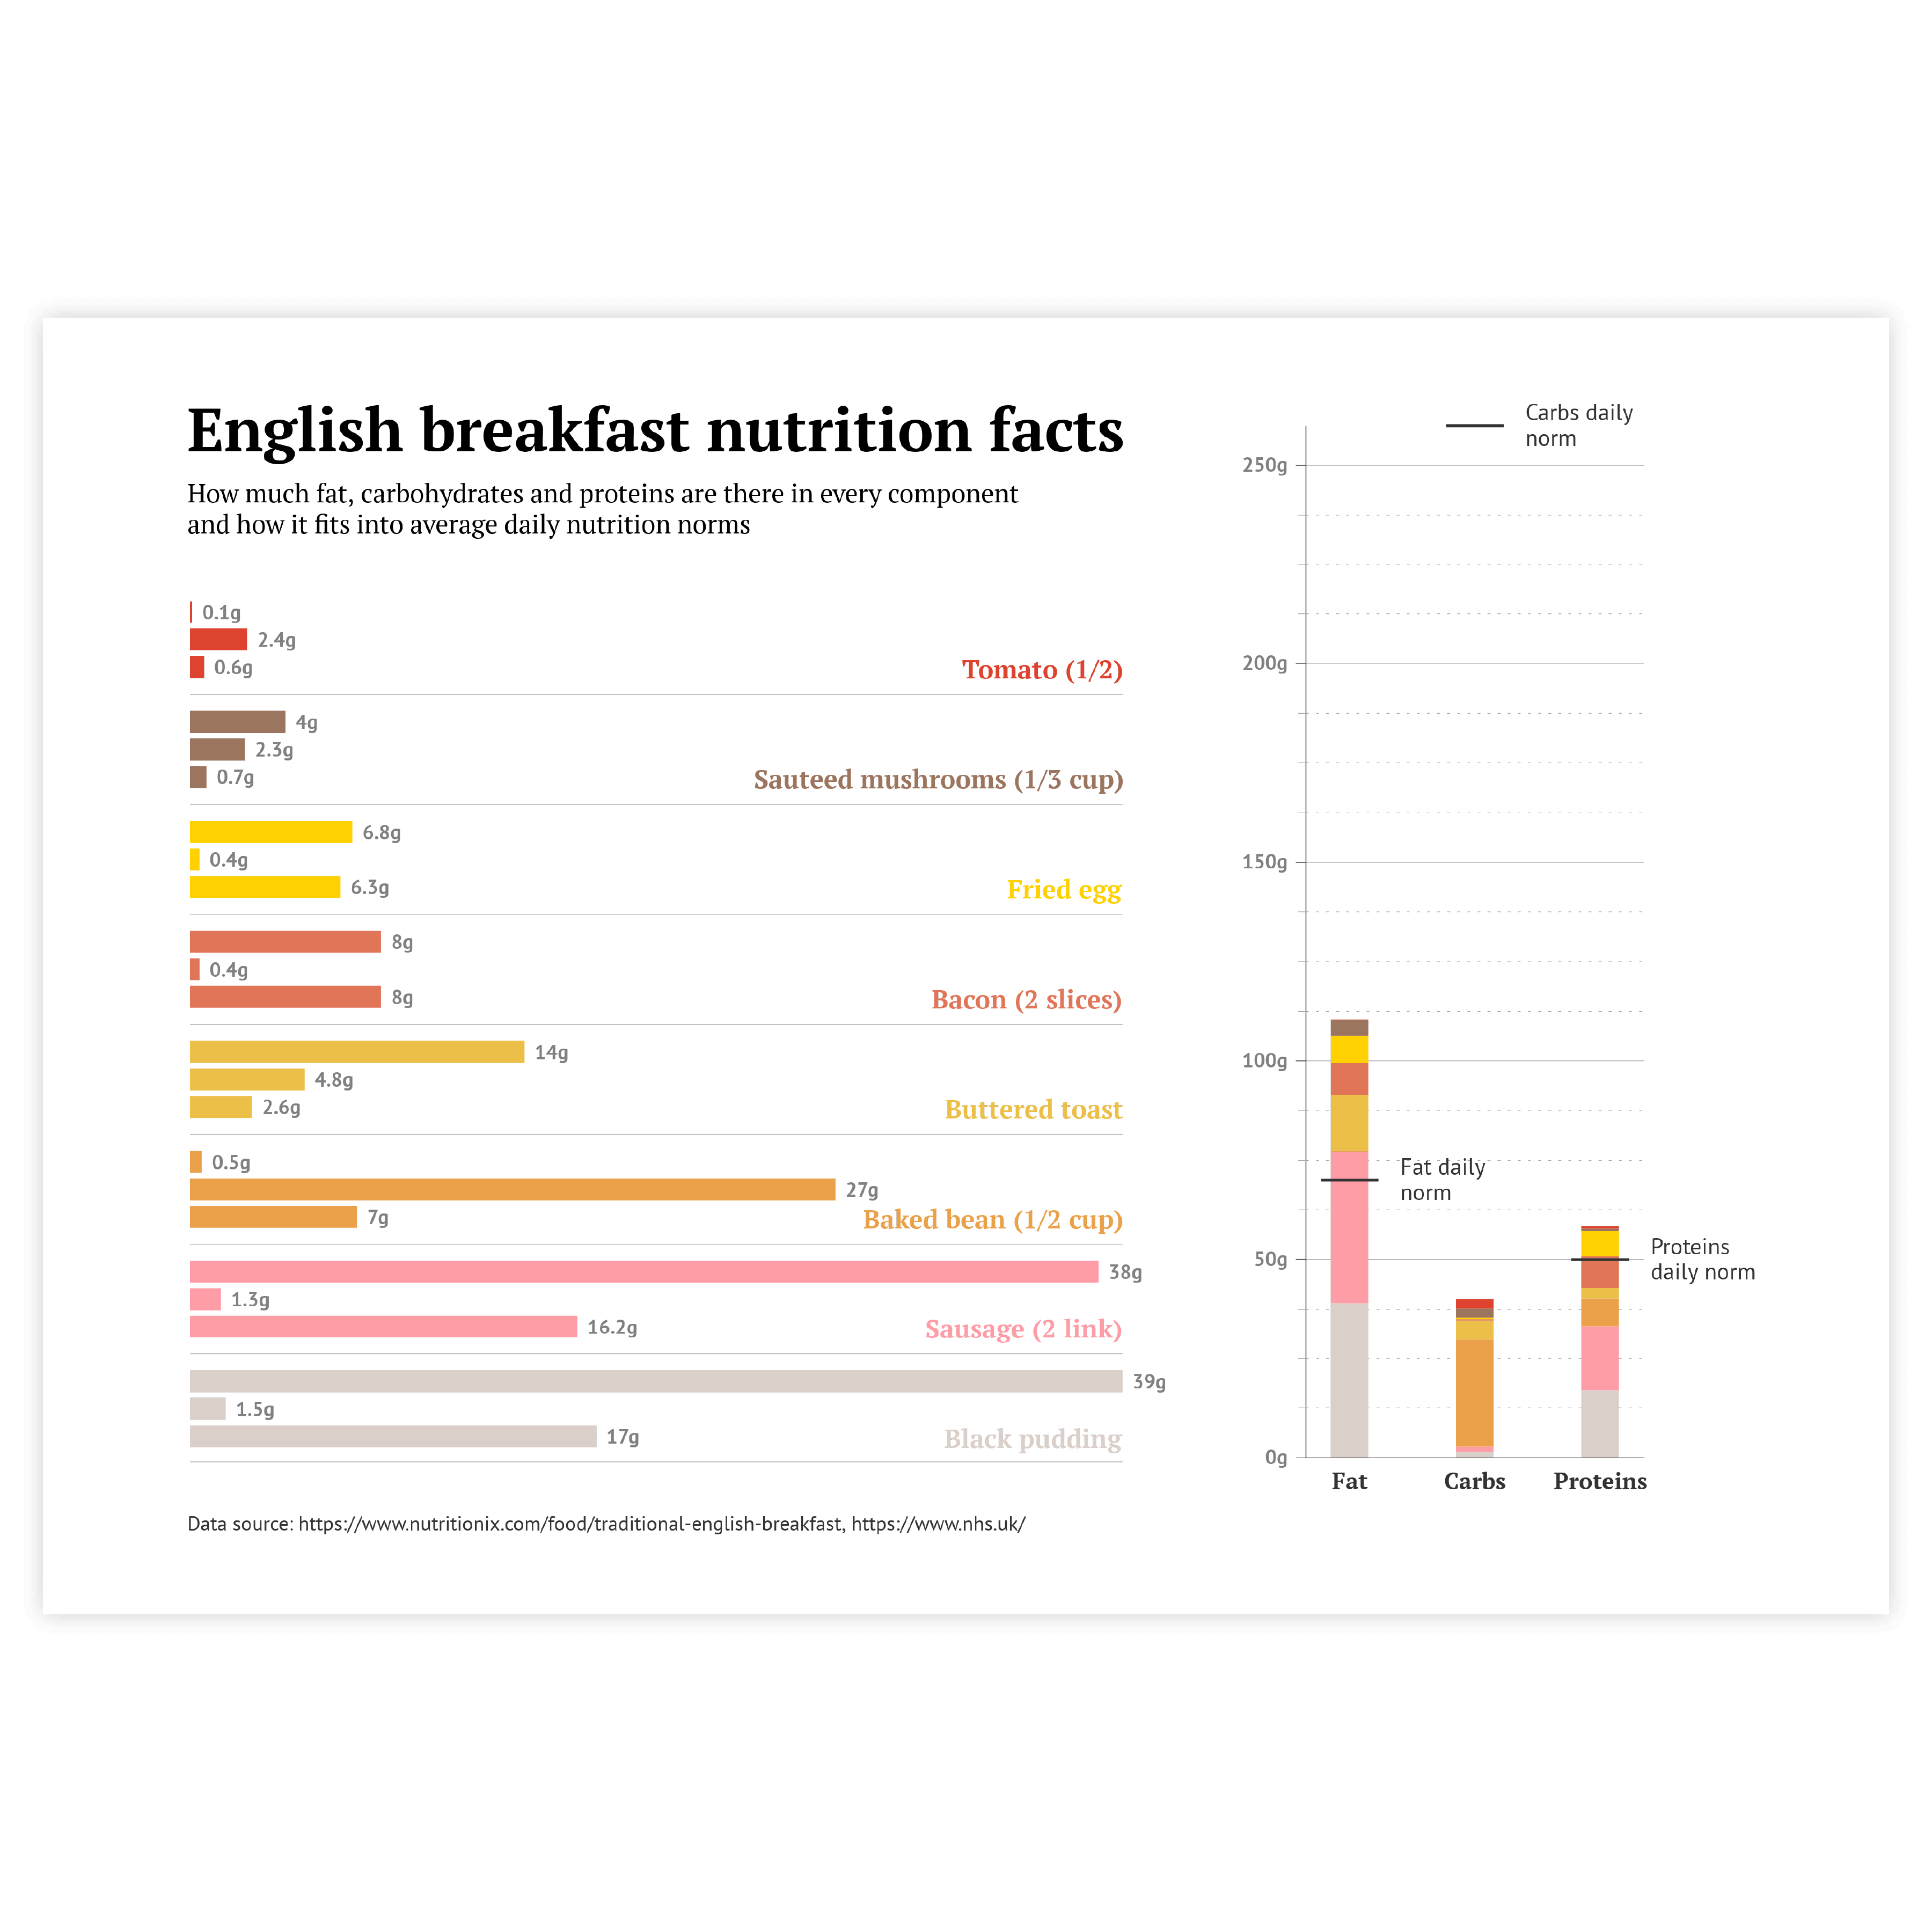
A stacked bar chart is created on base of a regular bar chart. The difference is that in stacked bar chart the bar is divided into colored segments. The full size of the bar represents the total, while segments show the contribution of each element.
Stacked bar charts are great for showing part-to-whole relationships inside one bar and for comparison between bars.
Stacked bar charts are commonly used charts due to their simplicity. It makes them a preferable option for showing part-to-whole relationships.
Stacked bar charts are great for showing part-to-whole relationships inside one bar and for comparison between bars.
Stacked bar charts are commonly used charts due to their simplicity. It makes them a preferable option for showing part-to-whole relationships.


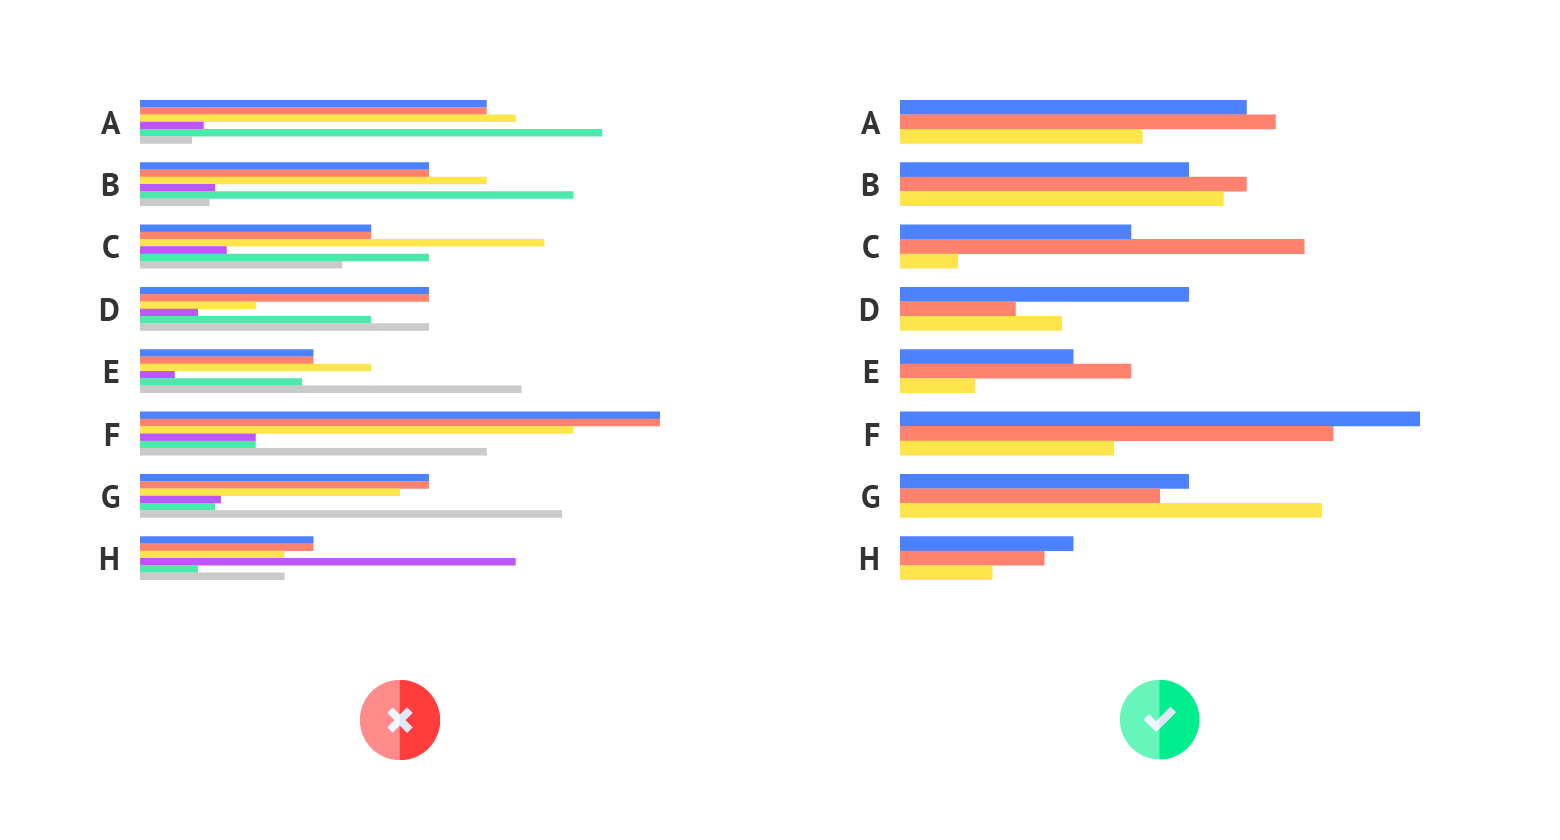
Number of bars in group
For grouped bar chart it's better not to use more than 3 bars per group. Otherwise that chart becomes cluttered and it's extensively harder to read chart and compare separate bars.
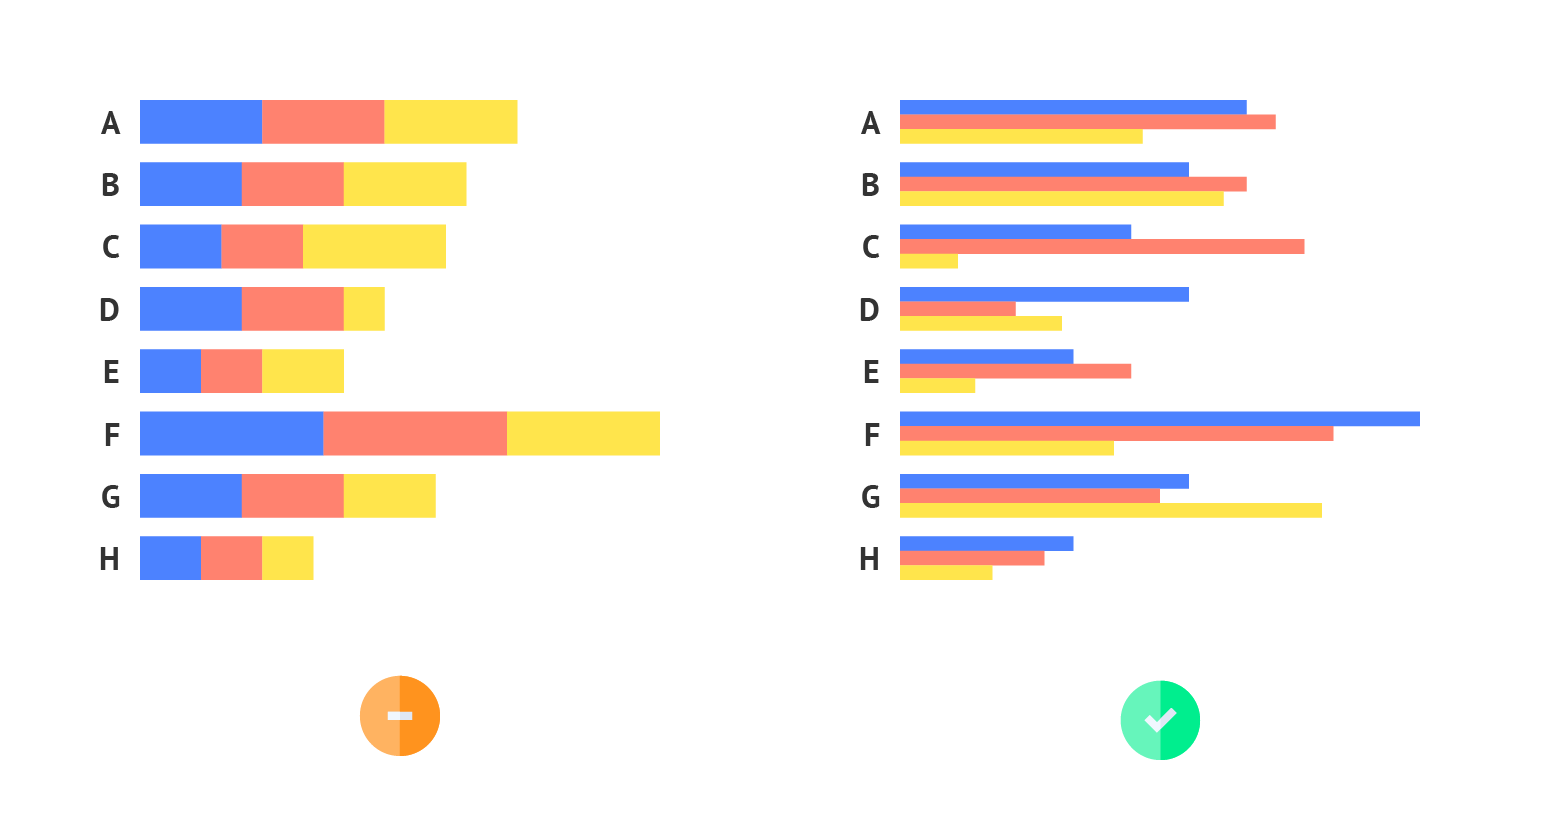
Comparing segments
In stacked bar chart it might not be easy to compare segments that are part of different bars. If you want to compare segments you might need to use grouped bar chart. Fortunately in Datylon bar chart it can be done in one click.

Negative value segments
Comparing stacked bar charts that include segments with negative values can be misleading, as it may distort the overall interpretation of the chart. If your data contains negative values in one or more segments, consider using a grouped bar chart instead. This approach provides a clearer and more accurate representation of your data in such cases.
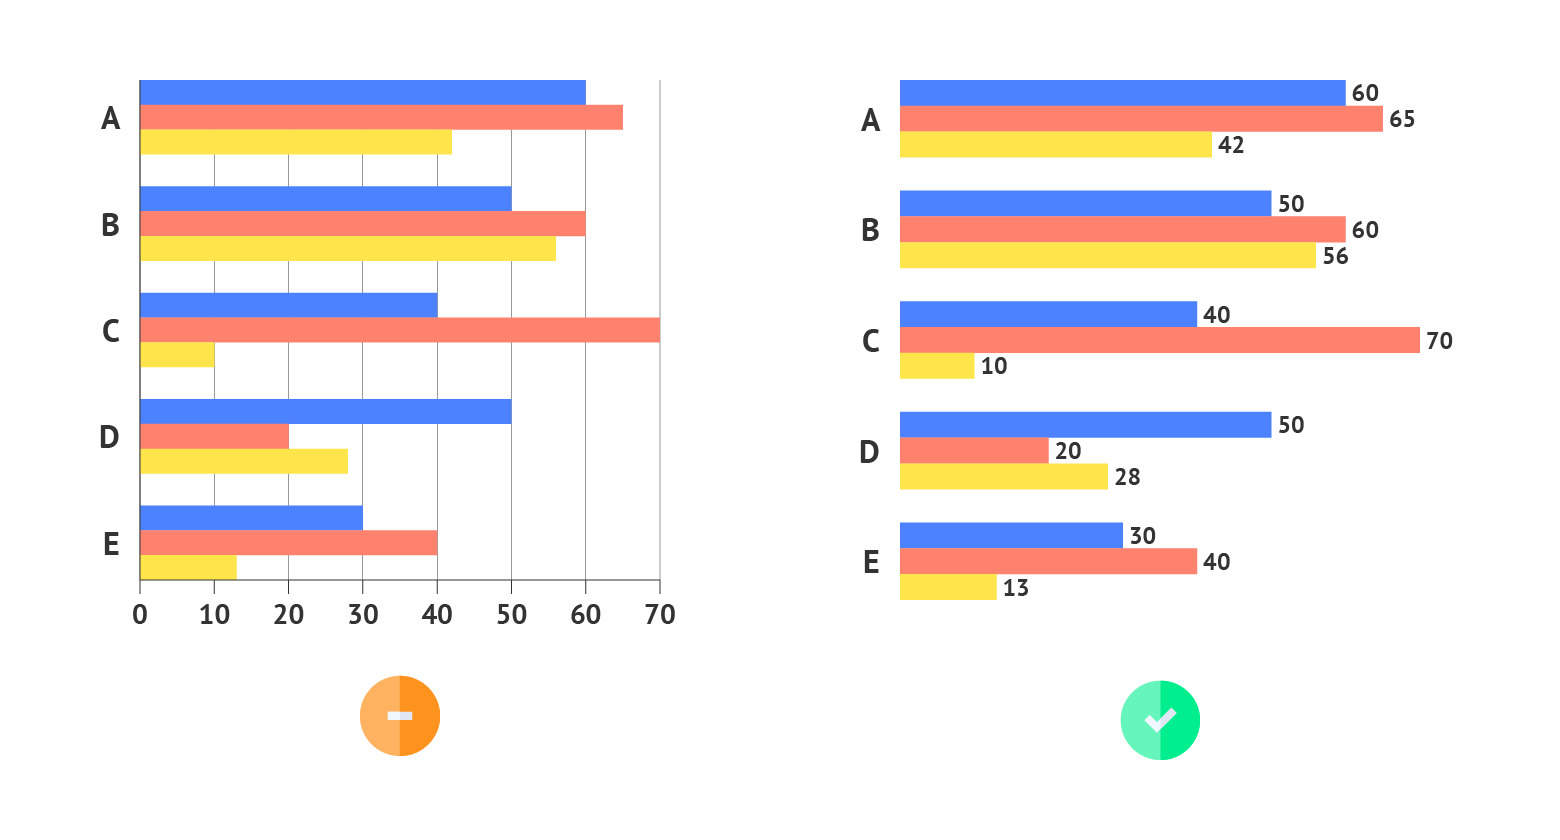
Labeling
The rule of thumb for using labels in bar charts is to use data labels instead of axis labels and axes themselves. By using only data labels the visual clutter is reduced and the essential information is provided.