DATYLON > CHART LIBRARY > BAR CHART
What is a bar chart?
A bar chart is a set of rectangles with a length proportional to the values it represents. Each rectangle – the bar, is a representation of one category.
Bar charts are great for comparison. The differences in bar length are easier to perceive, than, for example, differences in size and color.
Bar charts are commonly used charts due to their simplicity. Viewers mostly need to decode their bars' length and position, making bar charts very easy to understand. The general public is fairly capable of reading bar charts, so no additional dataviz expertise is necessary. For this reason, bar charts are doing their job really well. That's why, if the data structure and the actual message you're trying to convey allow for it, you should consider using bar charts in your data visualization.


Labeling
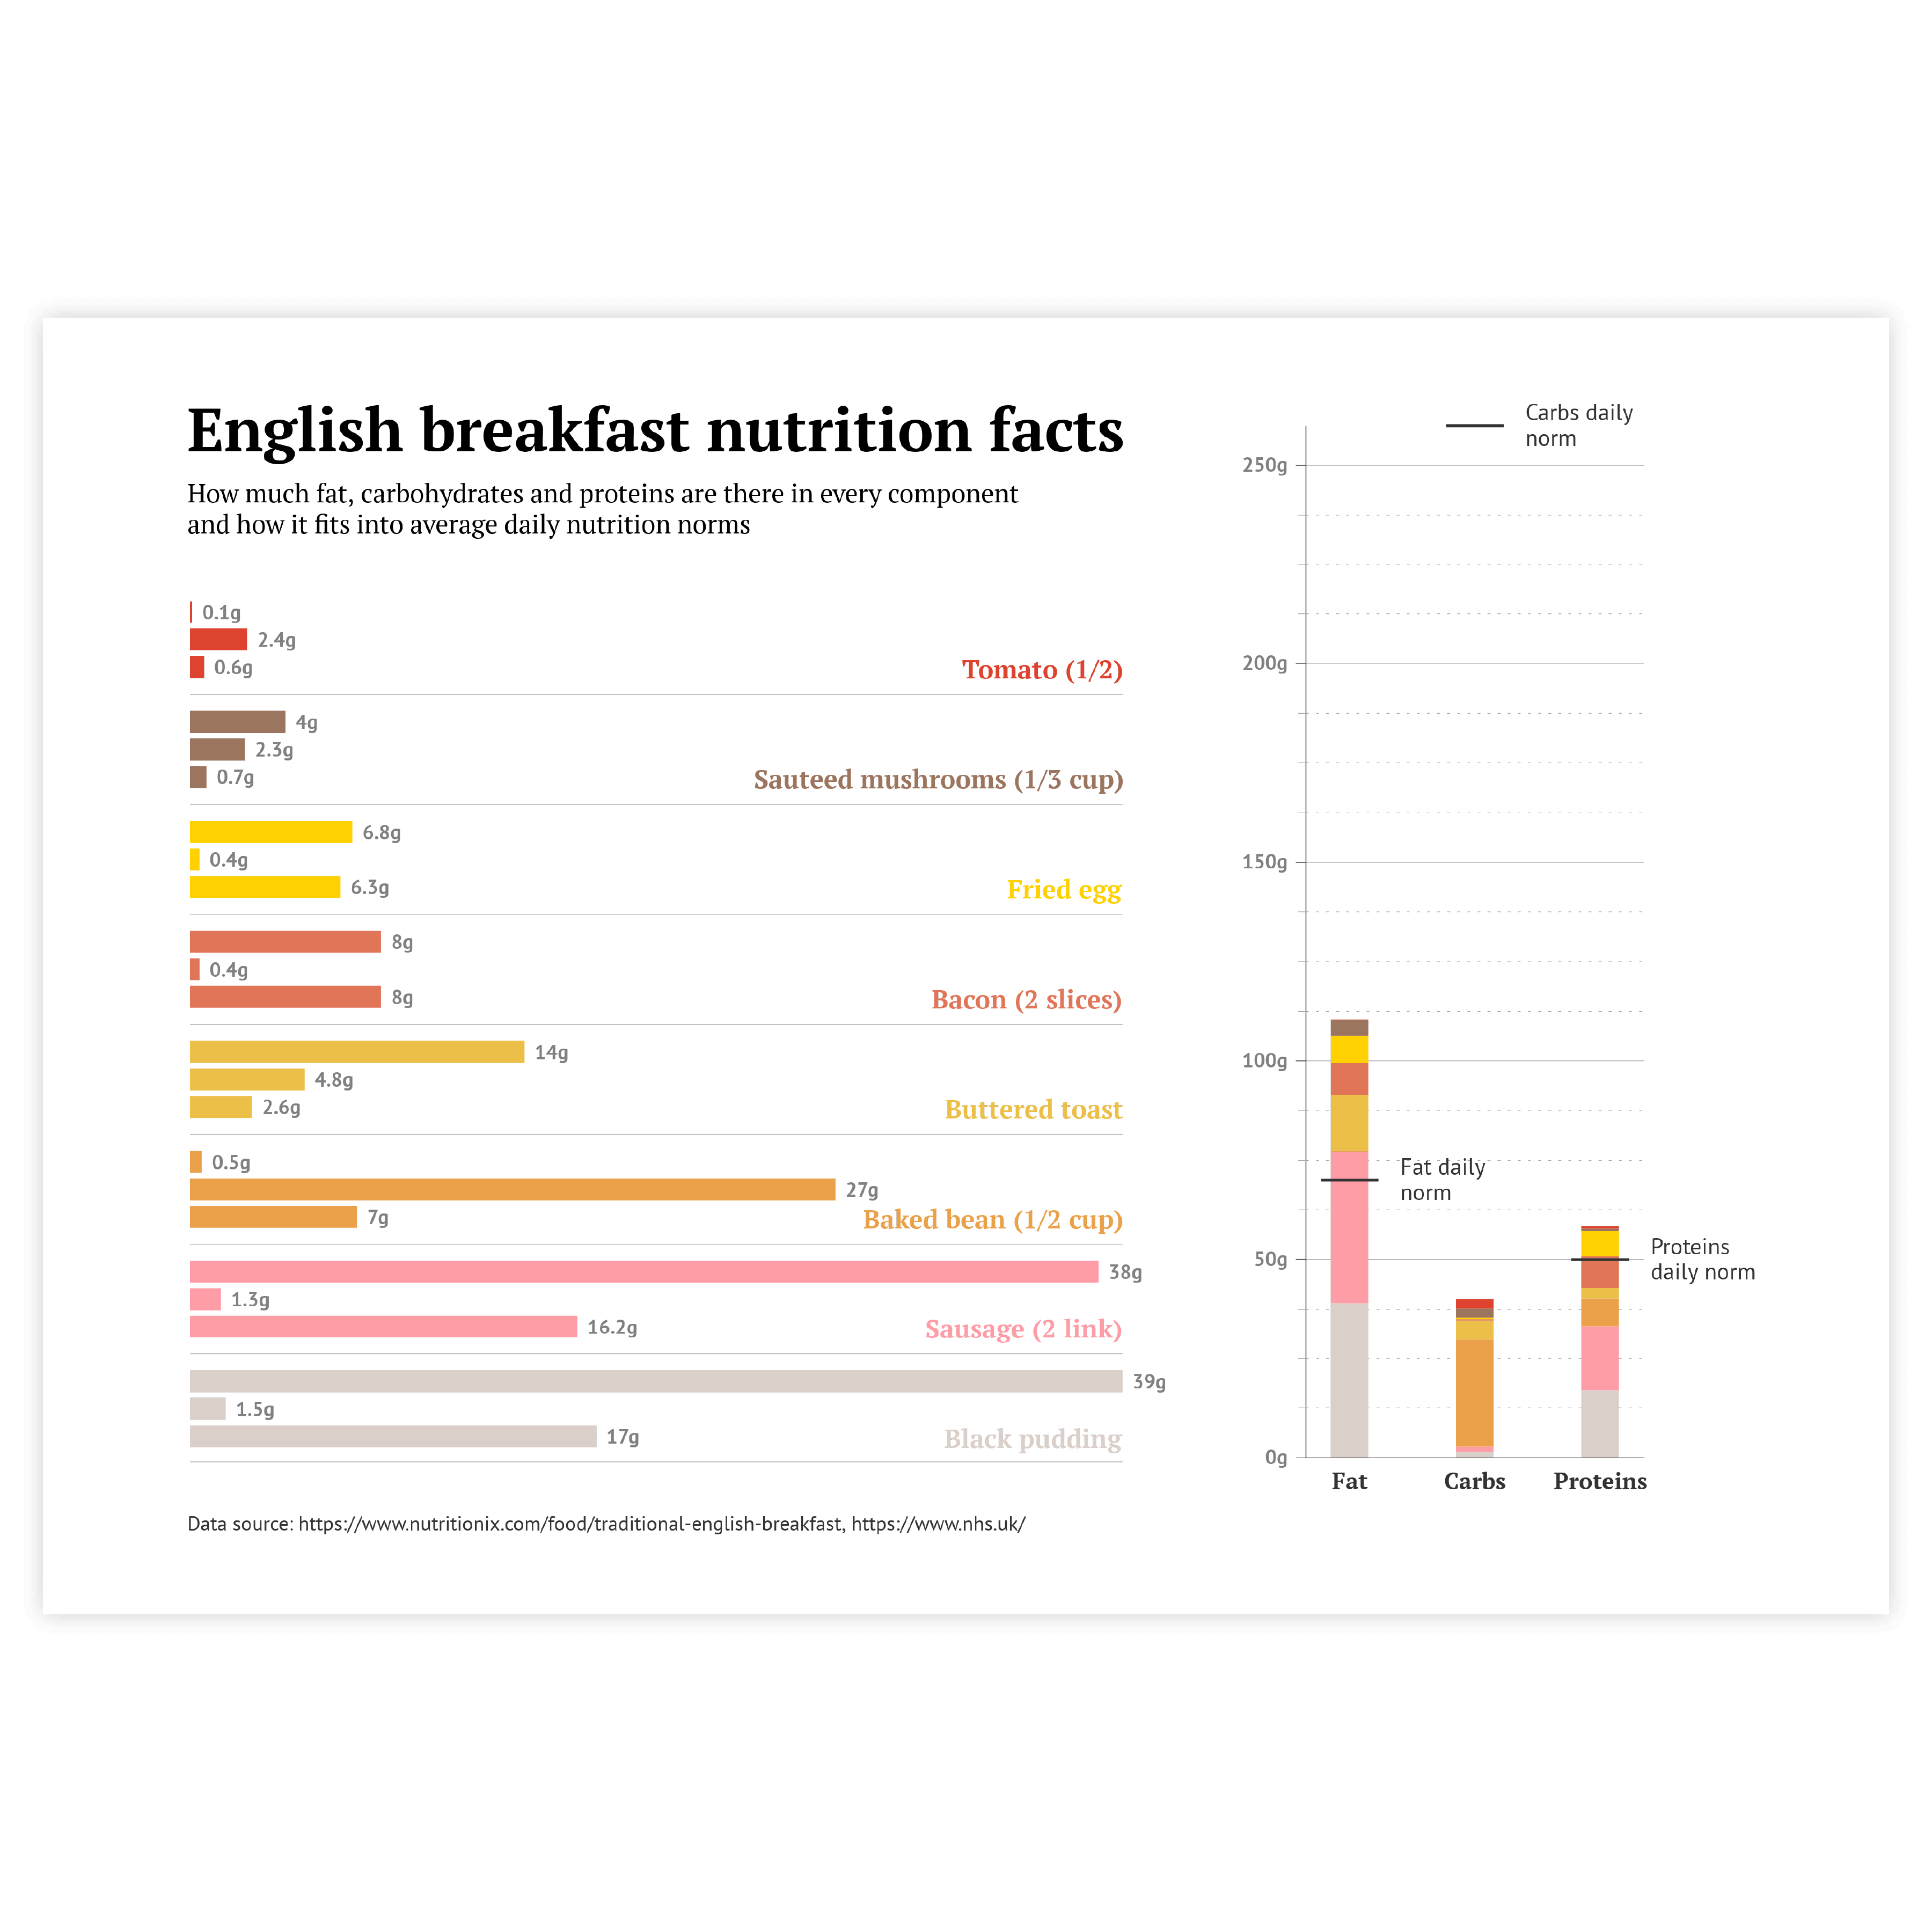
The rule of thumb for using labels in bar charts is to use data labels instead of axis labels and axes themselves. By using only data labels the visual clutter is reduced and the essential information is provided.
Read more
Coloring
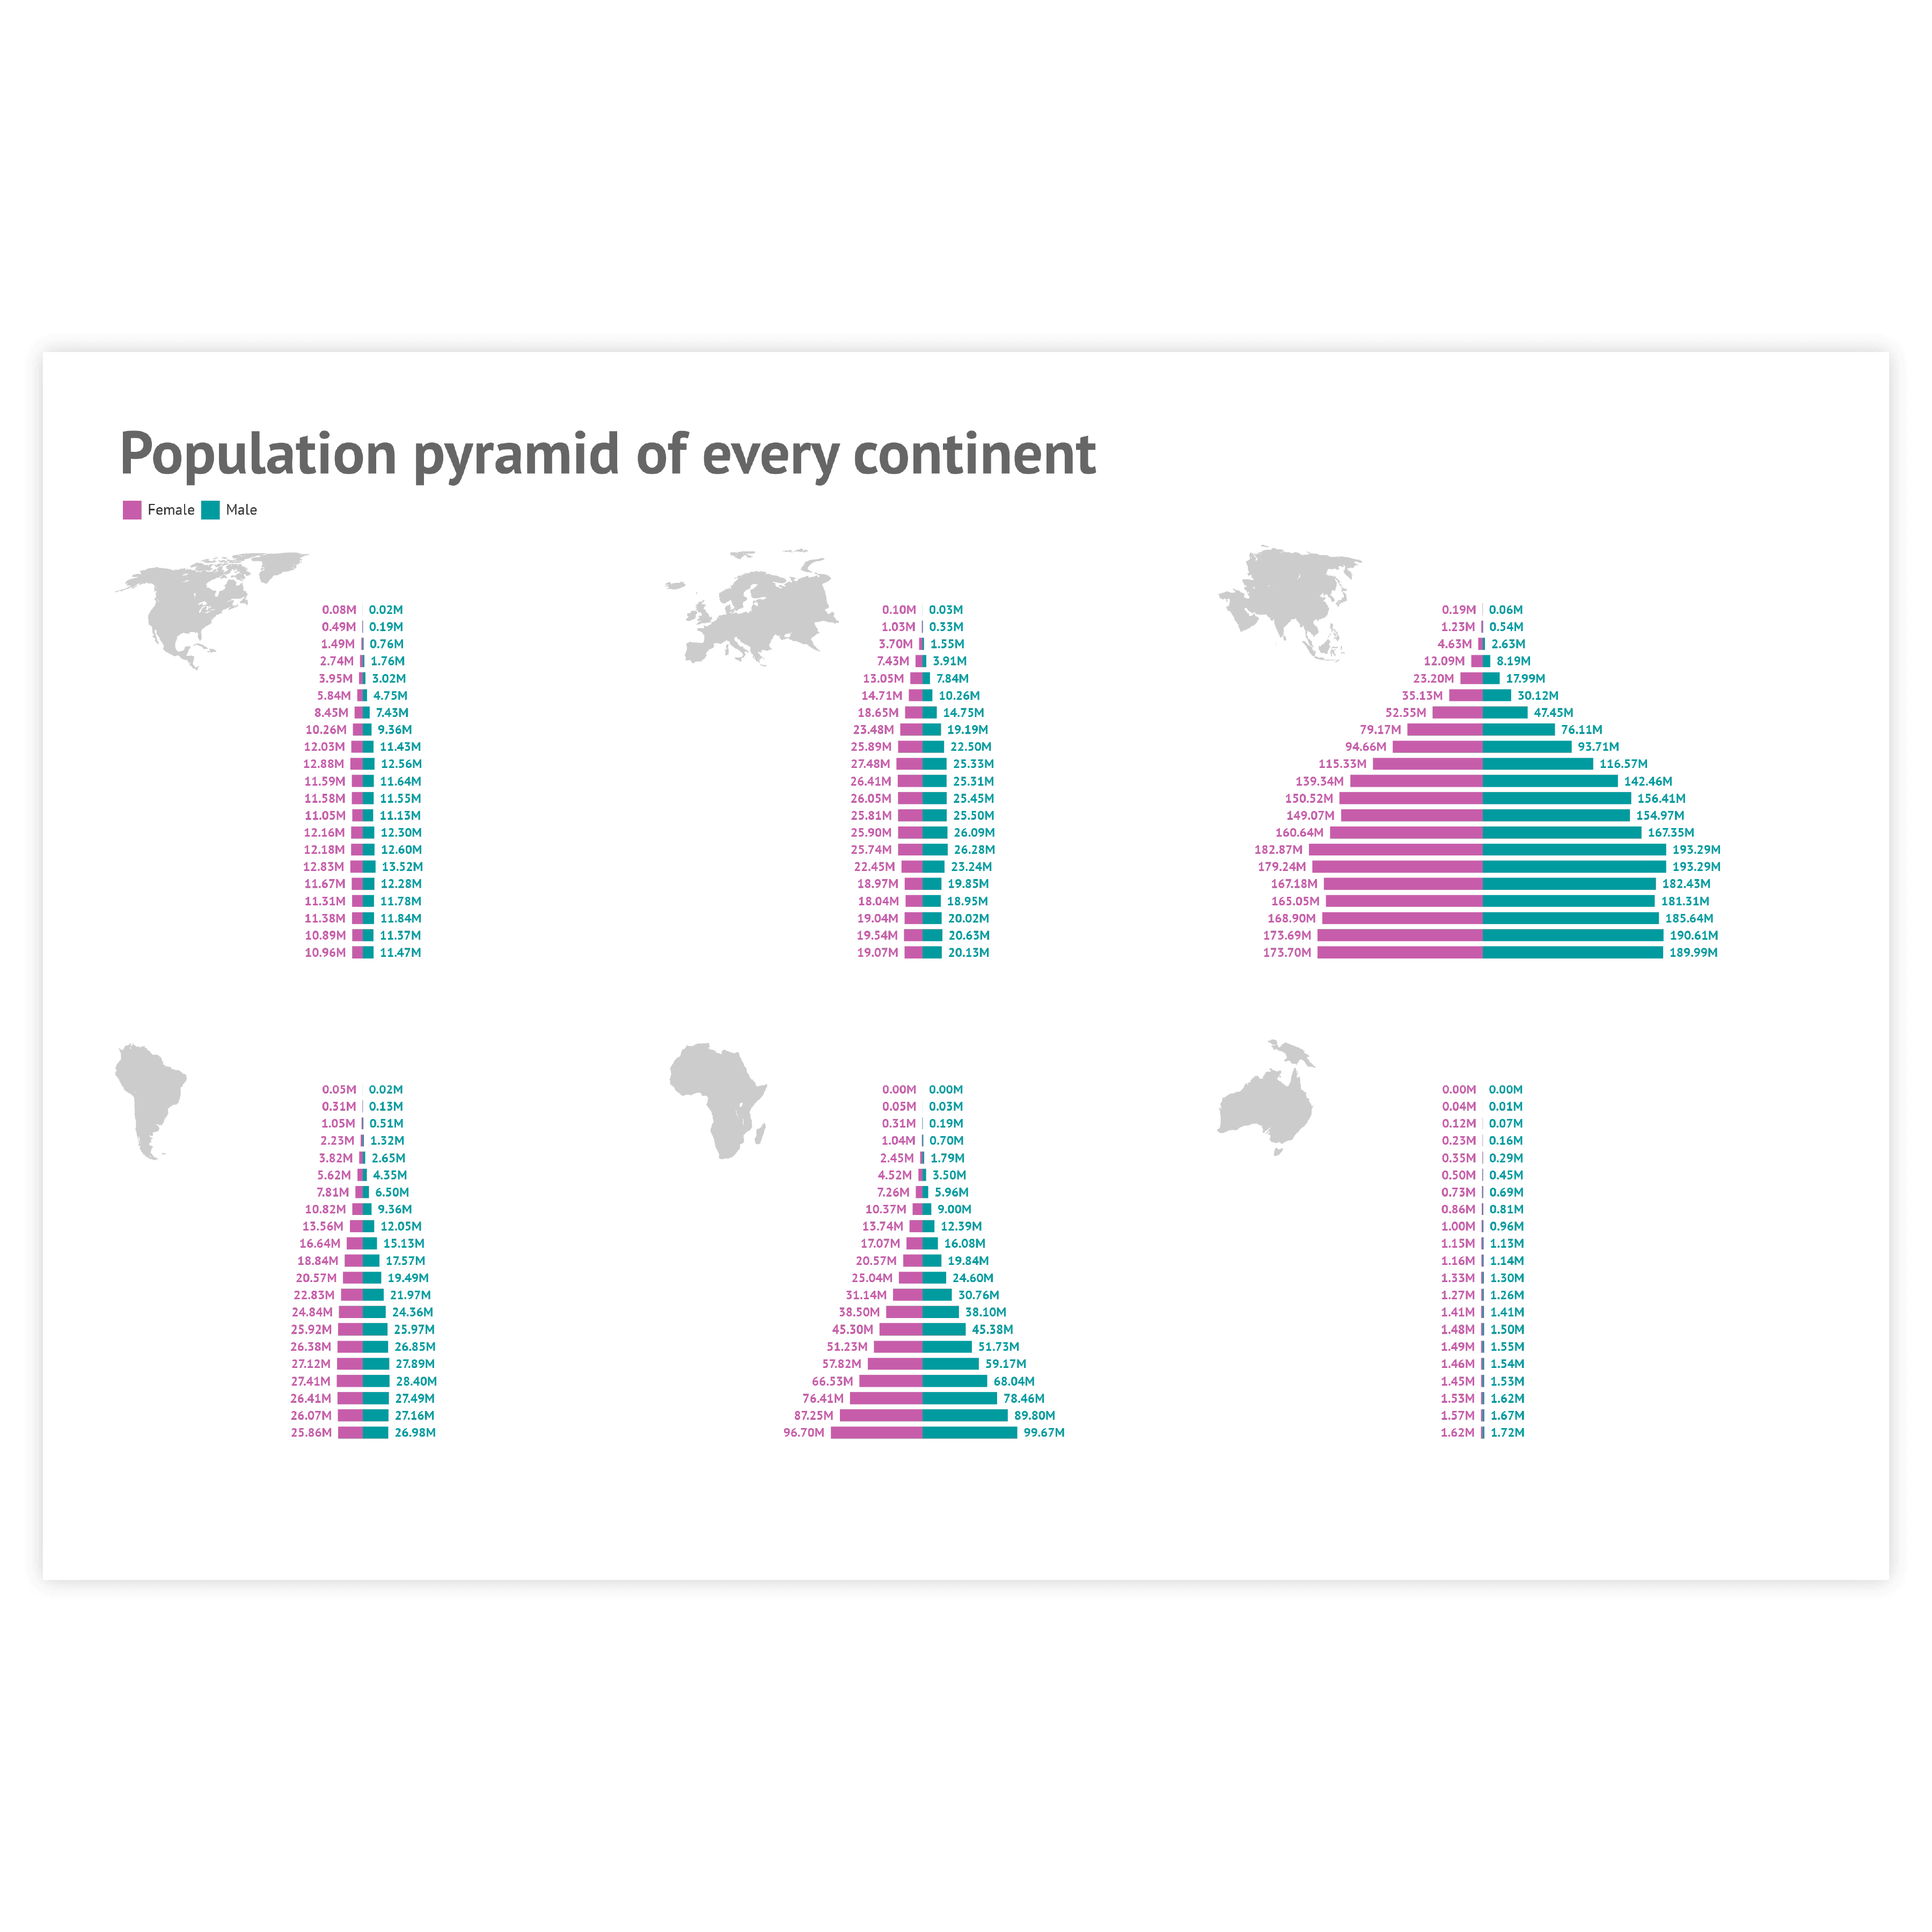
Coloring of bar charts follows the general rule of using color in data visualization – use color only if it communicates additional information. For any basic bar chart, one color should be enough. Don’t use a new color for every bar chart just to make it beautiful. It will just make a bar chart harder to read.
Read more
Highlighting
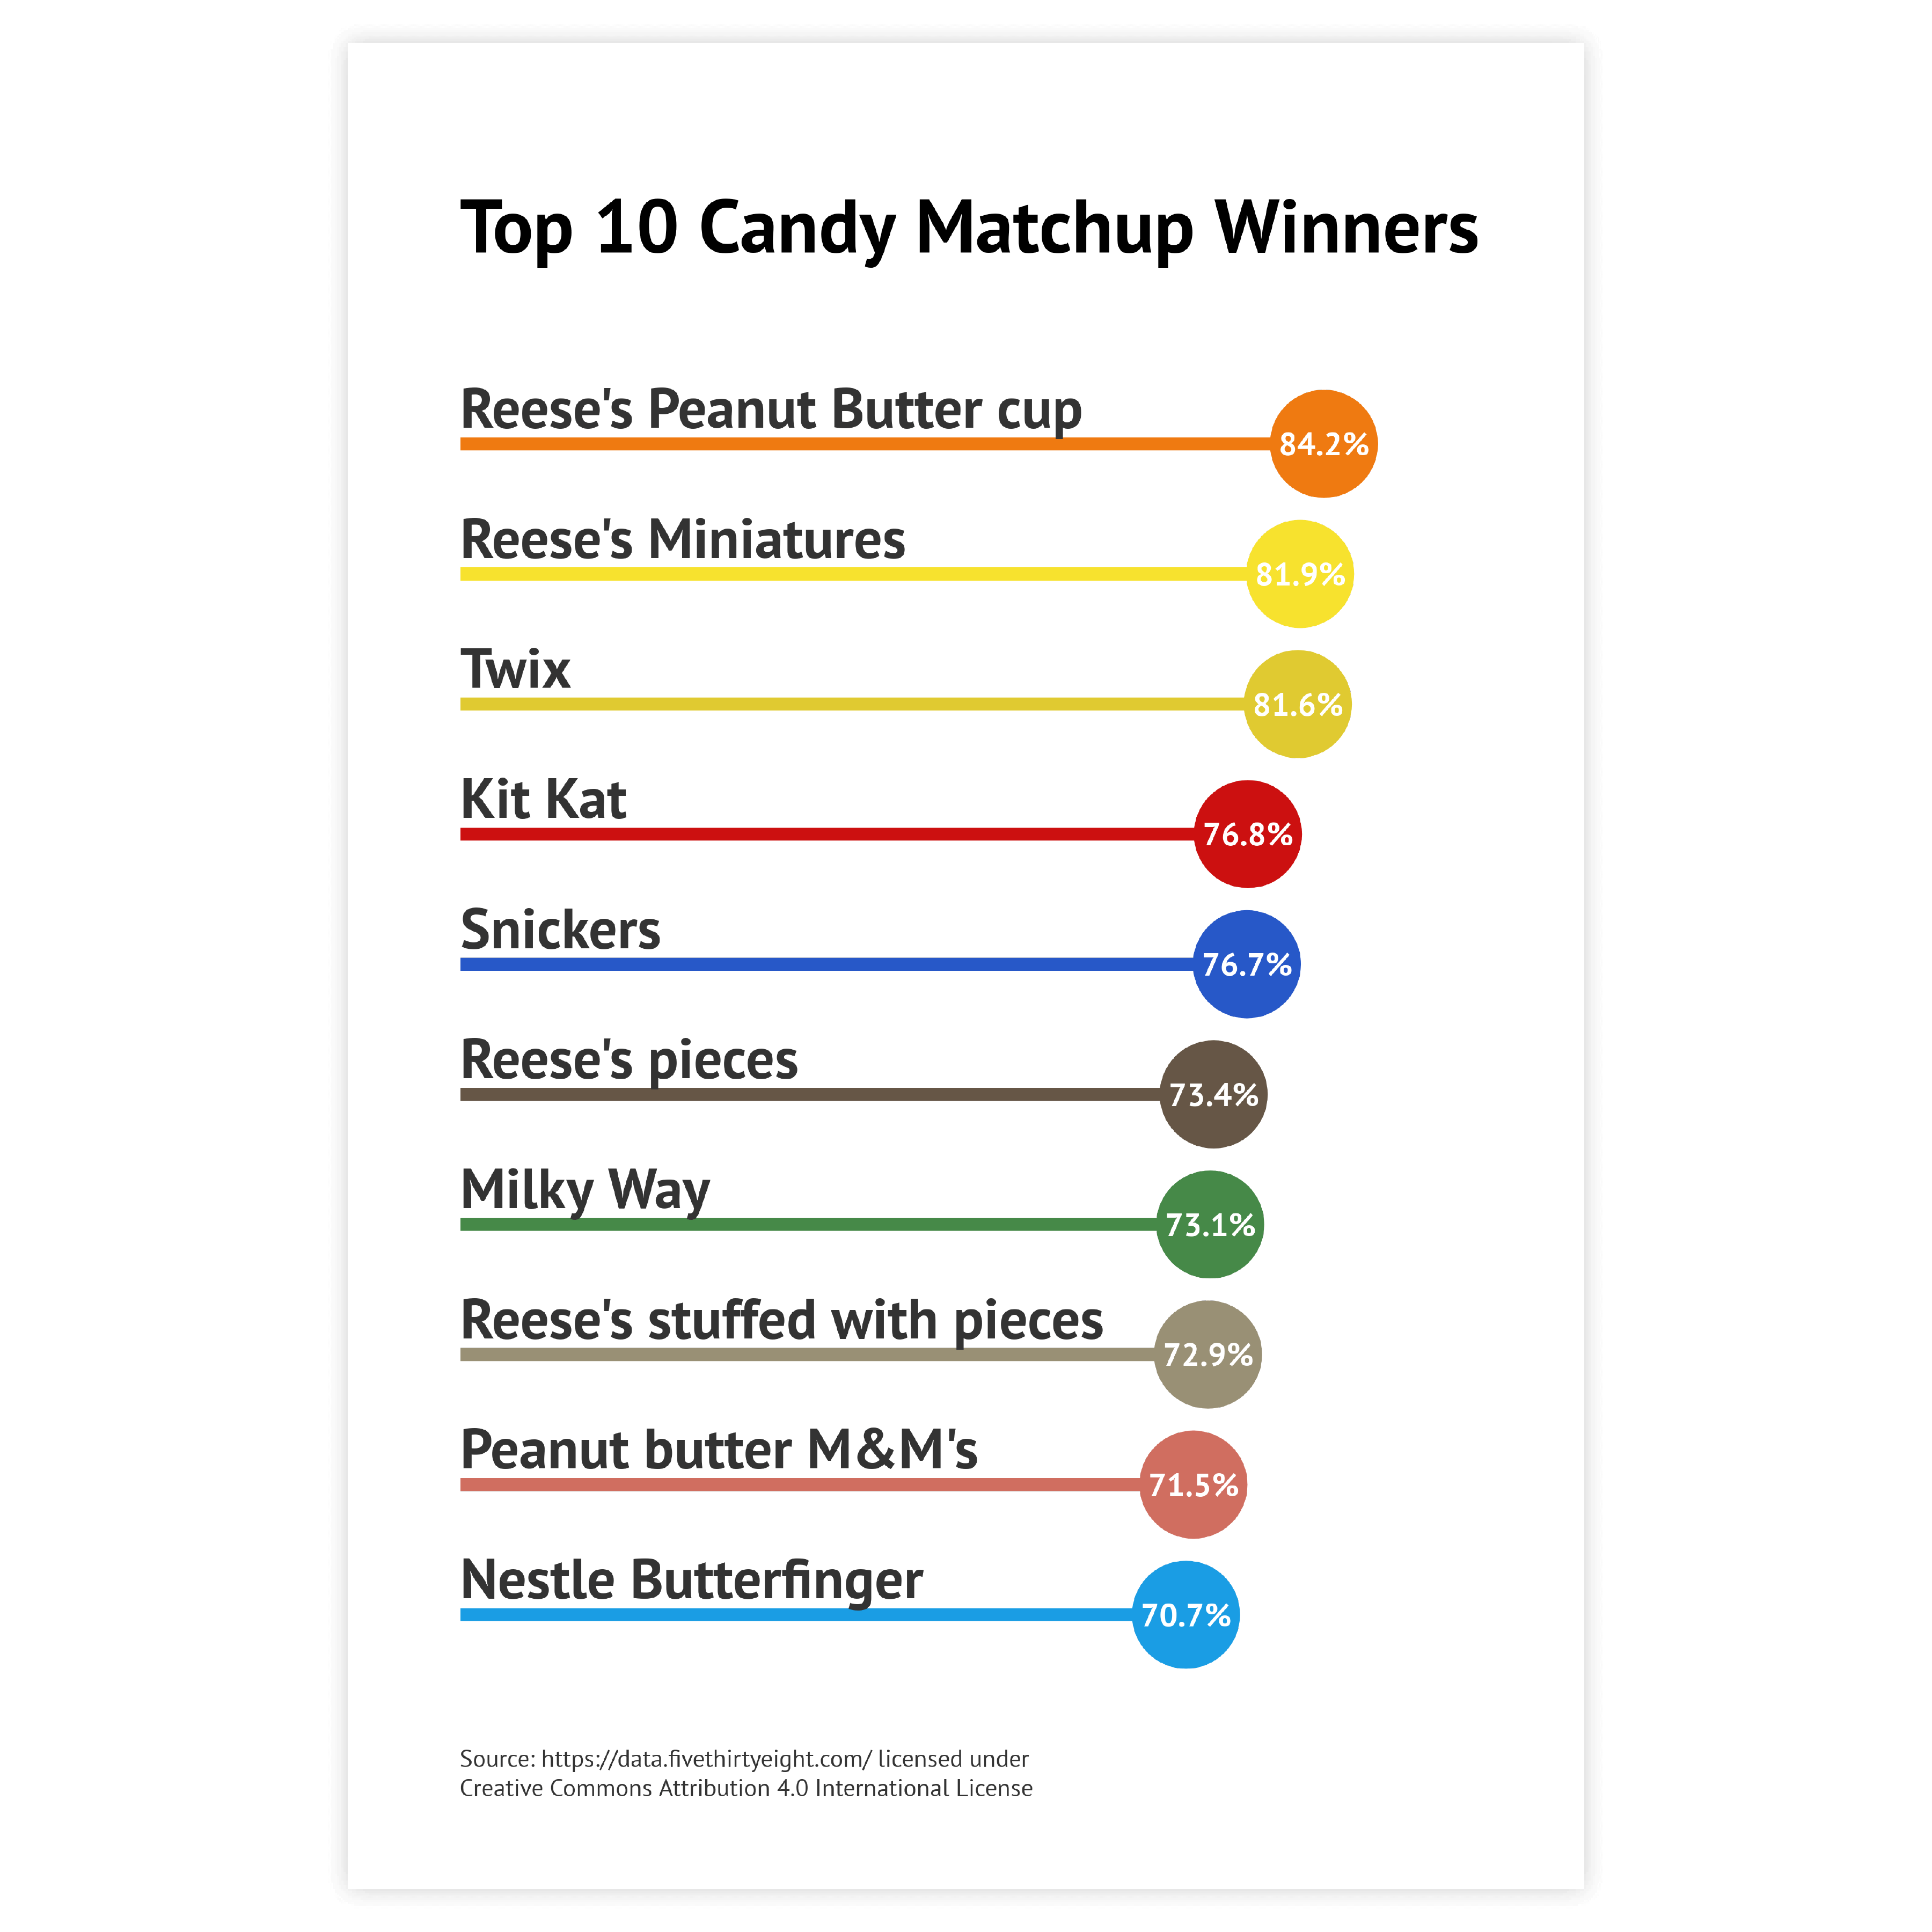
To draw attention to the most important categories of the bar chart, a good solution is to highlight these bars and color all the other bars the same way in a neutral color. Our brain is programmed to notice deviations instantly. This can be done, for example, by applying changes in size, movement, or color. This way, highlighting a specific bar will help catch the reader’s eye immediately.
Read more
Sorting
Using ascending or descending sorting puts the bars in order and helps the user to read the chart. It also reduces the time needed to compare the differences between different bars.
Read more
Overlaying bars
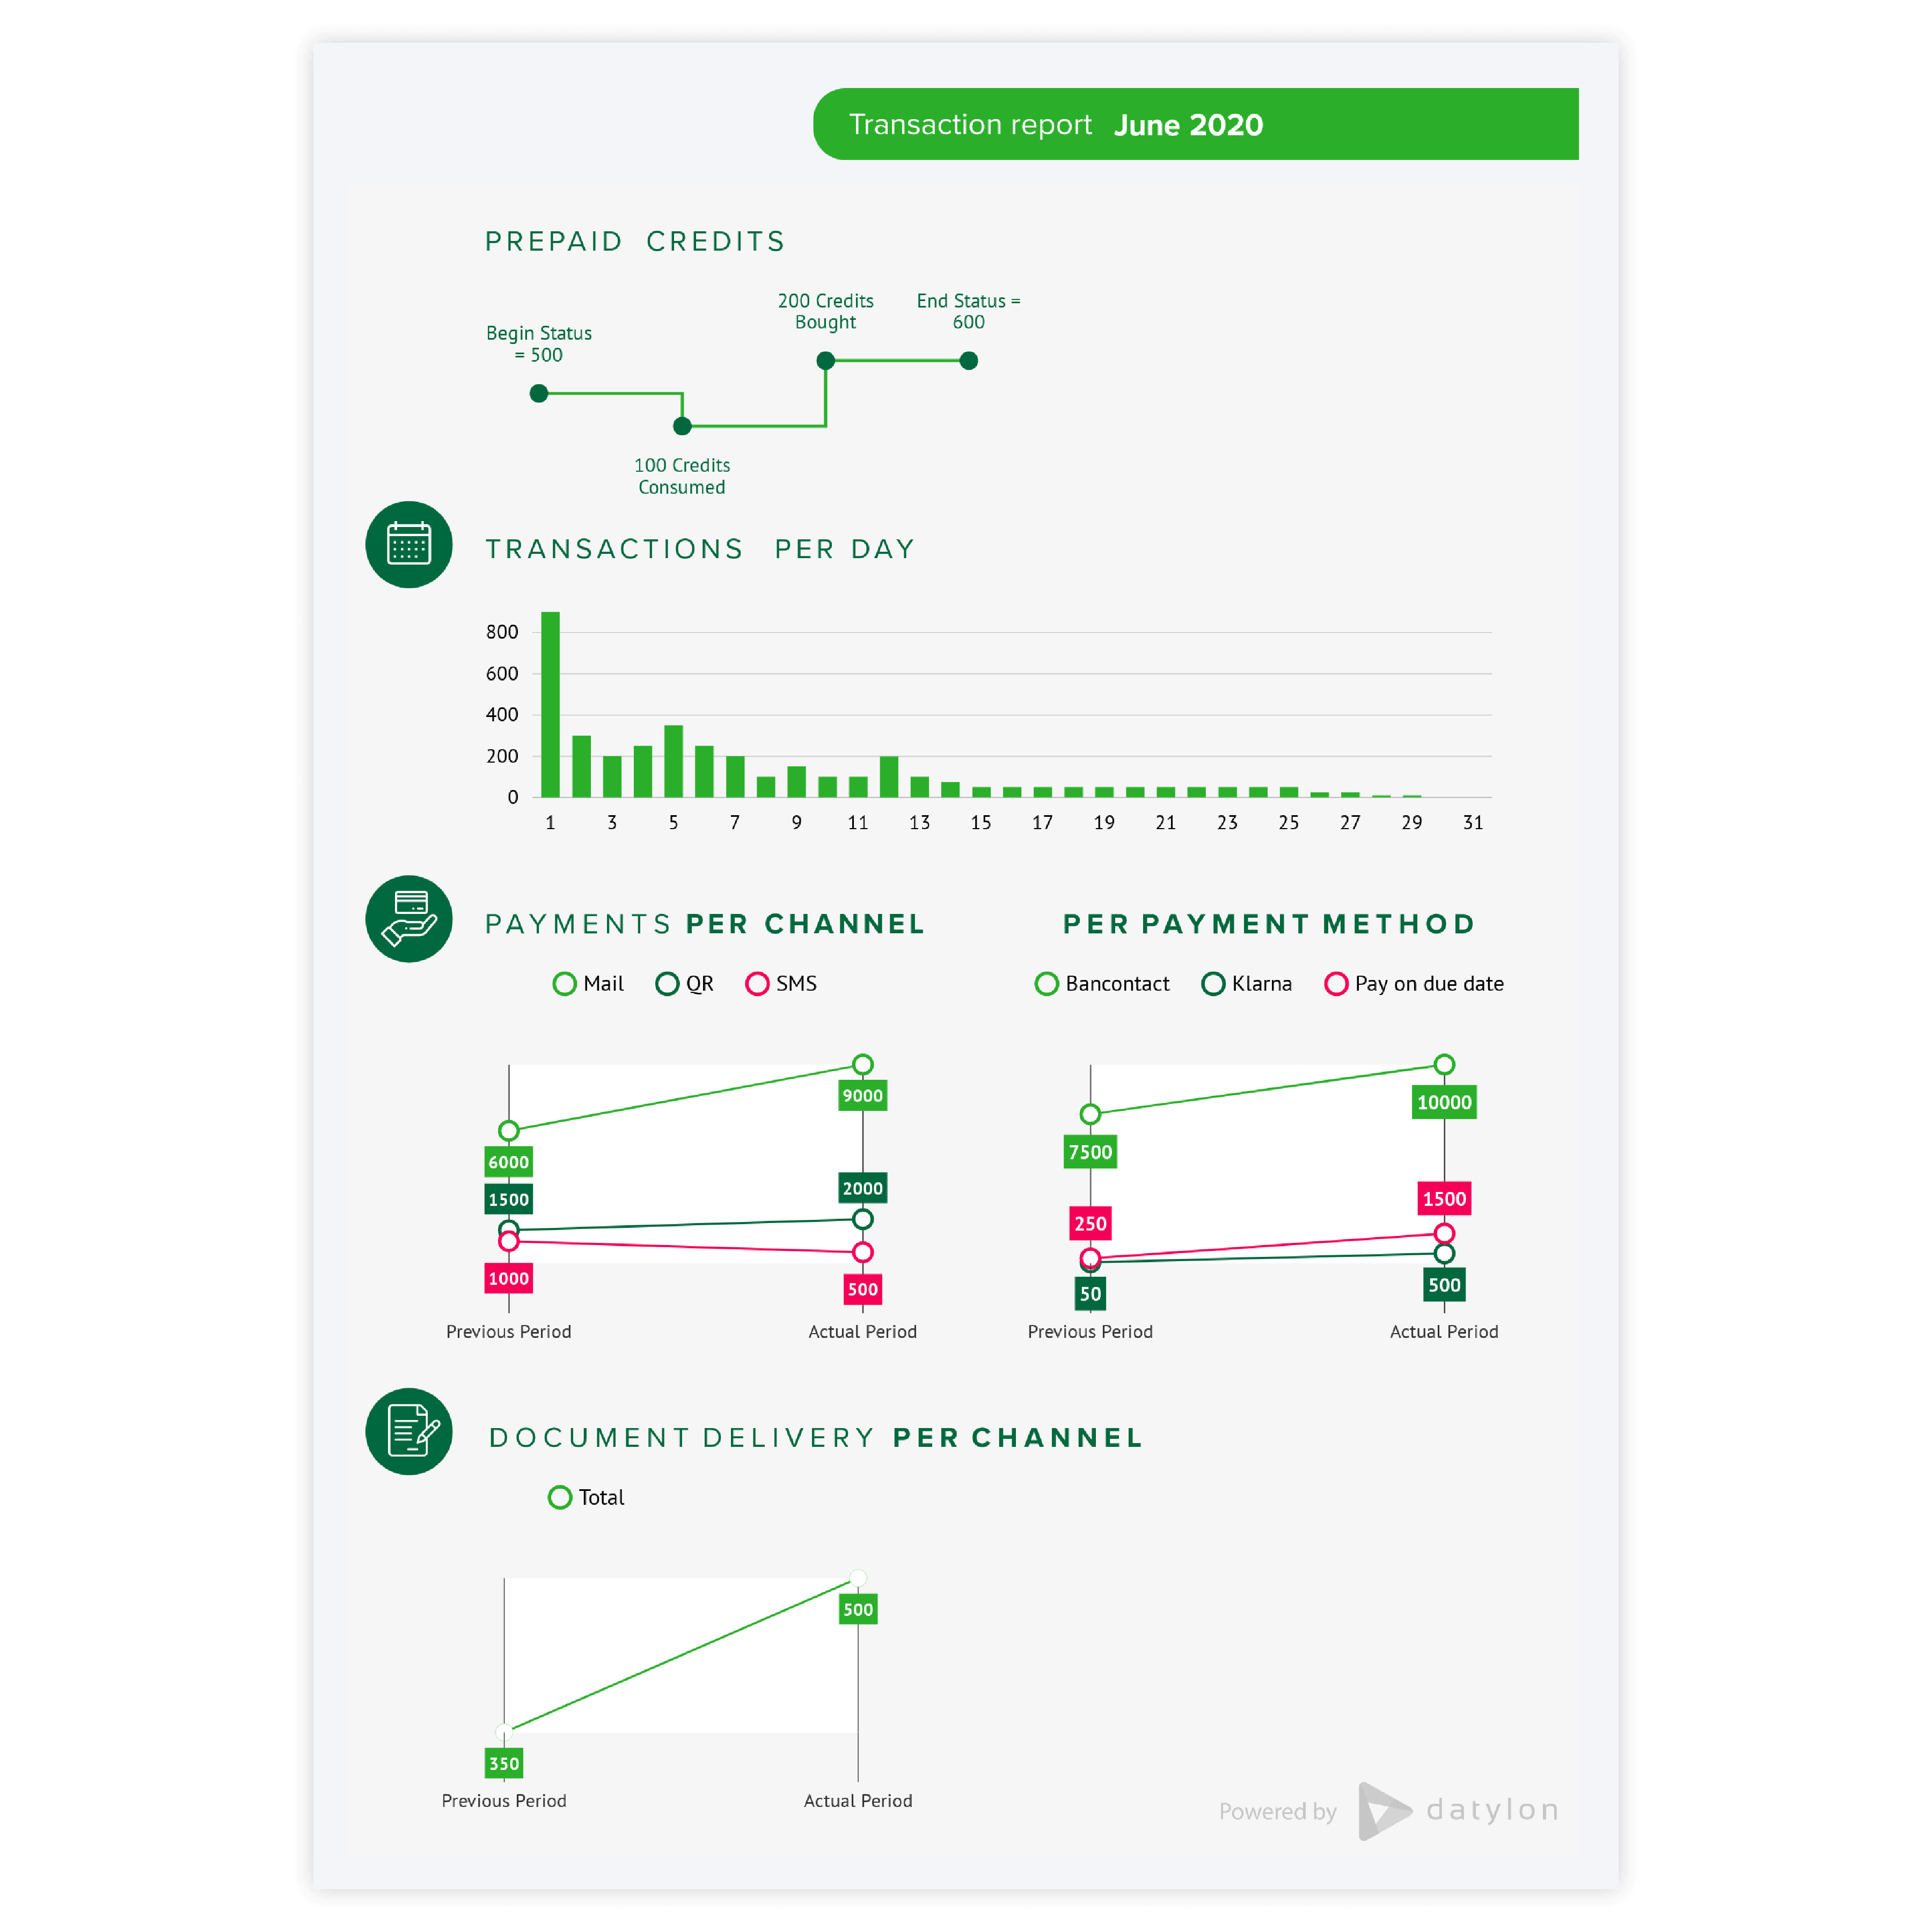
While grouped bar charts can be useful for comparing two instances of the same order, overlaying bars can spot the slightest difference between two groups of values, for example between the actual and the target value.
Read more