


Binding
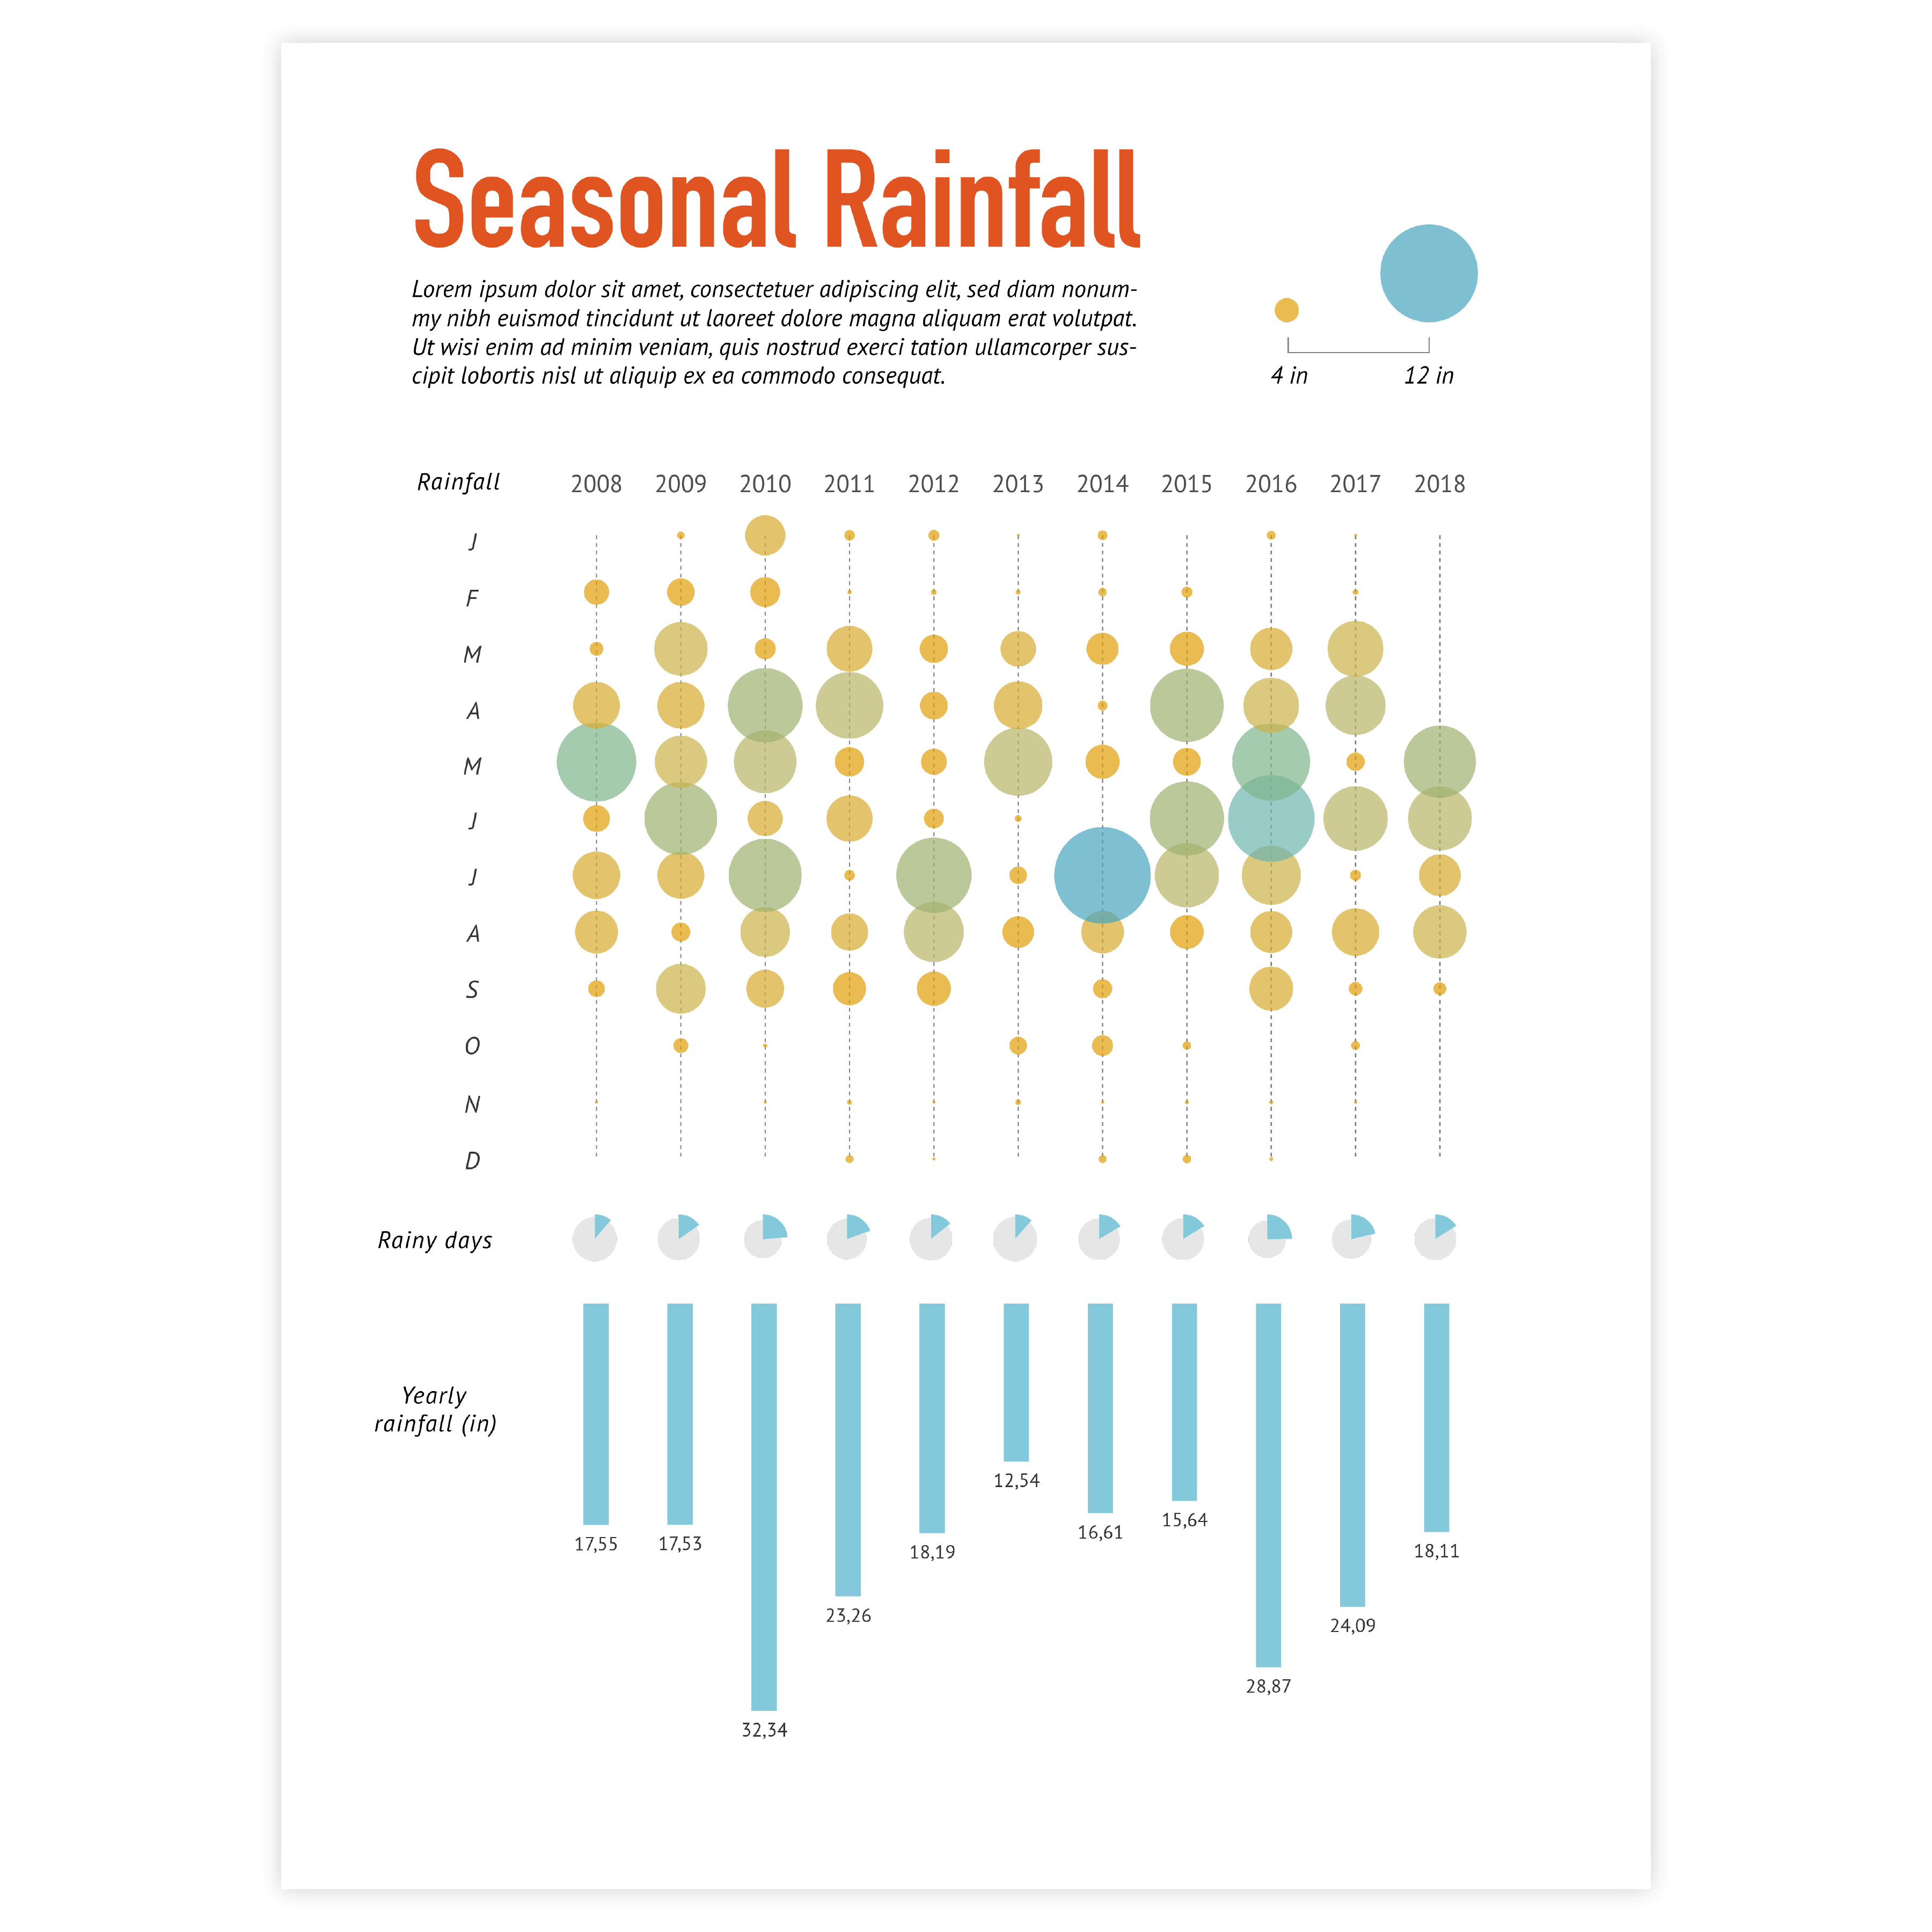
The bubble chart is a versatile chart that allows for up to seven variables to be bound. These include the X- and Y-axes, size, color, stroke color, icon, and label. It’s a record among Datylon charts. However, it's essential to exercise caution when binding too many variables as this can quickly overwhelm the reader. To ensure optimal readability, it's recommended to limit the number of bound variables to three or four.
Read more
Sorting
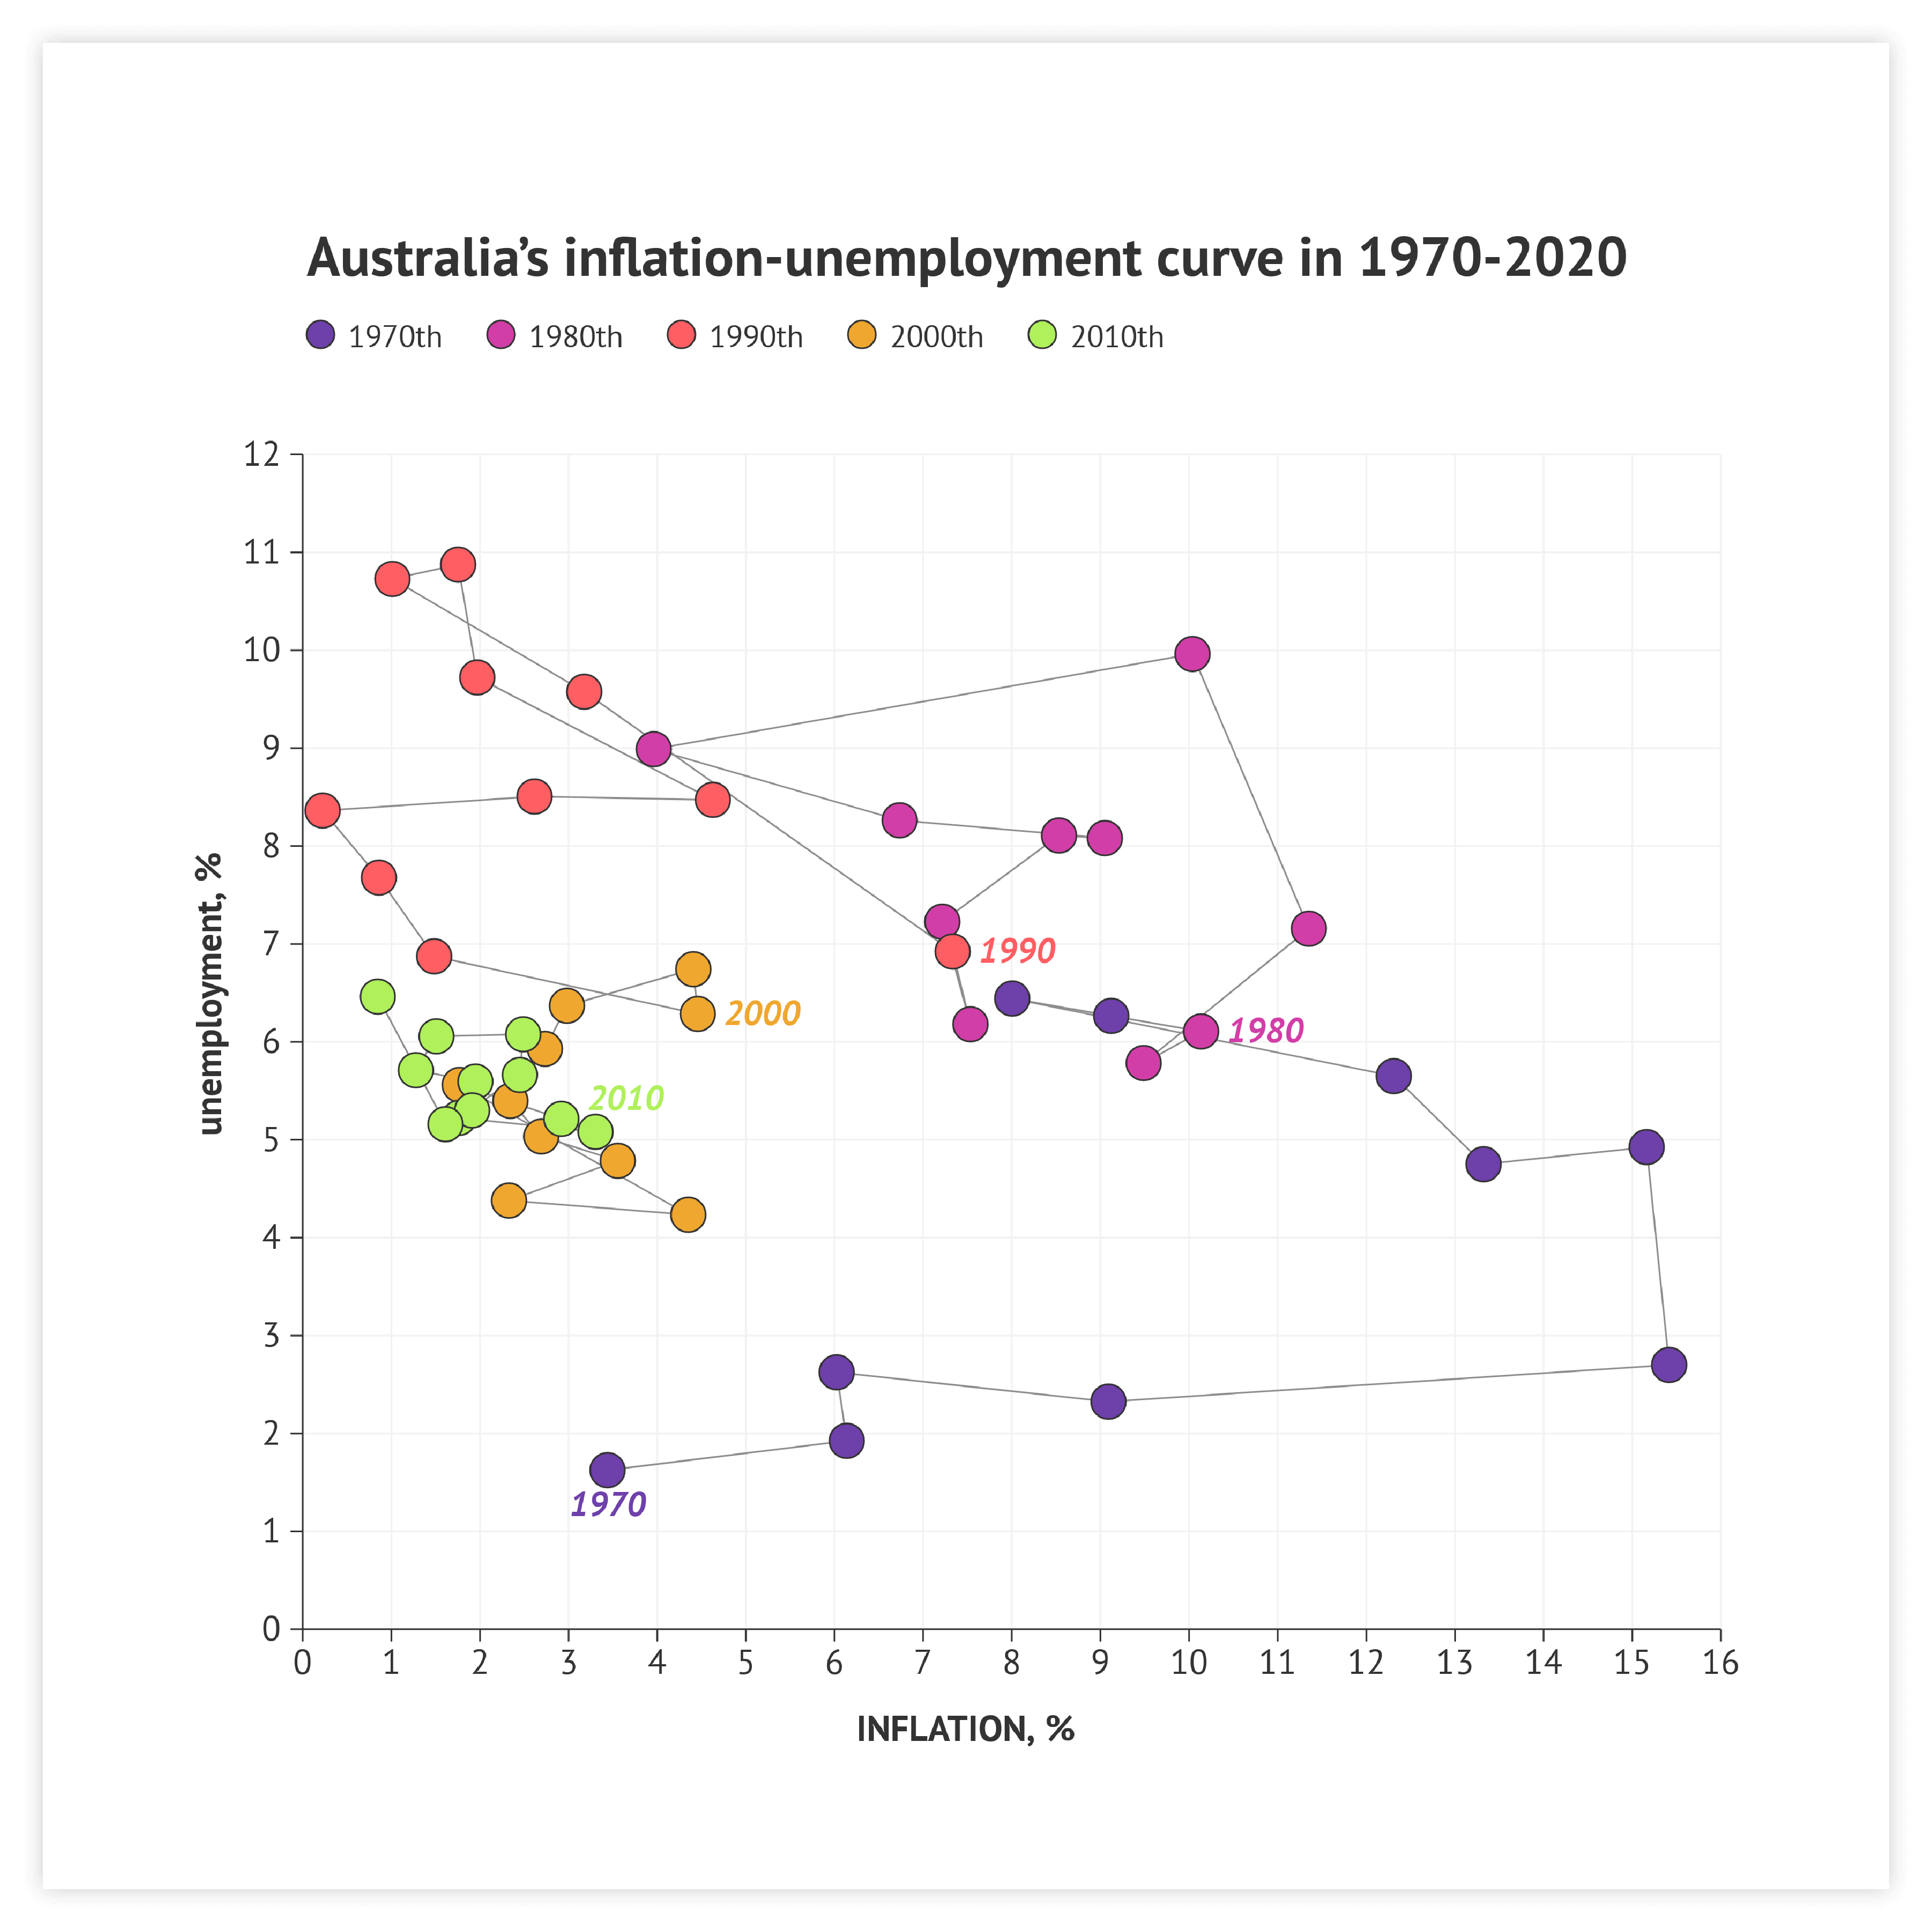
If an axis type is set to categorical, sorting can be applied: in ascending, descending and reverse order. This can be a huge timesaver if the sorting of categories hasn’t been prepared in the spreadsheet beforehand.
Read more
Coloring
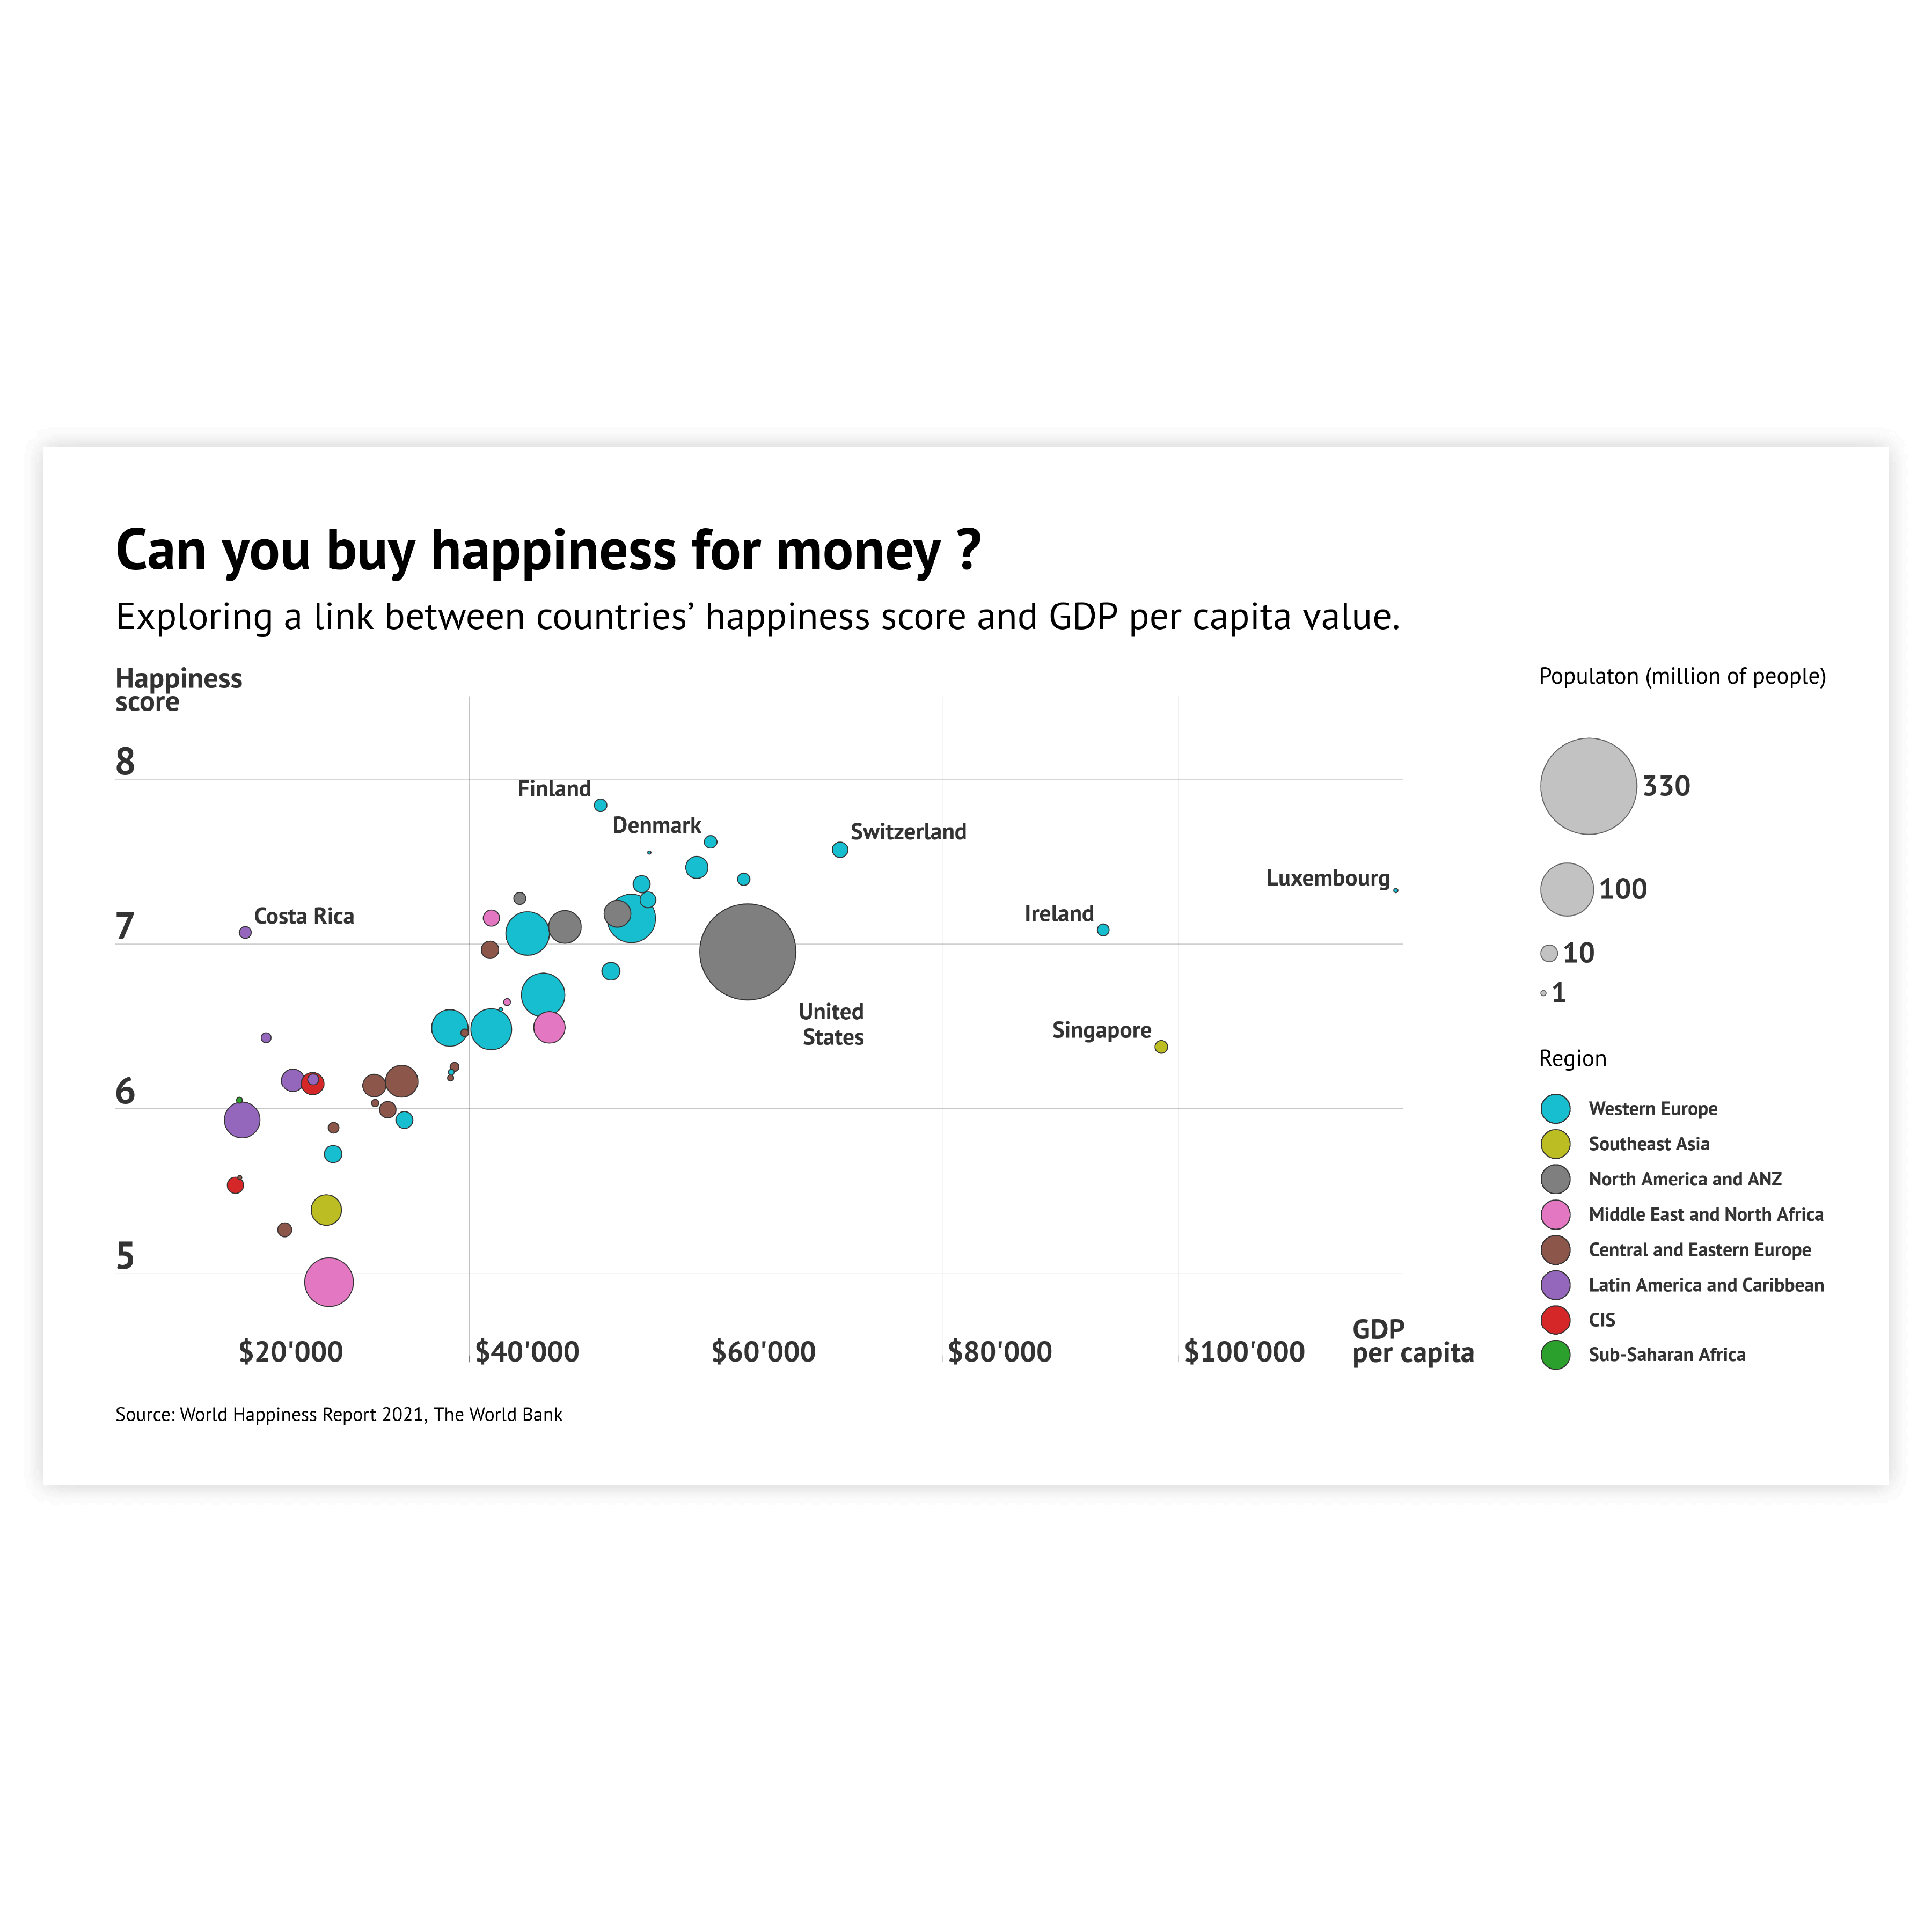
All the possibilities of coloring are available in the bubble chart. Three types of color scales allow detailed communication of both categorical and numerical data.
Read more
Data-point styling
The beauty of a bubble chart lies in the ability to customize each bubble individually, allowing for an unparalleled level of control over the appearance and emphasis of the data. With a multitude of styling options available, the possibilities for highlighting specific bubbles are truly endless. Whether it's through color, size, or shape, the ability to fine-tune the visual representation of each bubble opens up a world of creative potential for data visualization.
Read more
Labels instead of bubbles
Sometimes we don’t even need a bubble. A label on its own can be enough for communicating the message. This is done by hiding the data marks and leaving the labels only. The labels can be colored just like the data marks by using the link option for label color.
Read more
Jitter
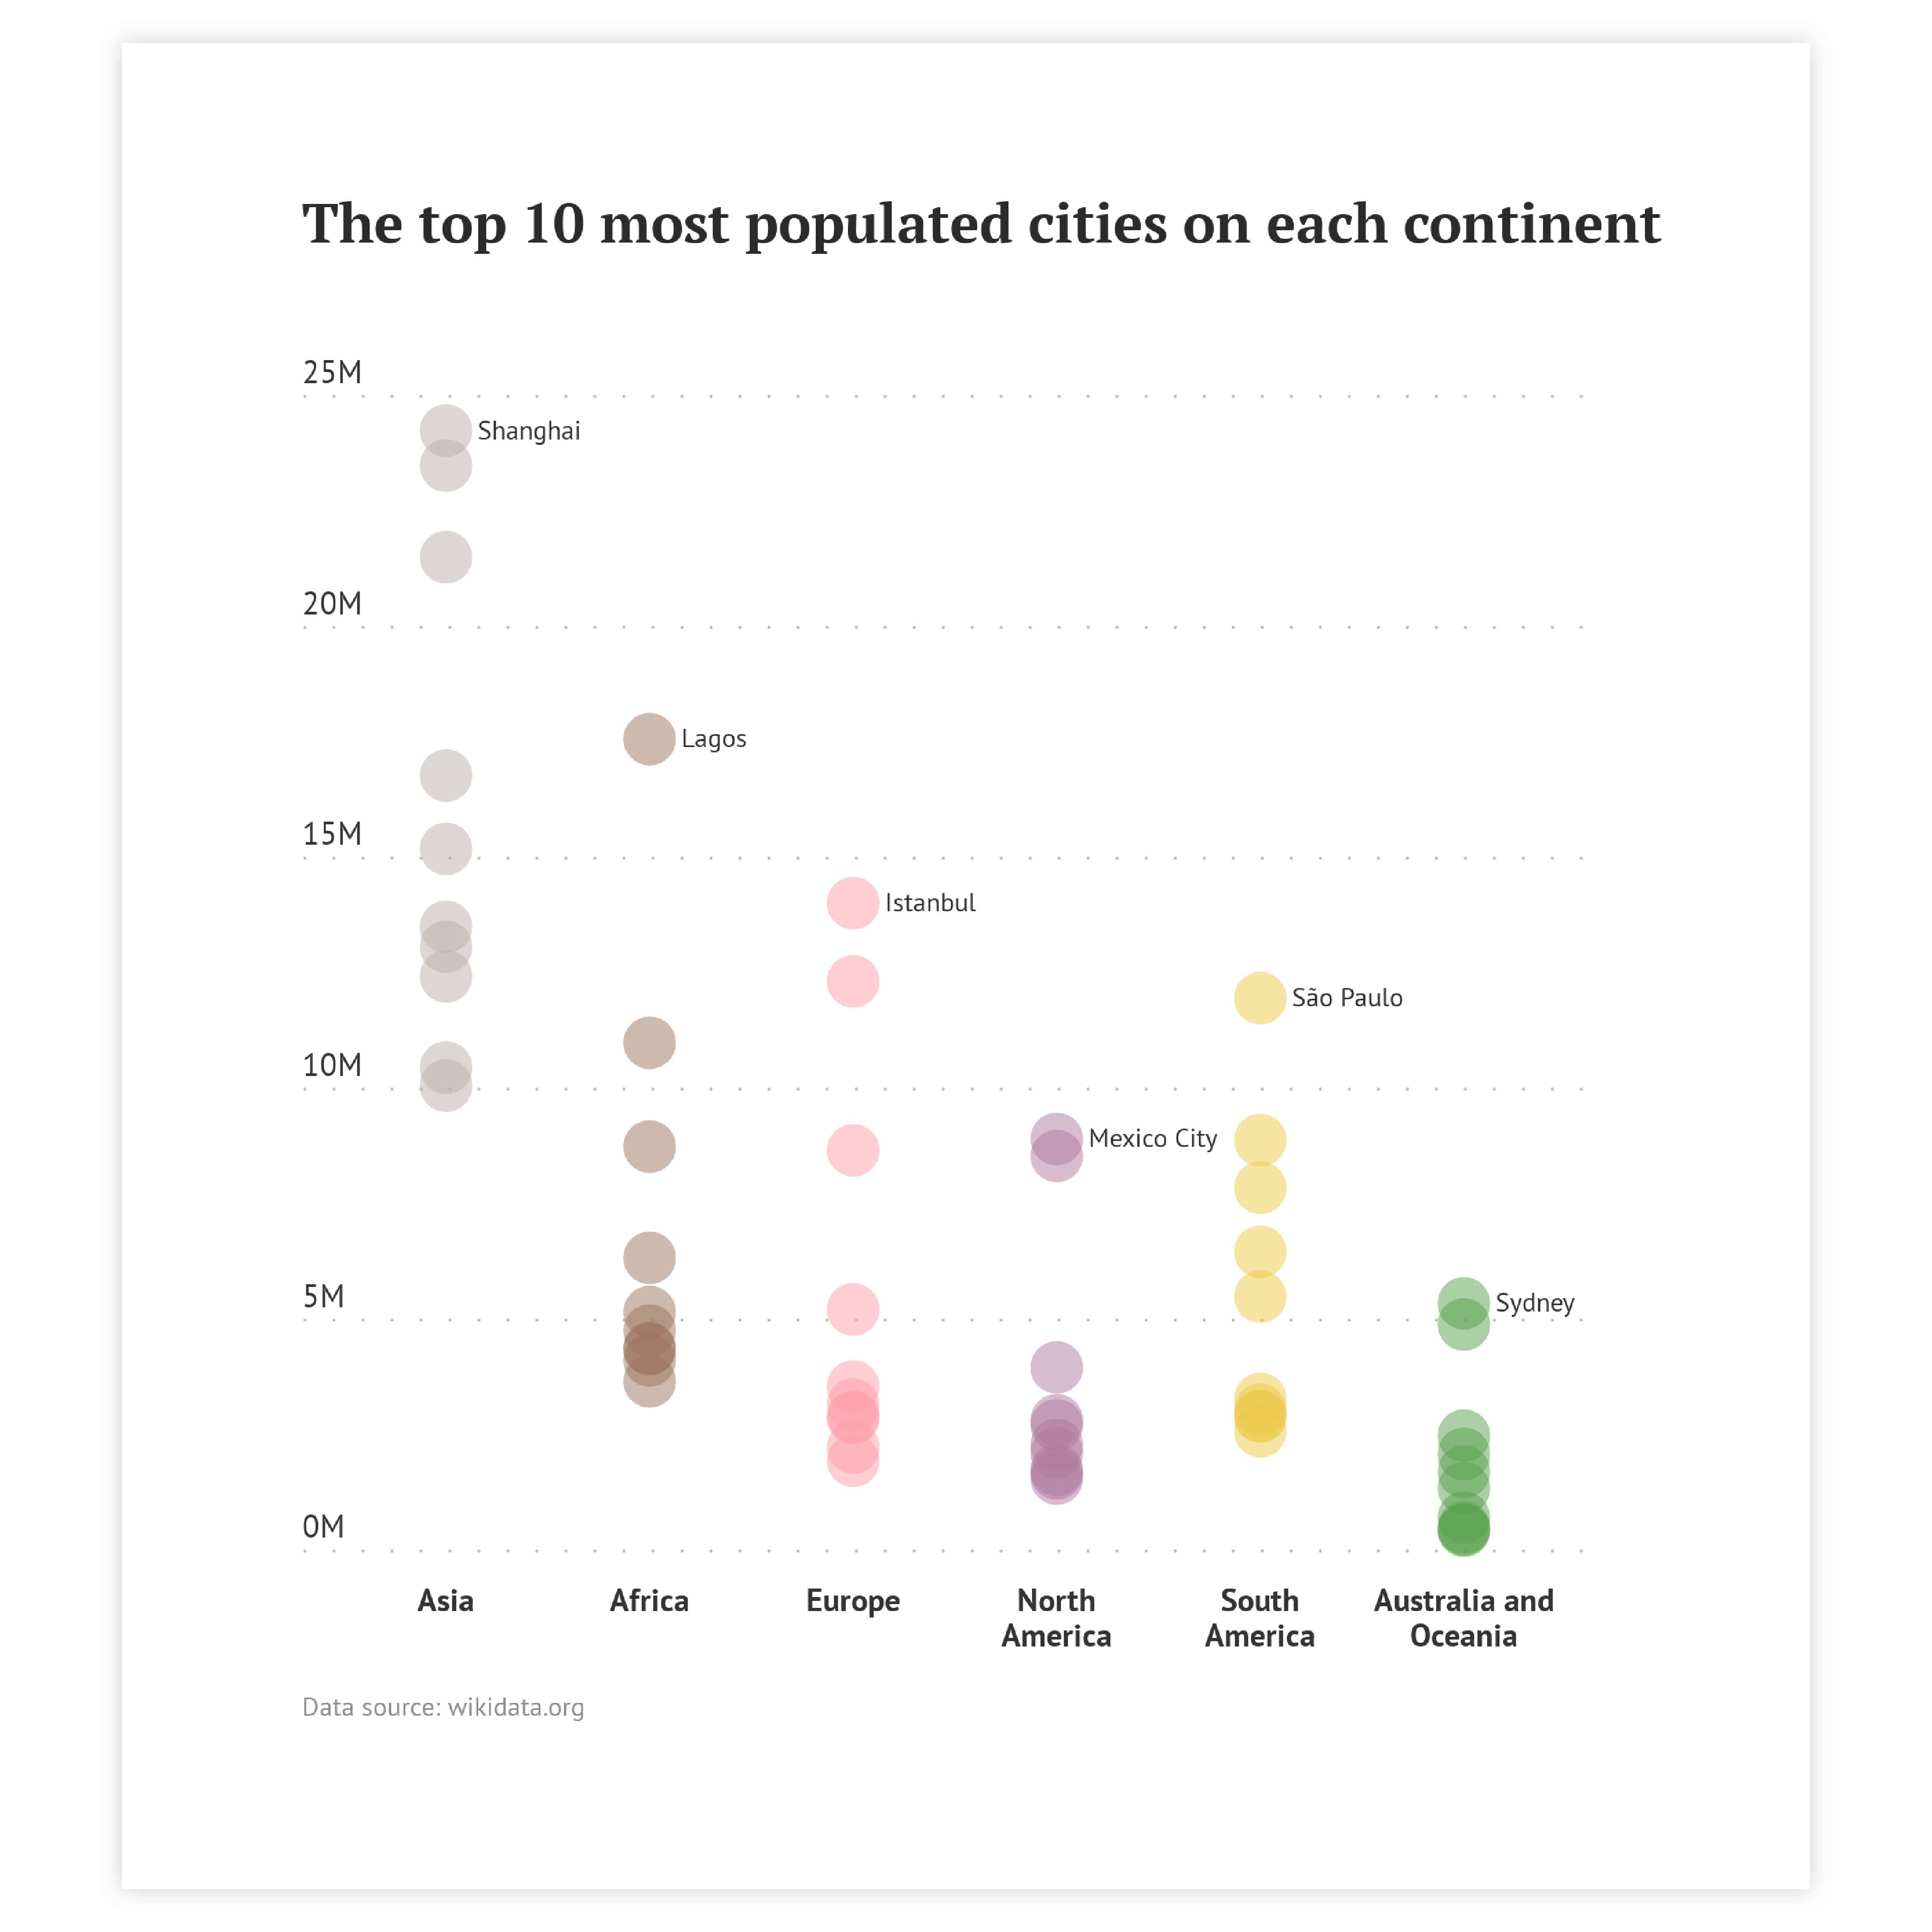
If you use a combination of numerical and categorical axes and the plots on the numerical axis are dense, you might run into overlapping data marks. To avoid that you can use the Jitter property along the categorical axis. It allows you to spread data marks near the category line and make the data marks more visible.
Read more