We all love reading Andy’s blog posts here at Datylon. In the latest one, we even felt a bit personally addressed. In ‘Five ways to… present bar charts’ - the first post in a series on his outlook on contextual, editorial, analytical, or design challenges - Andy dives into the subtleties of design choices and the impact small adjustments can have on the effectiveness of data communication.
Chart creators do lean on default tool styles a lot. Though they are not the only ones to blame for this. Often, additional styling options don’t offer good alternatives that make the visual communication of data better, they just provide some bells and whistles.
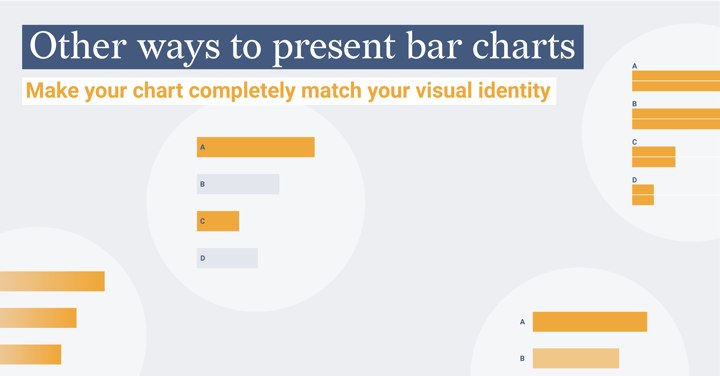
That’s why it’s the main goal of Datylon for Illustrator to take into account everything that is - as Andy puts it - ‘contextually dependent’ and to provide a super flexible solution. We aim at developing a tool that focuses on subtle design choices but also provides an abundant selection of properties that can make your chart completely match your visual identity. Hour-long meetings on what label placement options a particular chart should have are no exception in our office.
To test the current version of our tool, we copied Andy’s charts in Datylon for Illustrator and made some extra suggestions that take into account the range of the data, the size of the category labels, the number of bars, and the importance of precise readability. We’ve also added a bit more styling - staying away from bells and whistles but uplifting the attractiveness and effectiveness of the chart.
Andy’s charts remade with Datylon for Illustrator:
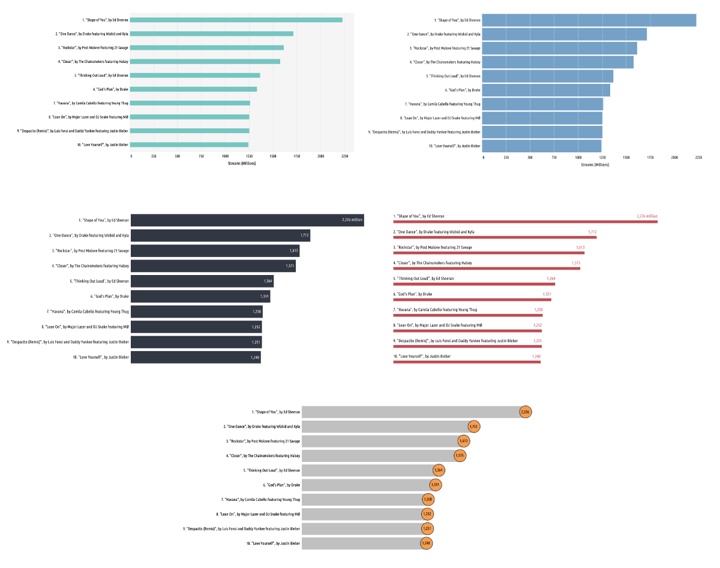
Our additional suggestions
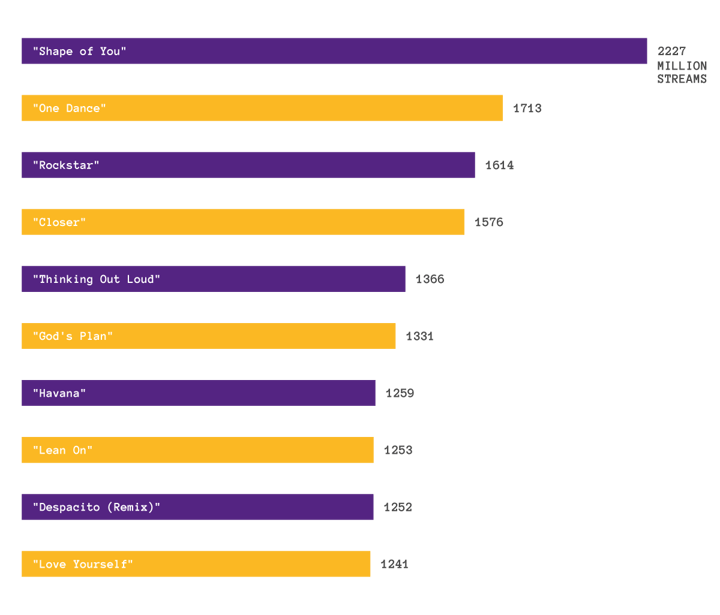
Iterating between two colors can make it easier for the eye to connect category labels to data labels. A similar technique called ‘zebra shading’ is also used in table design to let the user easily scan from left to right. A drawback of this design choice is that it can wrongly suggest that we’re dealing with different categories.
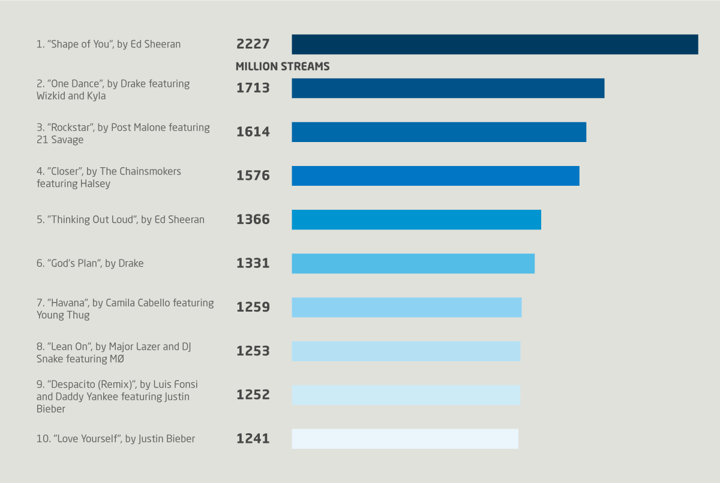
Subtle drop shadows make it possible to use sequential color palettes with lighter colors that otherwise would disappear in the background color. Placing category and data labels side by side at the start of the bars puts emphasis on the specific values.
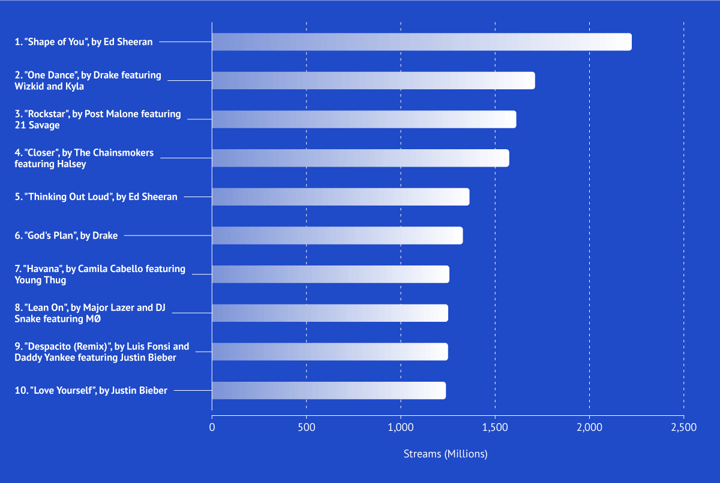
Adding connectors to category labels lets you left-align the labels, which is better for readability, whilst still linking labels to the bar. A gradient that ends in a brighter color suggests direction and makes you focus on the end of the bars. This technique lets you focus more on comparing the position of the endpoints instead of comparing the area sizes.
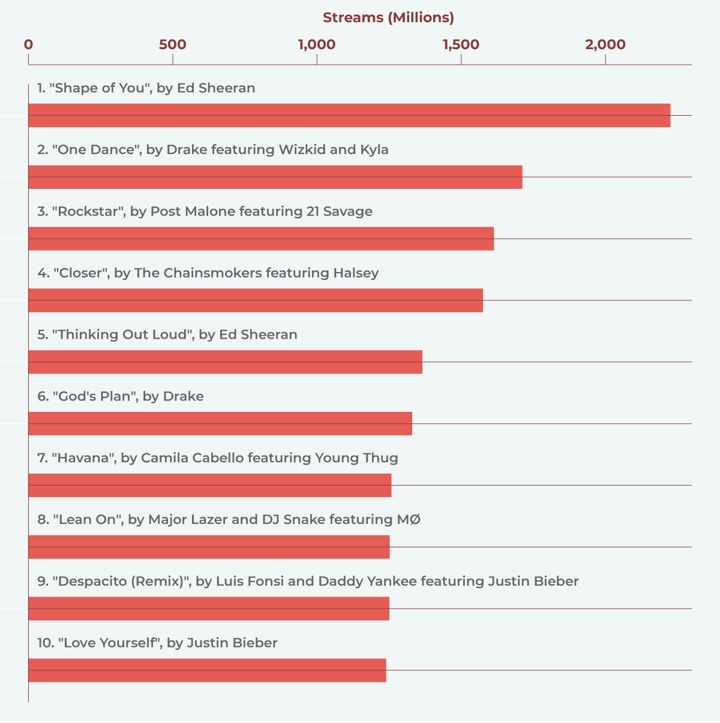
Placing labels above bars is especially useful when dealing with long category labels. By adding horizontal gridlines, you enhance the grouping of elements that go together.
We hope this inspires you to come up with even more ways to present bar charts. The native Adobe Illustrator files of the above charts can be downloaded soon on our Datylon Helpcenter. Stay tuned!