Datylon
  • Product
    • Product Overview
    • Datylon Chart Library
    • Datylon for Illustrator
    • Datylon Server
    • Datylon Enterprise
  • Inspiration
  • Pricing
  • Projects
  • Resources
    • Customer Stories
    • Blog
    • FAQ
    • Help Center
  • About us
    • Why Datylon
    • Jobs
Sign in
Get started
Location insights solution for Proximus MyAnalytics
Customer Stories> Project, Telecommunications

Building an innovative location insights solution for Proximus

SHARE

The Proximus team looked for better and more timely ways to deliver specialized Location Insights Solutions (LIS) reports. They contacted Datylon to create a custom solution, Proximus MyAnalytics. Receiving daily mobile data feeds, this easy-to-use platform delivers clear location insights for marketeers and business analysts.

Understanding the challenge

There was too much lag time delivering Location Insights Solutions (LIS). With their network producing increasingly sought-after data, and not enough specialised resource to deliver to demand potentials, the Proximus team knew that there must be a better way to deliver specialized LIS reports to their customers in a timely manner.

Location insights solution for Proximus MyAnalytics


Designing & delivering the solution

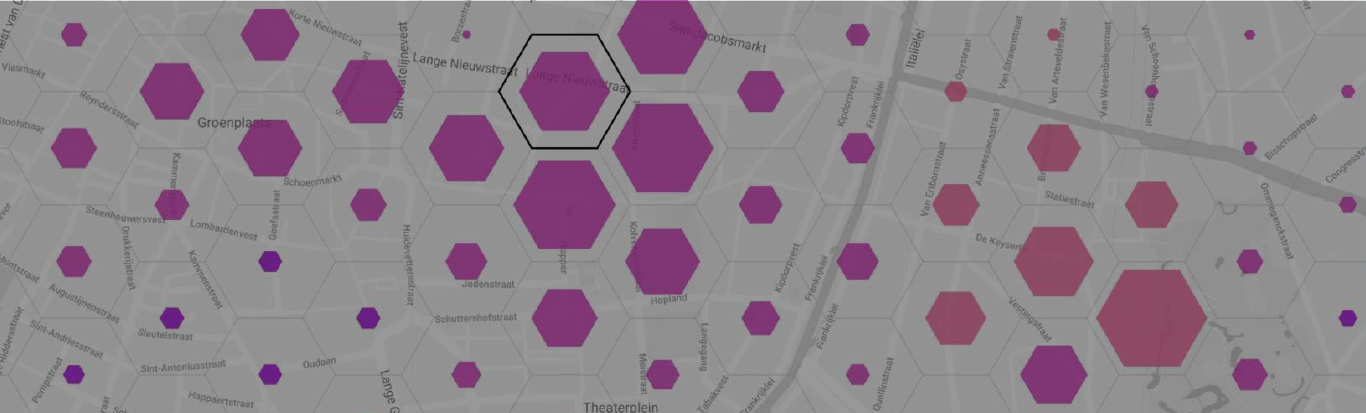
Working in close collaboration with the Proximus team, the Datylon projects team developed a truly unique portal that customers could register for and produce their own LIS reports in a simple and user-friendly way. We fully automated ordering as well as delivery of highly engaging, interactive and informative Origin-Destination, Footfall and Crowd-Management reports.

The delivered business value

Progressing from manually produced data science reports, to fully automated LIS reports available online to the end user in a matter of minutes; it is simple to see where the value lies. As well as opening up a new revenue stream for Proximus, with this efficient and scalable solution, the end user is also benefitting. Reports are delivered in a way that means a data novice right through to a data expert can comprehend insights quickly and easily.


Read more customer stories

How Datylon helps the city of Antwerp monitor its mobility services | Datylon Customer Stories - Stad Antwerpen
Project, Government

How Datylon helps the city of Antwerp monitor its mobility services

The city of Antwerp, in the Flemish region of Belgium, is a big urban and economic hub. With a...

Read more
A customized reporting solution for the wealth management sector
Design Agency, Financial Services

How L'Agence developed an outsourced customized reporting solution

L'AGENCE is a Swiss-based digital agency with a long-standing relationship with one of its main...

Read more

Subscribe to our newsletter

Receive inspiration, practical advice, customer stories and news right in your mailbox.

Newsletter
Company
  • About us
  • Projects
  • Jobs
  • Contact us
  • Data security
  • Datylon reviews
Product
  • Product overview
  • Chart library
  • Datylon for Illustrator
  • Datylon Server
  • Datylon Enterprise
  • Pricing
  • Release notes
  • Free trial
  • Charts in InDesign
Resources
  • Inspiration
  • Customer stories
  • Blog
  • FAQ
  • Help Center
  • Video tutorials
Create
  • Graph maker
  • Illustrator chart plugin
  • Pie chart maker
  • Bar graph maker
  • Line graph maker
  • Scatter plot maker
  • Bubble chart maker
  • Dot plot maker
  • Free chart maker
Learn
  • Getting started with Datylon for Illustrator
  • Getting started with Datylon web app
  • Mind your data visualization
  • 9 types of data visualization
  • The best charts for color blind viewers
  • 80 types of charts & graphs
  • A guide to effective data visualization
  • The best data visualization tools

    All rights reserved. © 2023 Datylon BV

    • Legal Terms
    • Privacy Policy

    Manage Cookies