Datylon
  • Solutions
    • Chart Design
    • Report Design
    • Automated Reporting
    • ESG Report Publishing
    • Embedded Reporting
    • Bespoke Dataviz Solutions
    • Datylon Foundry - Software Services
  • Products
    • Datylon for Illustrator
    • Datylon Report Studio
    • Datylon for PowerPoint
    • Datylon ChartRunner
    • Datylon Report Server
  • Pricing
  • Resources
    • Help Center
    • Inspiration
    • Chart Library
    • Blog
    • Customer Stories
    • FAQ
  • Contact us
Sign in
Explore free options
Big data media monitoring for NATO
Customer Stories> Project, Government

Big data media monitoring for NATO

SHARE

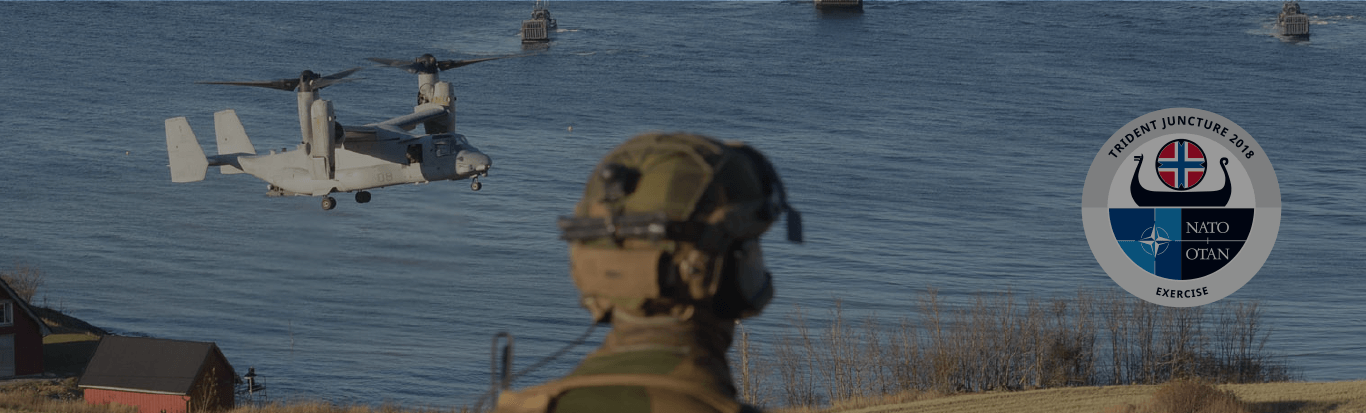
During their Trident Juncture 2018 exercise, NATO Generals wanted to monitor the coverage of media outlets around the world. They contacted the Datylon projects team to bring decentralised data together in an easily understood and distilled report. This ensured that everyone had the same story and that best actions to take could easily be collectively decided.

Understanding the challenge

During their recent Trident Juncture 2018 exercise, NATO wanted to regularly monitor the coverage of media outlets around the world. The goal was for the gathered information to be communicated to NATO generals (both in the field and at HQ) in order to understand and follow up appropriately on communication operations. But in providing regular (daily) updates, the volume of data produced by approximately 30,000 news sites was simply too vast to be able to gain valuable and actionable insights.

Designing & delivering the solution

In conjunction with our partner, Klarrio, we designed and produced a data story template based specifically on NATO’s needs. Hourly data feeds from the news sites worldwide were analysed, segmented and used to auto-create the daily data story while the Trident Juncture exercise occurred.

Big data media monitoring for NATO

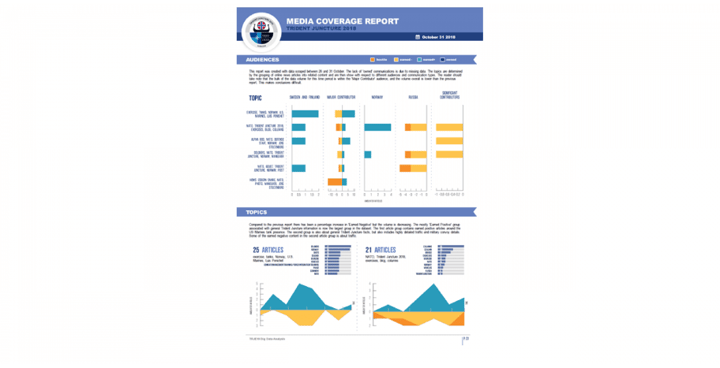
Custom segments included the number of articles produced within a 24 hour period, the category and country of origin of the news source, recurring theme groupings based on key words, and if there was an overall positive or negative sentiment to the article. This meant the report provided the exact information that was required to be communicated to the NATO team.

The delivered business value

By laying the data out into an easily understood and distilled report, all members could access the detail as and when they needed to – no matter their level of data literacy. By bringing decentralised data together, a full picture is provided, so everyone has the same story and the best actions to take can be collectively decided.

As the data story input and structure is pre-defined, information that is valuable for the specific task can be shared in a consistent and timely manner, even to those in remote locations. A communication method such as this is also cost effective, with little to no maintenance required following set up – if you listen carefully you can hear a collective sigh of relief from departments such as IT!


If you're also looking to automate your reporting process, the Datylon Report Server can help. Book a demo to discover how it works.


Read more customer stories

Combined power of dataviz & print for the Commercial Association of Porto
Product, Government

Discover the combined power of dataviz & print by using Datylon

Two of our earliest Datylon Graph beta users, editorial designer Ana Resende and graphic...

Read more
Human Capital Media designs charts 4 times faster
Media/Publishing, Product, Report Design

Human Capital Media designs charts 4 times faster with Datylon

Human Capital Media, an award winning US Publishing company, uses the Datylon for Illustrator...

Read more

Subscribe to our newsletter

Receive inspiration, practical advice, customer stories and news right in your mailbox.

Newsletter
Company
  • About us
  • Jobs
  • Contact us
  • Data security
  • Datylon reviews
Solutions
  • Embedded Reporting
  • Automated Reporting
  • Chart Design
  • Report Design
  • ESG Reporting
  • Bespoke Solutions
  • Software Services
Product
  • Datylon Report Studio
  • Datylon Report Server
  • Datylon for Illustrator
  • Datylon ChartRunner
  • Datylon for PowerPoint
  • Datylon Enterprise
  • Pricing
  • Free trial
  • Release notes
Resources
  • Chart library
  • Inspiration
  • Blog
  • Customer stories
  • FAQ
  • Help center
  • Video tutorials
Create
  • Area chart
  • Bar chart
  • Bubble chart
  • Bullet chart
  • Density plot
  • Dot plot
  • Heatmap
  • Histogram
  • Icon array
  • Icon chart
  • Line chart
  • Pie chart
  • Range plot
  • Scatter plot
  • Stream graph
  • Treemap
Learn
  • Tips for report design
  • Do you speak data?
  • Do you speak dataviz?
  • Effective dataviz guide
  • 80 types of charts
  • 9 types of dataviz
  • Best dataviz tools
  • Charts for colorblind
  • Accessible charts
  • Break the rules
  • Dataviz in Illustrator
  • Datylon vs. Illustrator
  • Static or interactive?
  • Outside the box charts
  • Mind your dataviz
  • Data storytelling

All rights reserved. © 2025 Datylon BV

  • Legal Terms
  • Privacy Policy

Manage Cookies