The Province of Antwerp, a regional government in Belgium, sought a partner to produce reports for a project examining the current and future housing landscape within the province. With the need to generate multiple distinct report versions, each containing unique data for every municipality, the Province of Antwerp was looking for a provider of tools and services for creating customized charts and reports.
Introduction
The Province of Antwerp is actively engaged in providing both visible and behind-the-scenes services to its residents. These services are delivered directly by the province but are primarily facilitated through local municipalities, and cities, as well as associations and umbrella organizations that advocate for the interests of the people living in the province.
One of the topics the Province of Antwerp focuses on is the housing landscape in the province. In today's world, where housing is a fundamental need, the Province of Antwerp wants to gain a comprehensive understanding of their housing landscape.
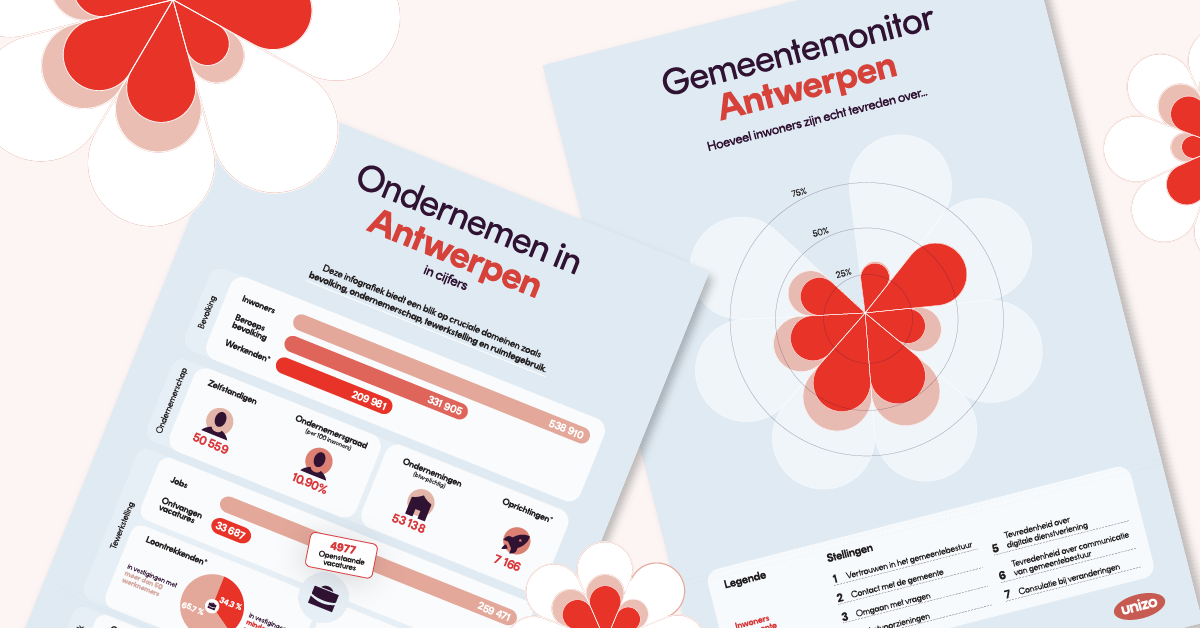
Hence, they initiated the "Woonscans" project with the aim of delivering vital perspectives on affordability, quality, accessibility, and sustainability. These insights lay the groundwork for well-informed policy choices, foster collaboration, and contribute to the development of a robust, sustainable housing market, ultimately ensuring fairness and accessibility in the living environment for all the province's residents. Furthermore, the Woonscan report offers the Province of Antwerp an opportunity to showcase its services to the municipalities.
Challenge
What distinguishes the Woonscan reports from typical reports is its need for multiple versions. With each report spanning at least 115 pages, a total of 69 unique versions must be generated, one for each municipality, amounting to a total of 7935 report pages. This is to enable informed decision-making tailored to the specific needs of each locality.
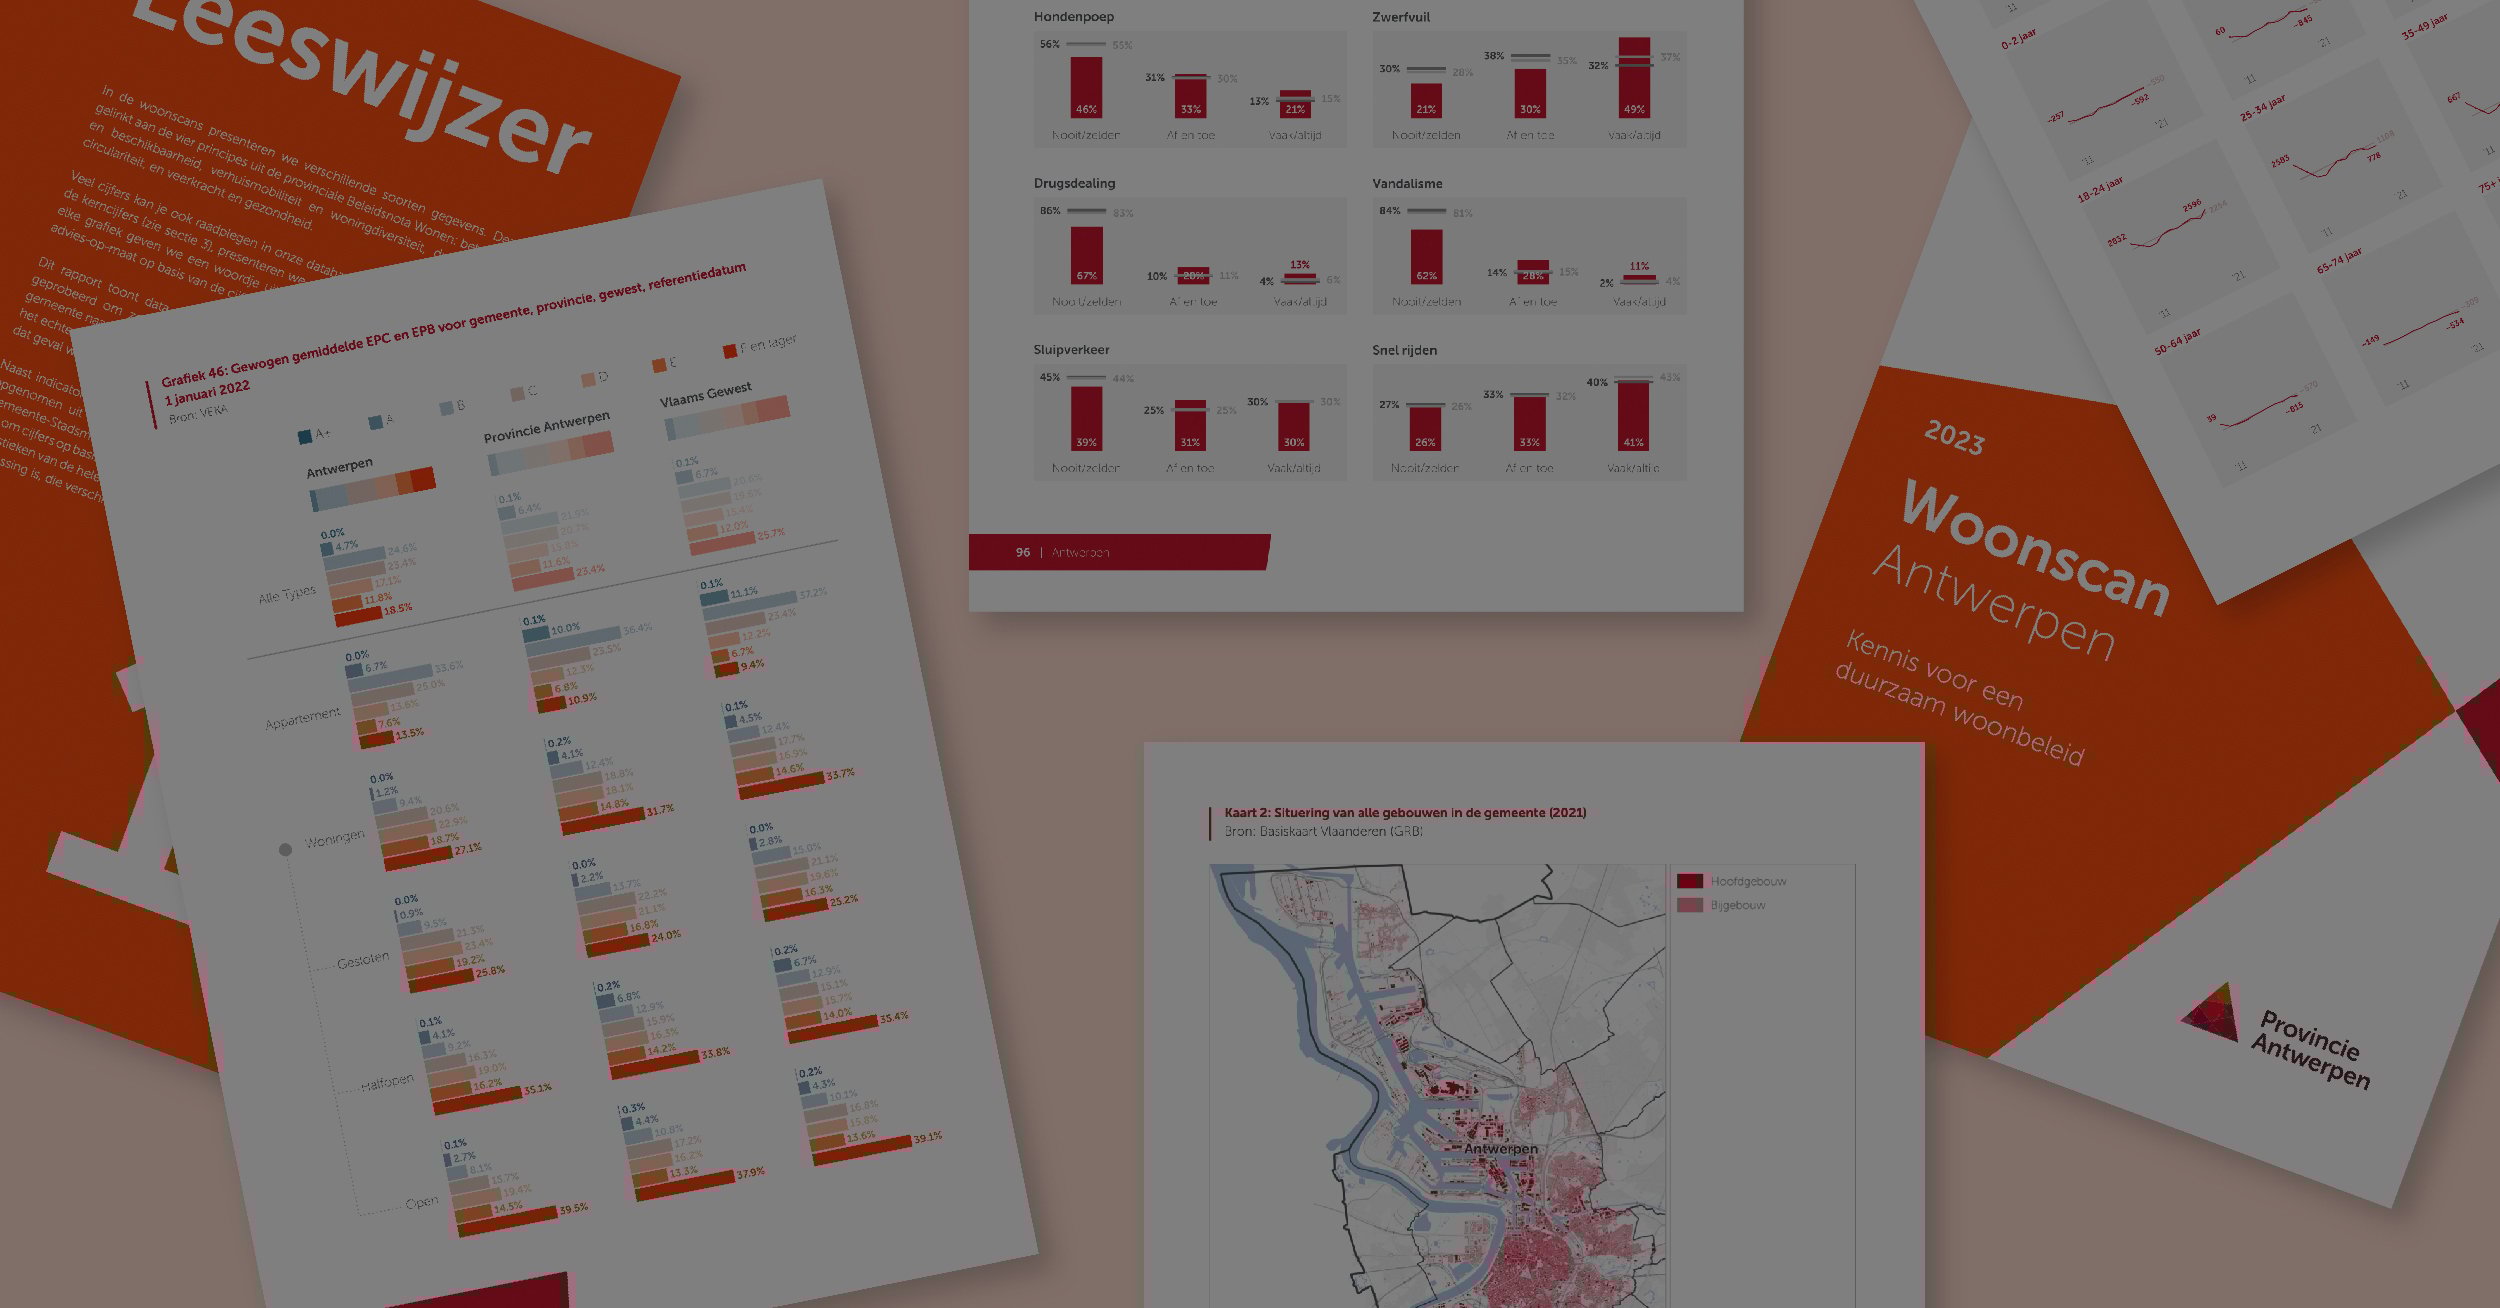
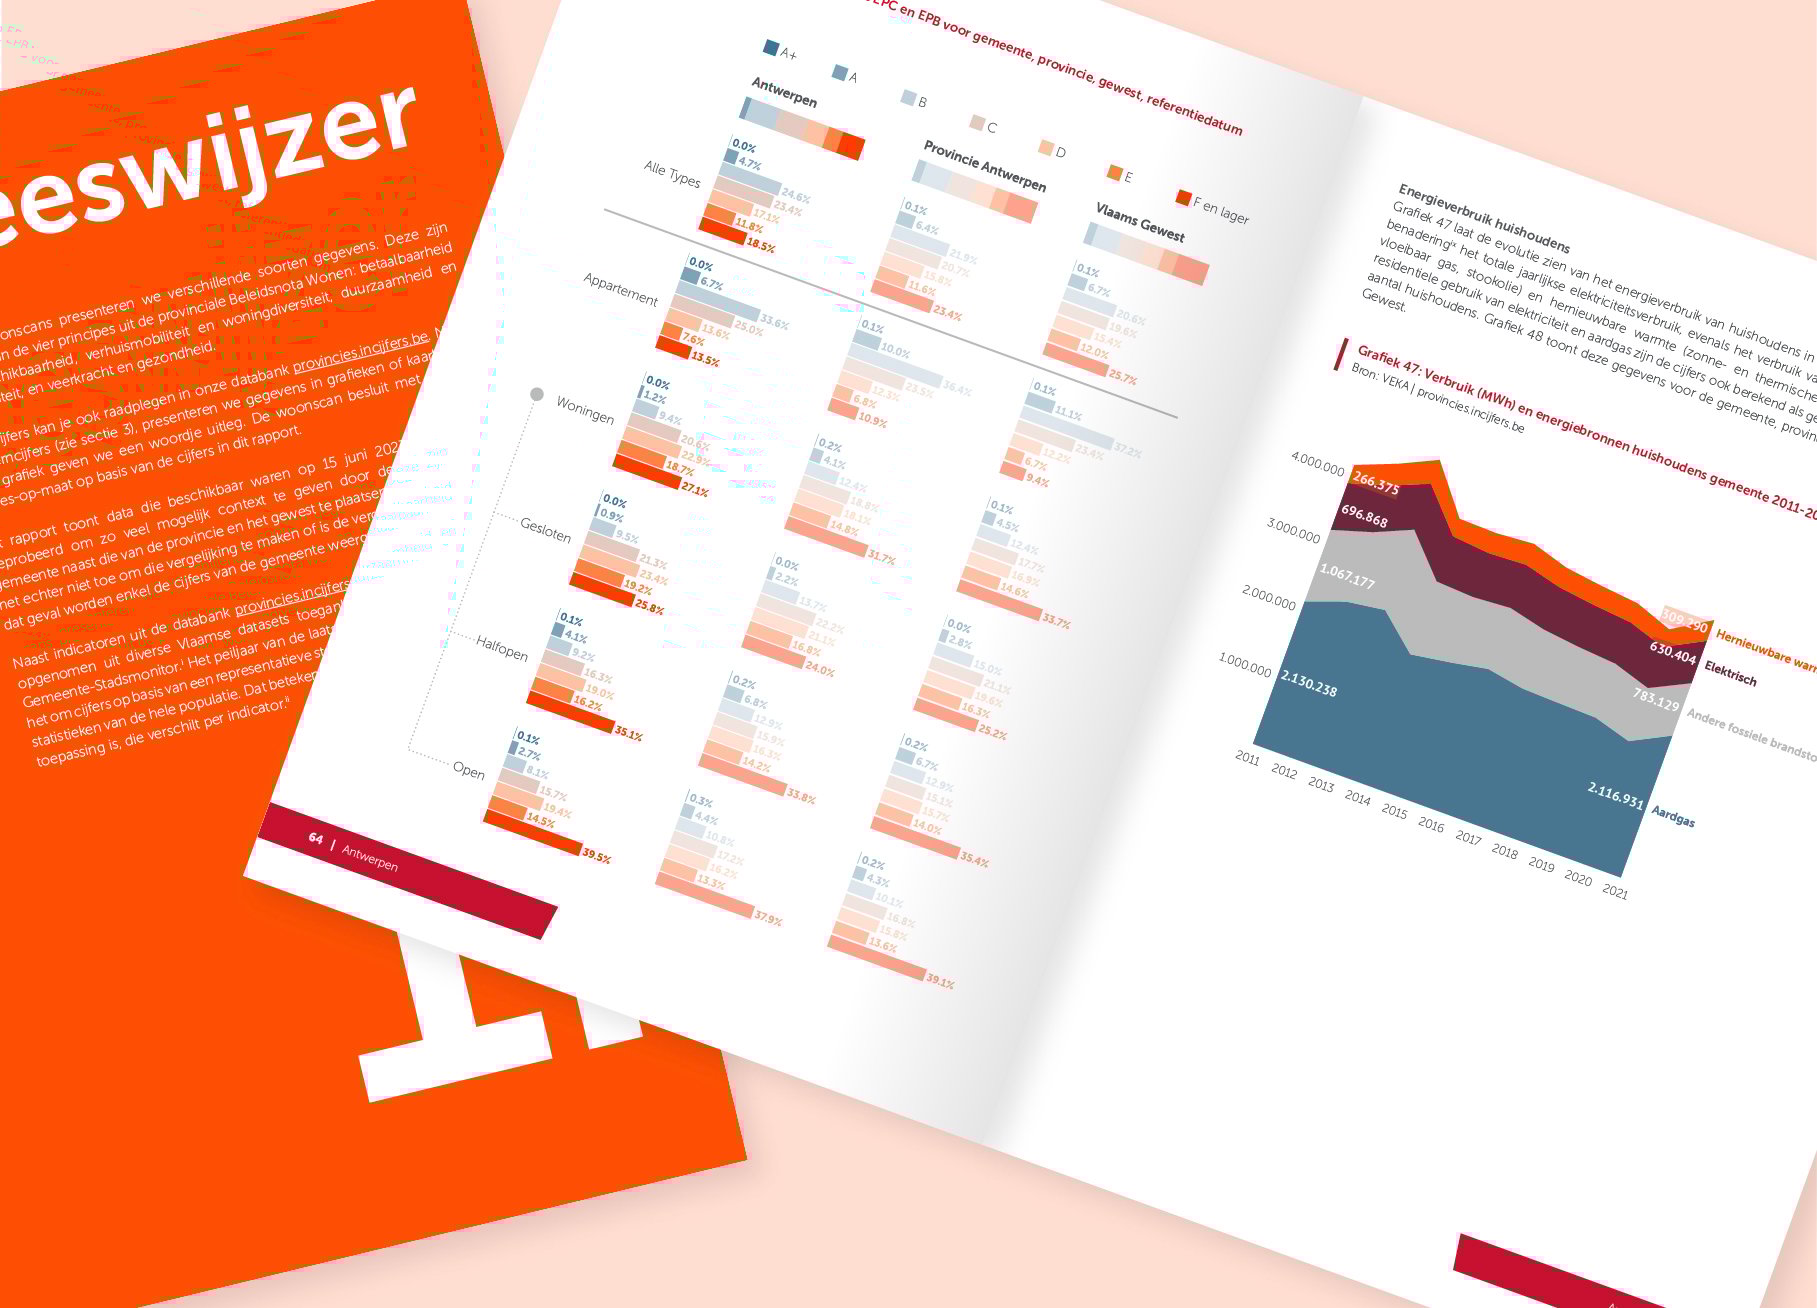
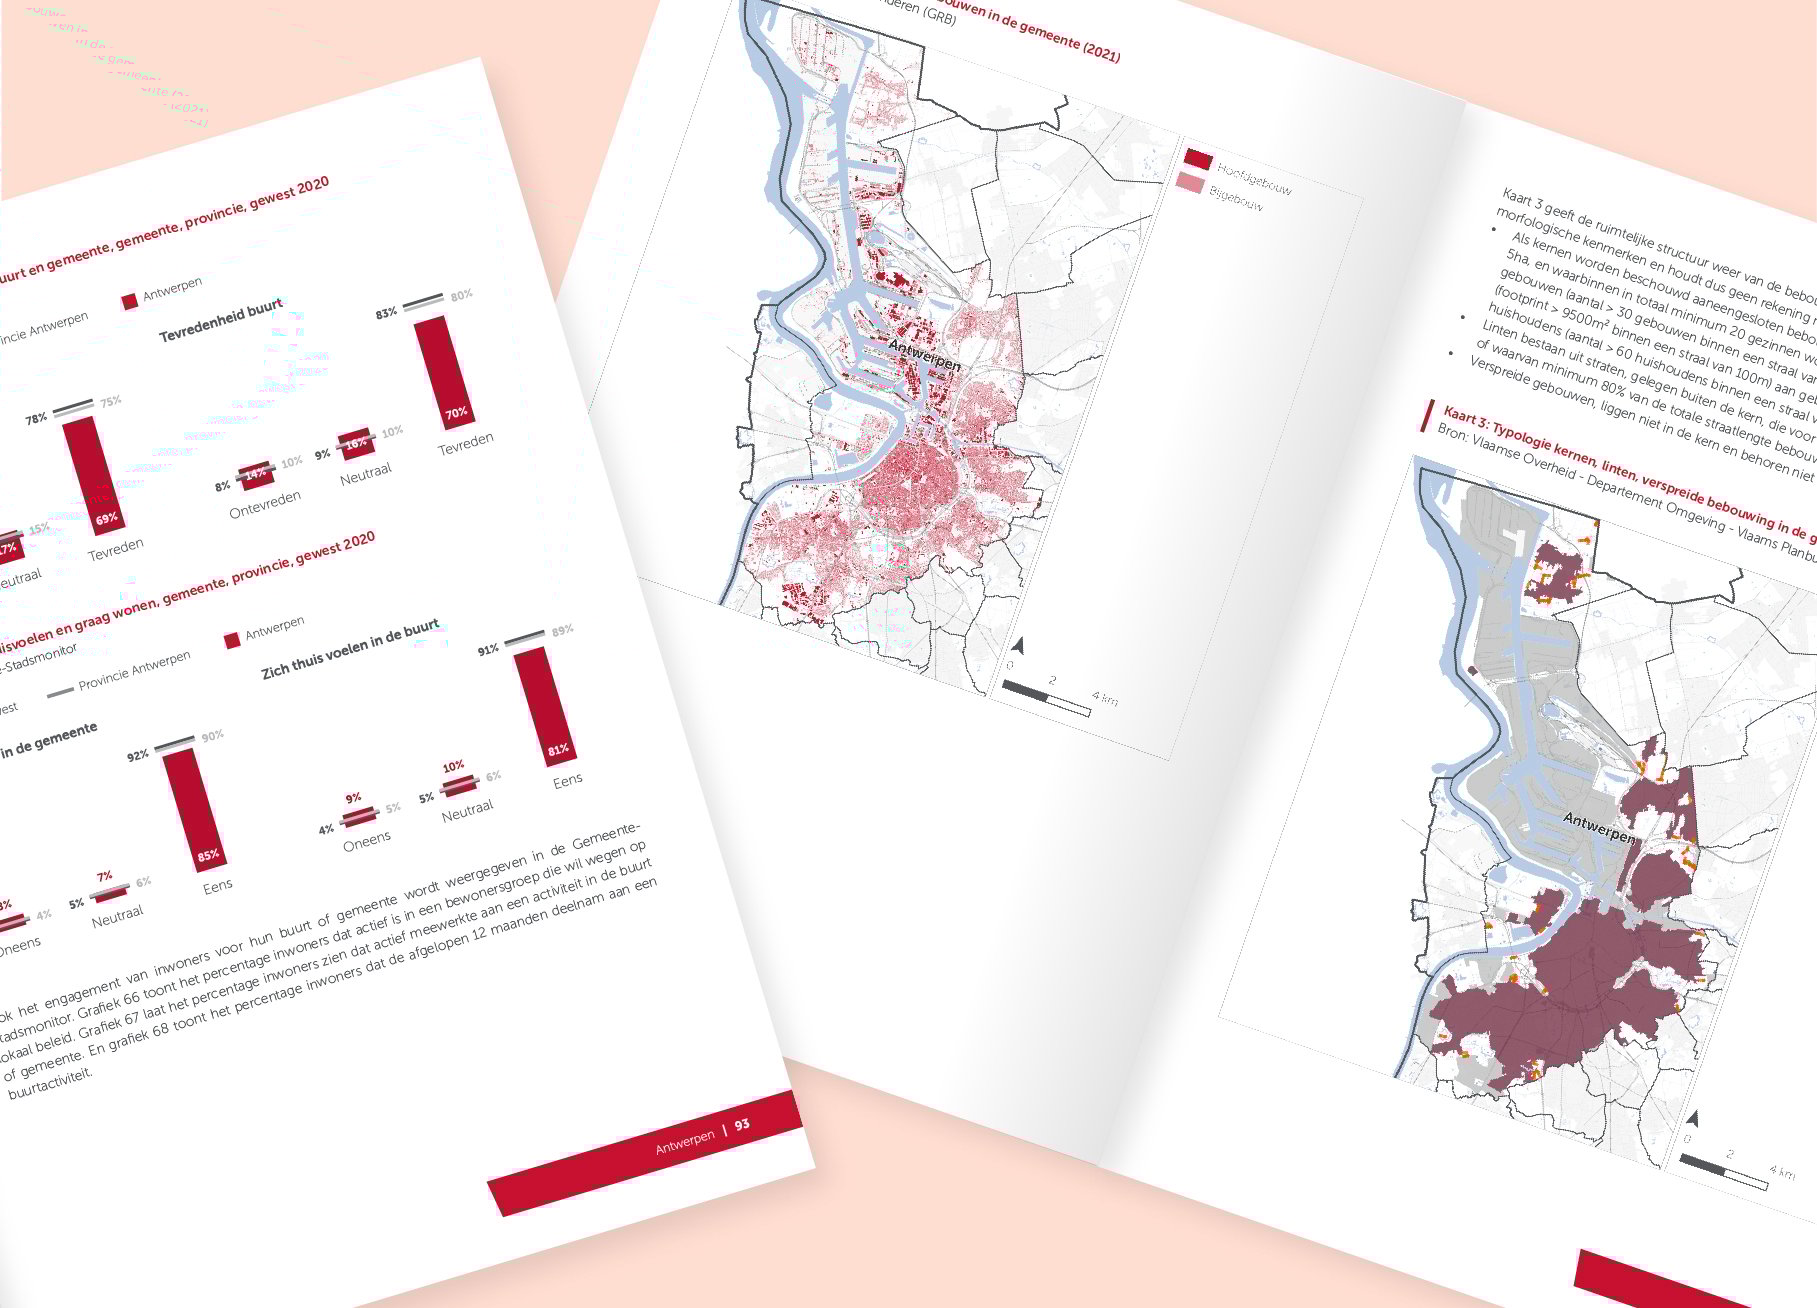
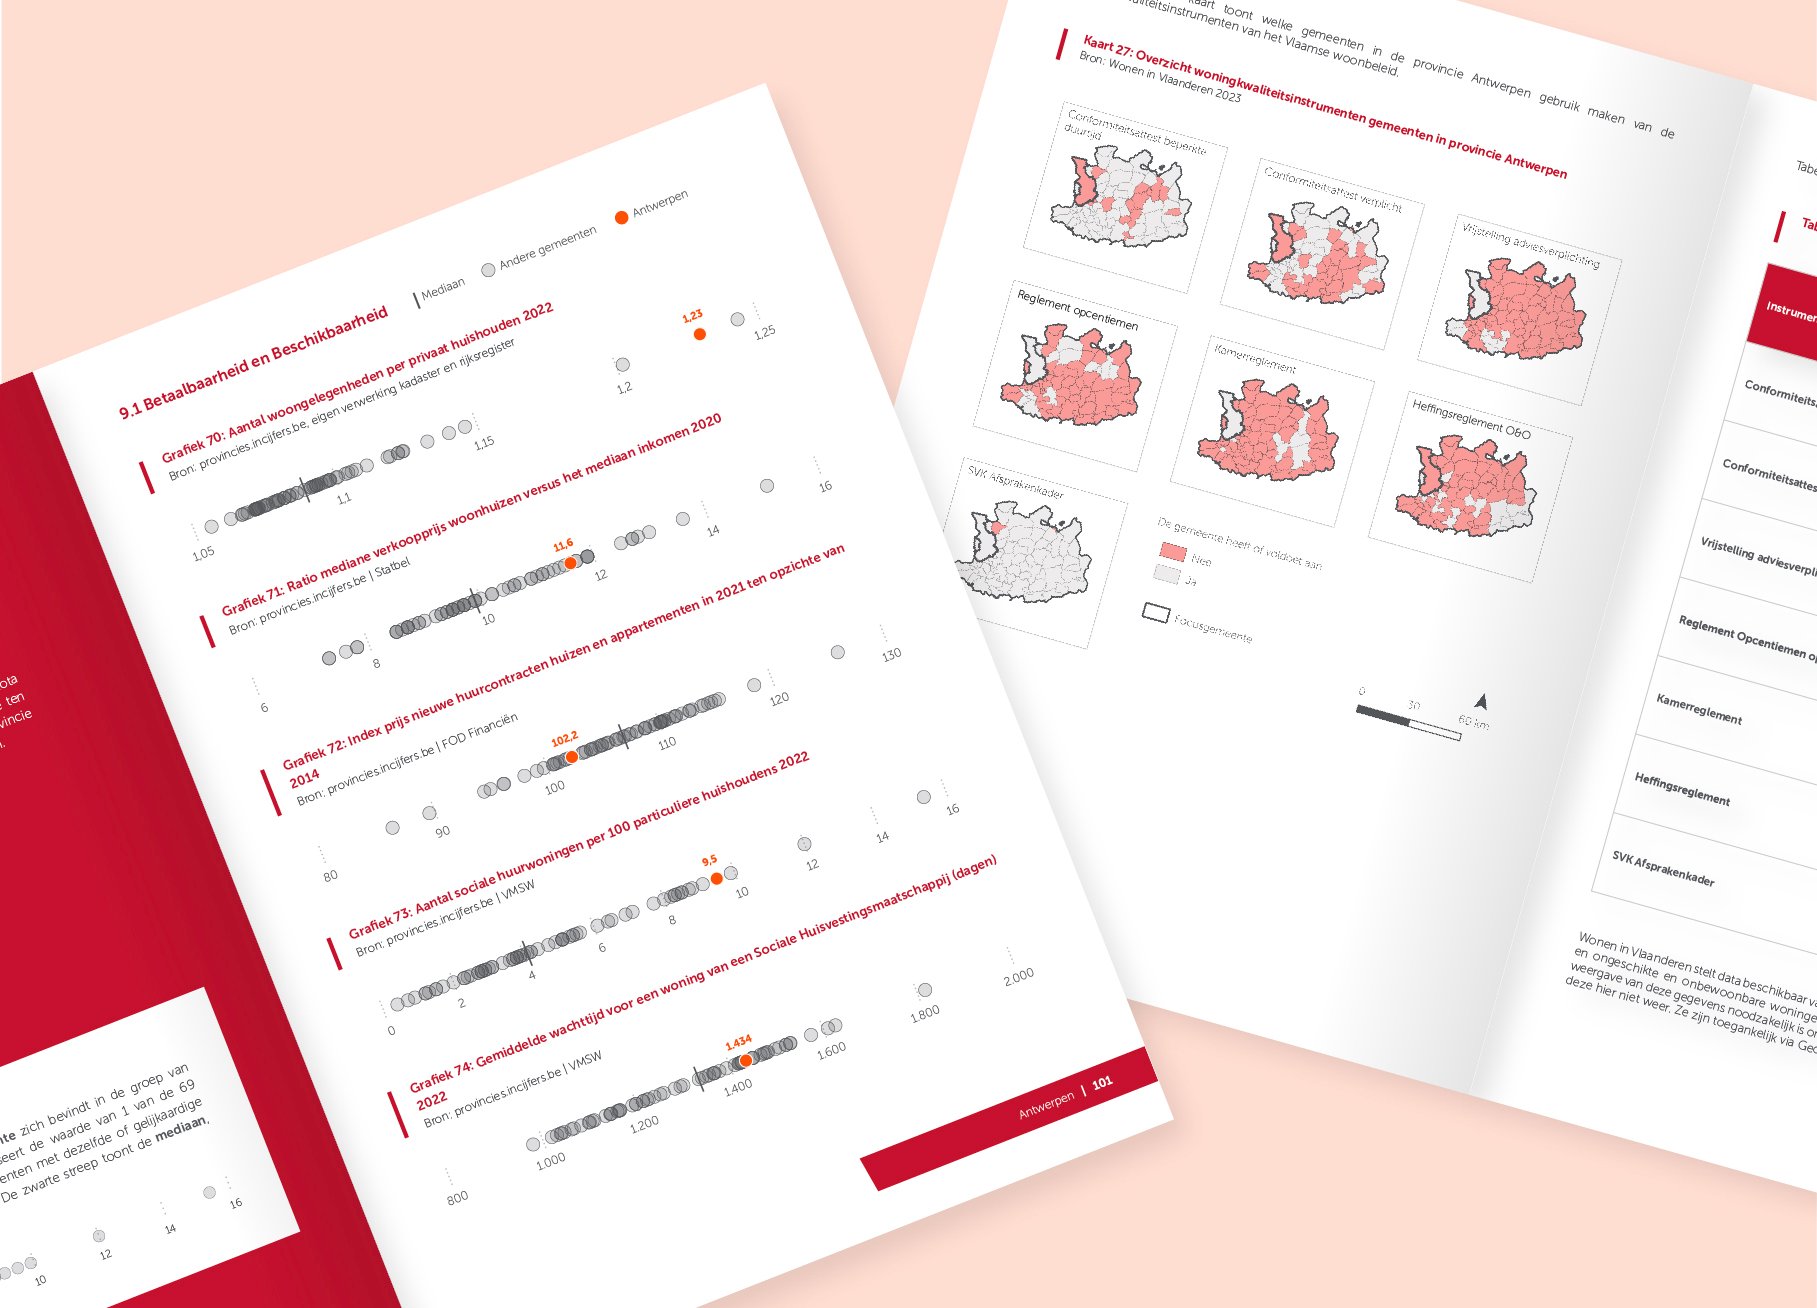
The generation of these versions involved the task of creating 89 charts per report, resulting in a total of 6141 charts (69 x 89 charts). Additionally, 27 maps were needed, totaling 1863 maps (69 x 27 maps), along with 7 tables, summing up to 483 tables (69 x 7 tables). The creation process involved utilizing 15 different types of charts and 7 different types of maps.
The magnitude of this undertaking becomes apparent when considering the time investment required for manual execution—estimated at 400 man-days. Given the report's substantial size and the inclusion of numerous data visualizations, engaging an external party with strong data visualization capabilities and tools became a practical choice. Creating it internally would entail significant time and cost, especially considering the project's tight deadline of just a couple of months.
Moreover this project involved creating captivating charts and maps in a consistent style for all 69 report versions. Achieving uniform visual appeal across this extensive set of reports demands meticulous design considerations, encompassing color schemes, fonts, and graphical elements to effectively convey information while maintaining a cohesive visual identity.
Another challenge in the Woonscan project lies in data management, including thorough data preparation and accurate updates. Precise handling is vital to prevent discrepancies among the 69 report versions, ensuring they consistently reflect the specific data needs of each municipality. This precision is essential for supporting informed decision-making throughout the province.
Solution
The Province of Antwerp collaborated with Datylon on this project which required the creation of extensive reports, each carefully tailored to present the unique data of individual municipalities. Unlike the labor-intensive process of manual report creation, where data and styling are input by hand, Datylon's Automated Reporting Solution provides an efficient and cost-effective alternative. By automating the reporting process, Datylon streamlined the production of the versioned stand-alone reports, eliminating the need to start from scratch with each report. Given the pressing need to produce the reports within a tight timeframe of just a couple of months, this was a real game-changer for the Province of Antwerp.
Utilizing Datylon Automated Reporting Solution led to two efficiency improvements. First, a reduction in the design phase was achieved by reusing charts throughout the different versions of the report. Additionally, automating the linking to the datasets resulted in a reduction of man-hours. Collectively, these enhancements led to a significant decrease in the time required for report generation, achieving at least a fivefold increase in production speed.
Moreover, being specialists in data visualization, Datylon provided an extensive range of data visualization capabilities that proved highly valuable for this project. Moreover, a notable feature of the Datylon Reporting Solution was the incorporation of tailor-made charts designed to align seamlessly with the customer company's style guide and specific charting needs. This ensured that the reports had a consistent and engaging visual identity throughout all versions.
Given the extensive nature of the project, effective data management was a challenge, and there was a notable risk of errors in the process. Datylon's Automated Reporting Solution was an ideal solution to address this issue. The implementation of automation by Datylon substantially mitigated the risk of data inconsistencies, ensuring uniformity across all 69 report versions.
Furthermore, the project involved multiple iterations, and the flexibility of the automated reports made it seamless to incorporate changes. This encompassed modifications to the data and adjustments to chart design. As all charts were replicated across all 69 versions, design adjustments only needed to be made to the template chart, simplifying the process and minimizing the risk of errors.
Conclusion
The Datylon Automated Reporting Solution has provided the municipalities within the Province of Antwerp with a newfound understanding of their data, potentially paving the way for more informed decision-making in the future of the housing landscape. This project stands as a testament to the transformative potential of automated reporting for organizations.
If your organization is seeking to redefine its data presentation and integrate clear and captivating reporting into its operations, Datylon extends an invitation to reach out for a customized proposal or schedule a demonstration. Witness the transformative impact that state-of-the-art data visualization and reporting capabilities can have on your organization, empowering you to effortlessly make data-driven decisions.
To access the Woonscans for download, visit the following link: https://www.provincieantwerpen.be/lokale-besturen/welvarende-gemeenten/advies/woonscan/woonscans-per-gemeente.html
Interested in automating your own versioned reports? Discover how the Datylon Report Server can help you scale complex reporting projects with ease and consistency. Book a demo with one of our experts to learn more.