Datylon joins AI research project TRACY as data visualization partner
Artificial Intelligence usage is growing exponentially across many domains. The rise of AI is forecasted to continuously transform the world and shape the future of technology. Although some people still react strongly to the term, we all live and interact with artificial intelligence on a daily basis. The unseen algorithms respond to our voice commands, correct our grammar, oversee our human-like conversations with chatbots, and even heat up our living rooms before we get back home. These smart, AI-based algorithms are designed to make decisions, often using real-time data, combined with sensors or remote inputs. By augmenting human efforts, AI aims to significantly improve our life.
So far, the European AI landscape still lags behind China and the U.S. Nevertheless, Europe is willing to and able to catch up with the rest. European leaders have recognized the importance of machine learning and AI, putting it higher on the priority list for the upcoming years. This creates a lot of exciting opportunities for European entrepreneurs who want to have a say in how the future of technology in the EU is being shaped.
![]()
Originating from the Belgian startup environment, Datylon has recently gotten involved in an exceptionally interesting program. At the end of 2020, Flemish Agency for Innovation & Entrepreneurship (VLAIO) decided to bring scientists and industry partners together on a specific AI-related topic. As part of so-called ICON projects (dutch abbreviation for Interdisciplinary Cooperative Research), the TRACY initiative (Trace Analytics) is a project with the aim to apply AI and machine learning to optimally use all data generated by industrial machinery.
McKinsey Global Institute has already researched and assessed (based on 400+ use cases) both the practical applications and the economic potential of advanced AI techniques across industries and business functions. This has drawn quite a substantial potential to create between $3.5 trillion and $5.8 trillion in value annually (among 19 industries). The analysis conducted by McKinsey Global Institute is then very relevant and encouraging to the TRACY project.
![]()
There are two types of data generated by industrial machinery: sensor data and data logs. The latter typically contains information like text, metrics, and status codes. The challenge lies in analyzing these complex log records. They are quite difficult to read and interpret as they vary between machines and manufacturers.
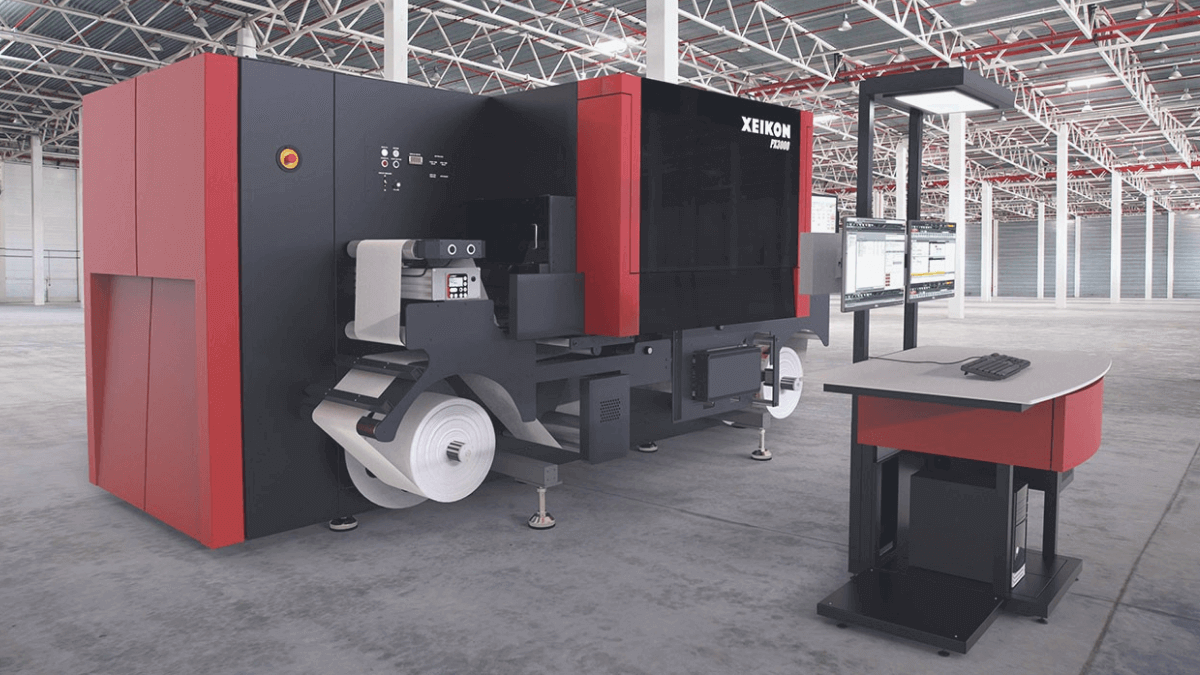
That’s why Datylon joined a few other companies in this AI-based research. The aim is to ensure better interpretation of underused log data of industrial air compressors and industrial printing machines. This can help in predicting the maintenance needs and optimizing processes, which in turn will significantly reduce the service costs of those machines.
Project partners are Xeikon, CMC, i-Care, Yazzoom and Sirris. Xeikon is a digital print solutions company. CMC is a global leader in compressed air control, performance and monitoring solutions. Yazzoom leverages its expertise in advanced data analytics, while i-Care is a predictive maintenance, reliability, and process optimization expert. Sirris, a non-profit organization, helps other companies drive their technological innovativeness. Datylon will support the project with advanced data visualization & digital competence to improve better understanding of data.
With a dataviz expertise endorsement from VLAIO, Datylon is ready to continue pushing the edge with all kinds of data visualization challenges. We believe that the more and the better people understand data the more there is an opportunity that data becomes a force that drives change. With our advanced dataviz & digital expertise, we can also put your data to work to maximize your opportunity for data-driven change. Check out some of our projects to see how we can make your data actionable.
Ready to share your data challenge? Contact us about your custom digital & dataviz needs.

