Unizo is the largest Flemish employers’ organization in Belgium, representing over 80,000 small and medium-sized enterprises (SMEs) and self-employed professionals.
As a key advocate for the business community, Unizo provides its members with a wide range of services, including expert advice, professional training, and representation on important policy matters affecting the entrepreneurial ecosystem.
Introduction
Unizo set out to position itself as a strategic partner for municipalities across Flanders, helping them develop medium- to long-term strategies that encourage a business-friendly environment.
In preparation for the upcoming municipal elections in Belgium, Unizo developed a highly targeted approach: creating a customized, data-driven report for each of the 312 municipalities in Flanders, detailing the current state of local business metrics and population satisfaction survey results.
These reports enabled Unizo to initiate meaningful conversations with municipalities, presenting insights tailored to the unique demographic and economic landscape of each community.

How it was done
Unizo conducted in-depth data analysis using publicly available information from various government agencies in Flanders, generating insights into professional and socio-demographic statistics. The organization aimed to share these insights with municipalities in a clear and impactful way.
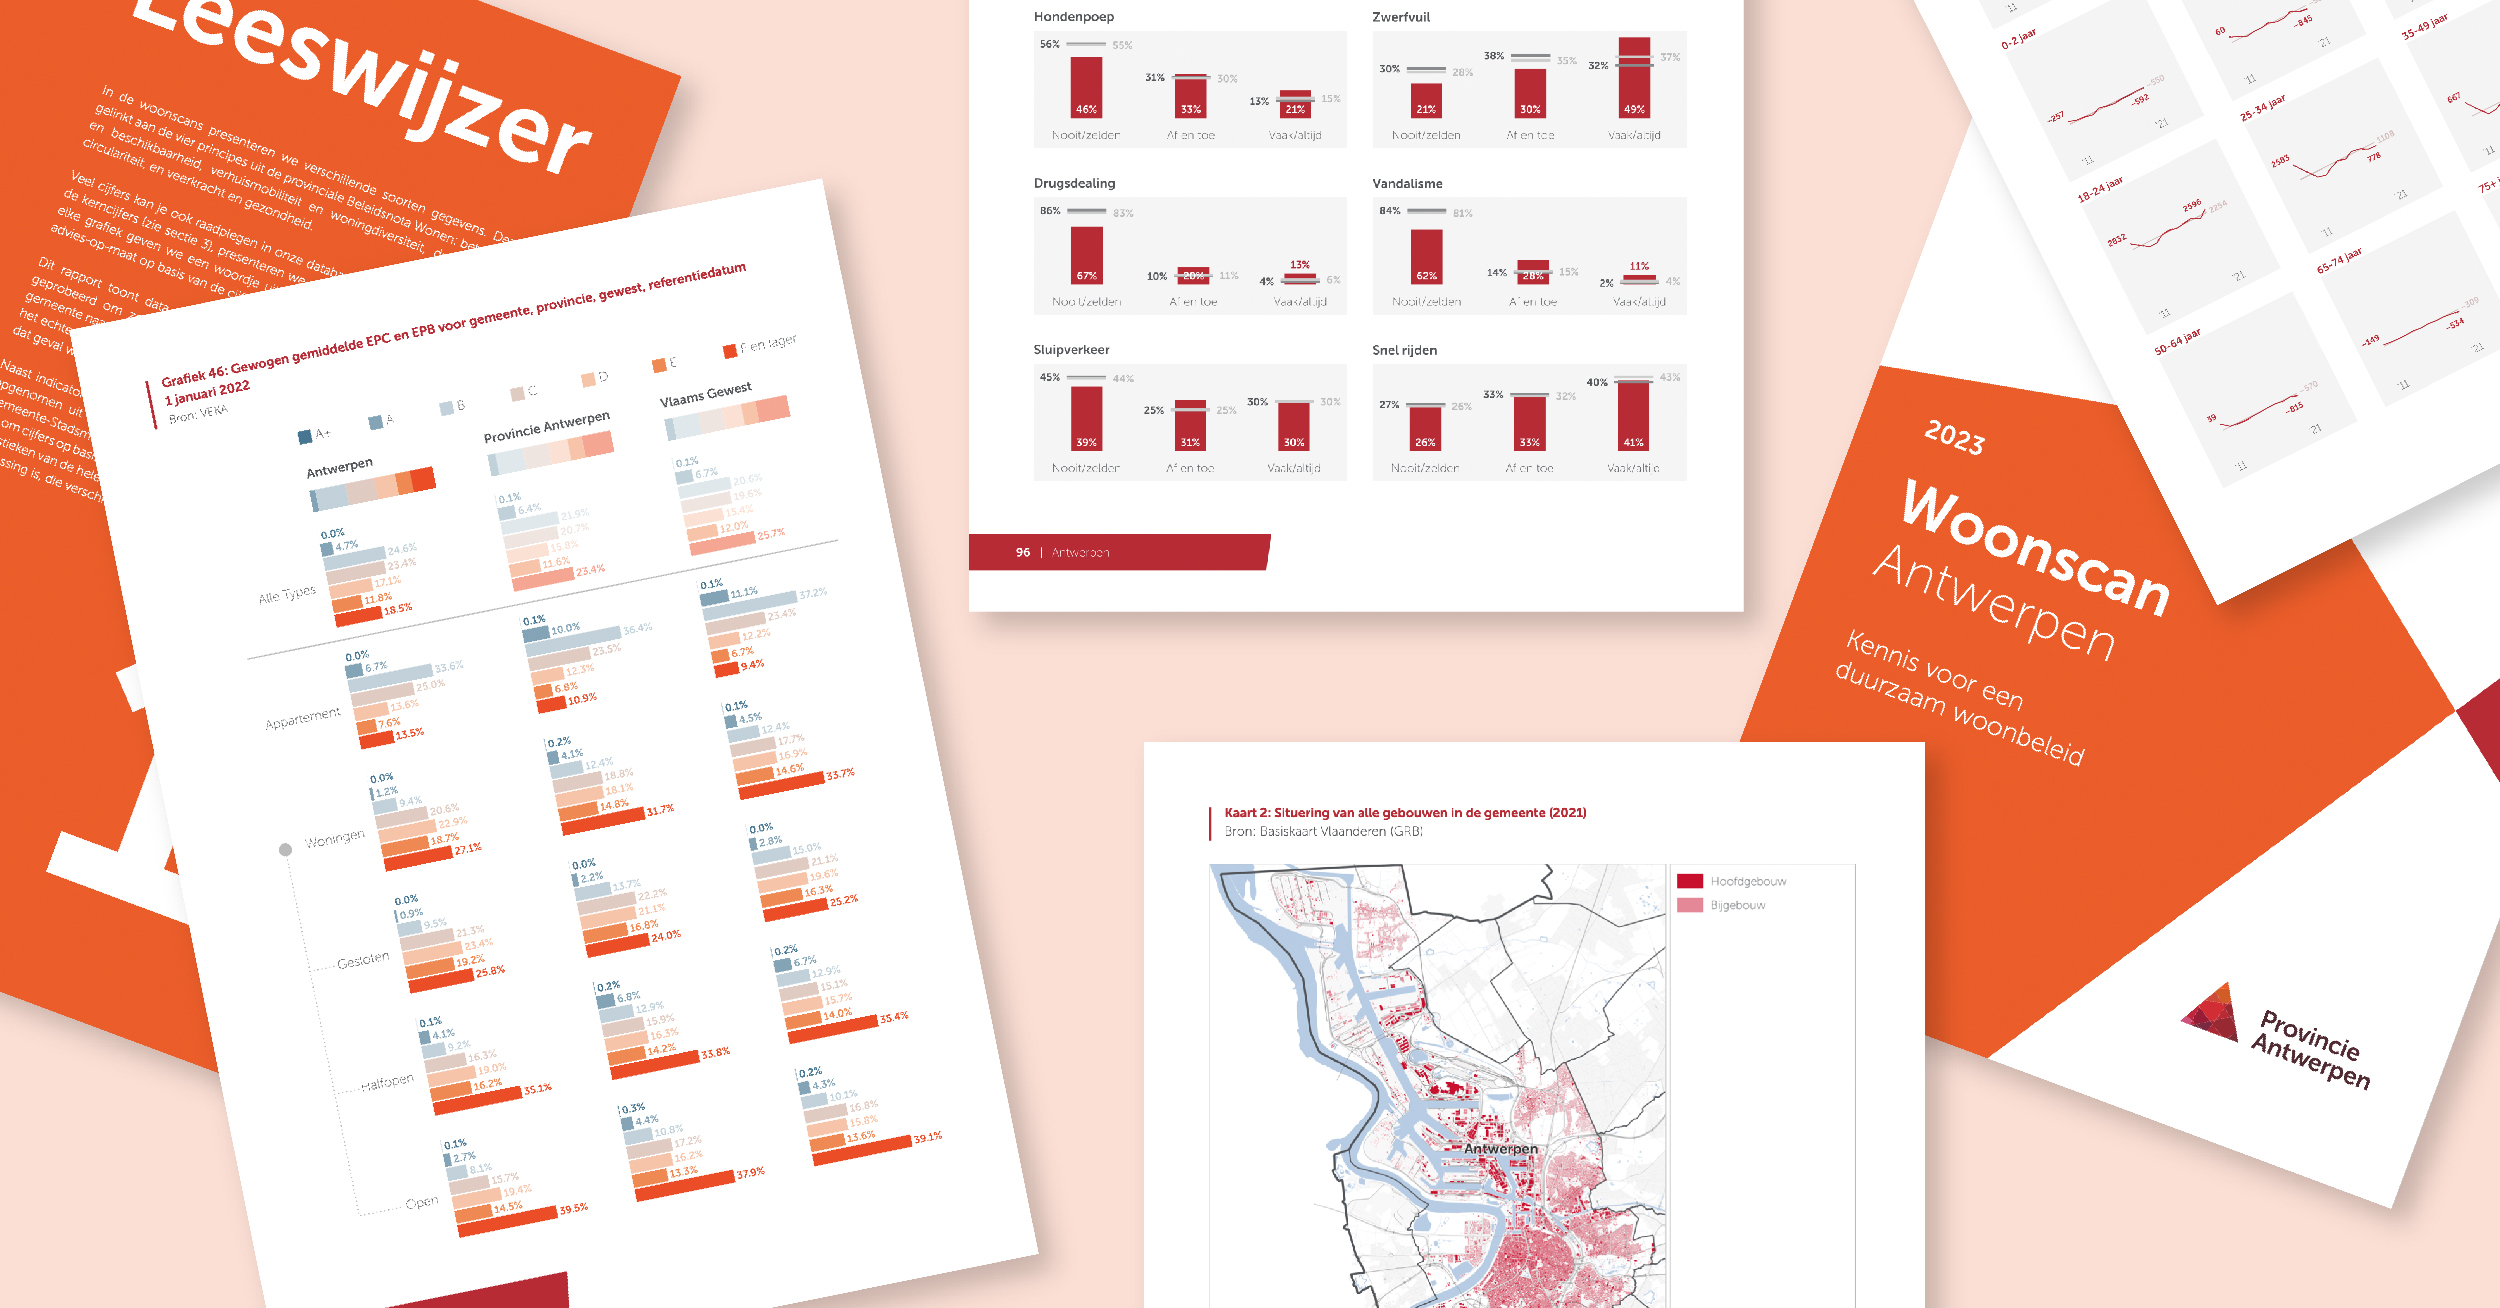
To produce the 312 individualized reports, Unizo’s visual & information designer, Gitte Vande Graveele, found an ideal solution in Datylon. Utilizing Datylon for Illustrator, Gitte created a two-page template that served as the backbone for all the reports.
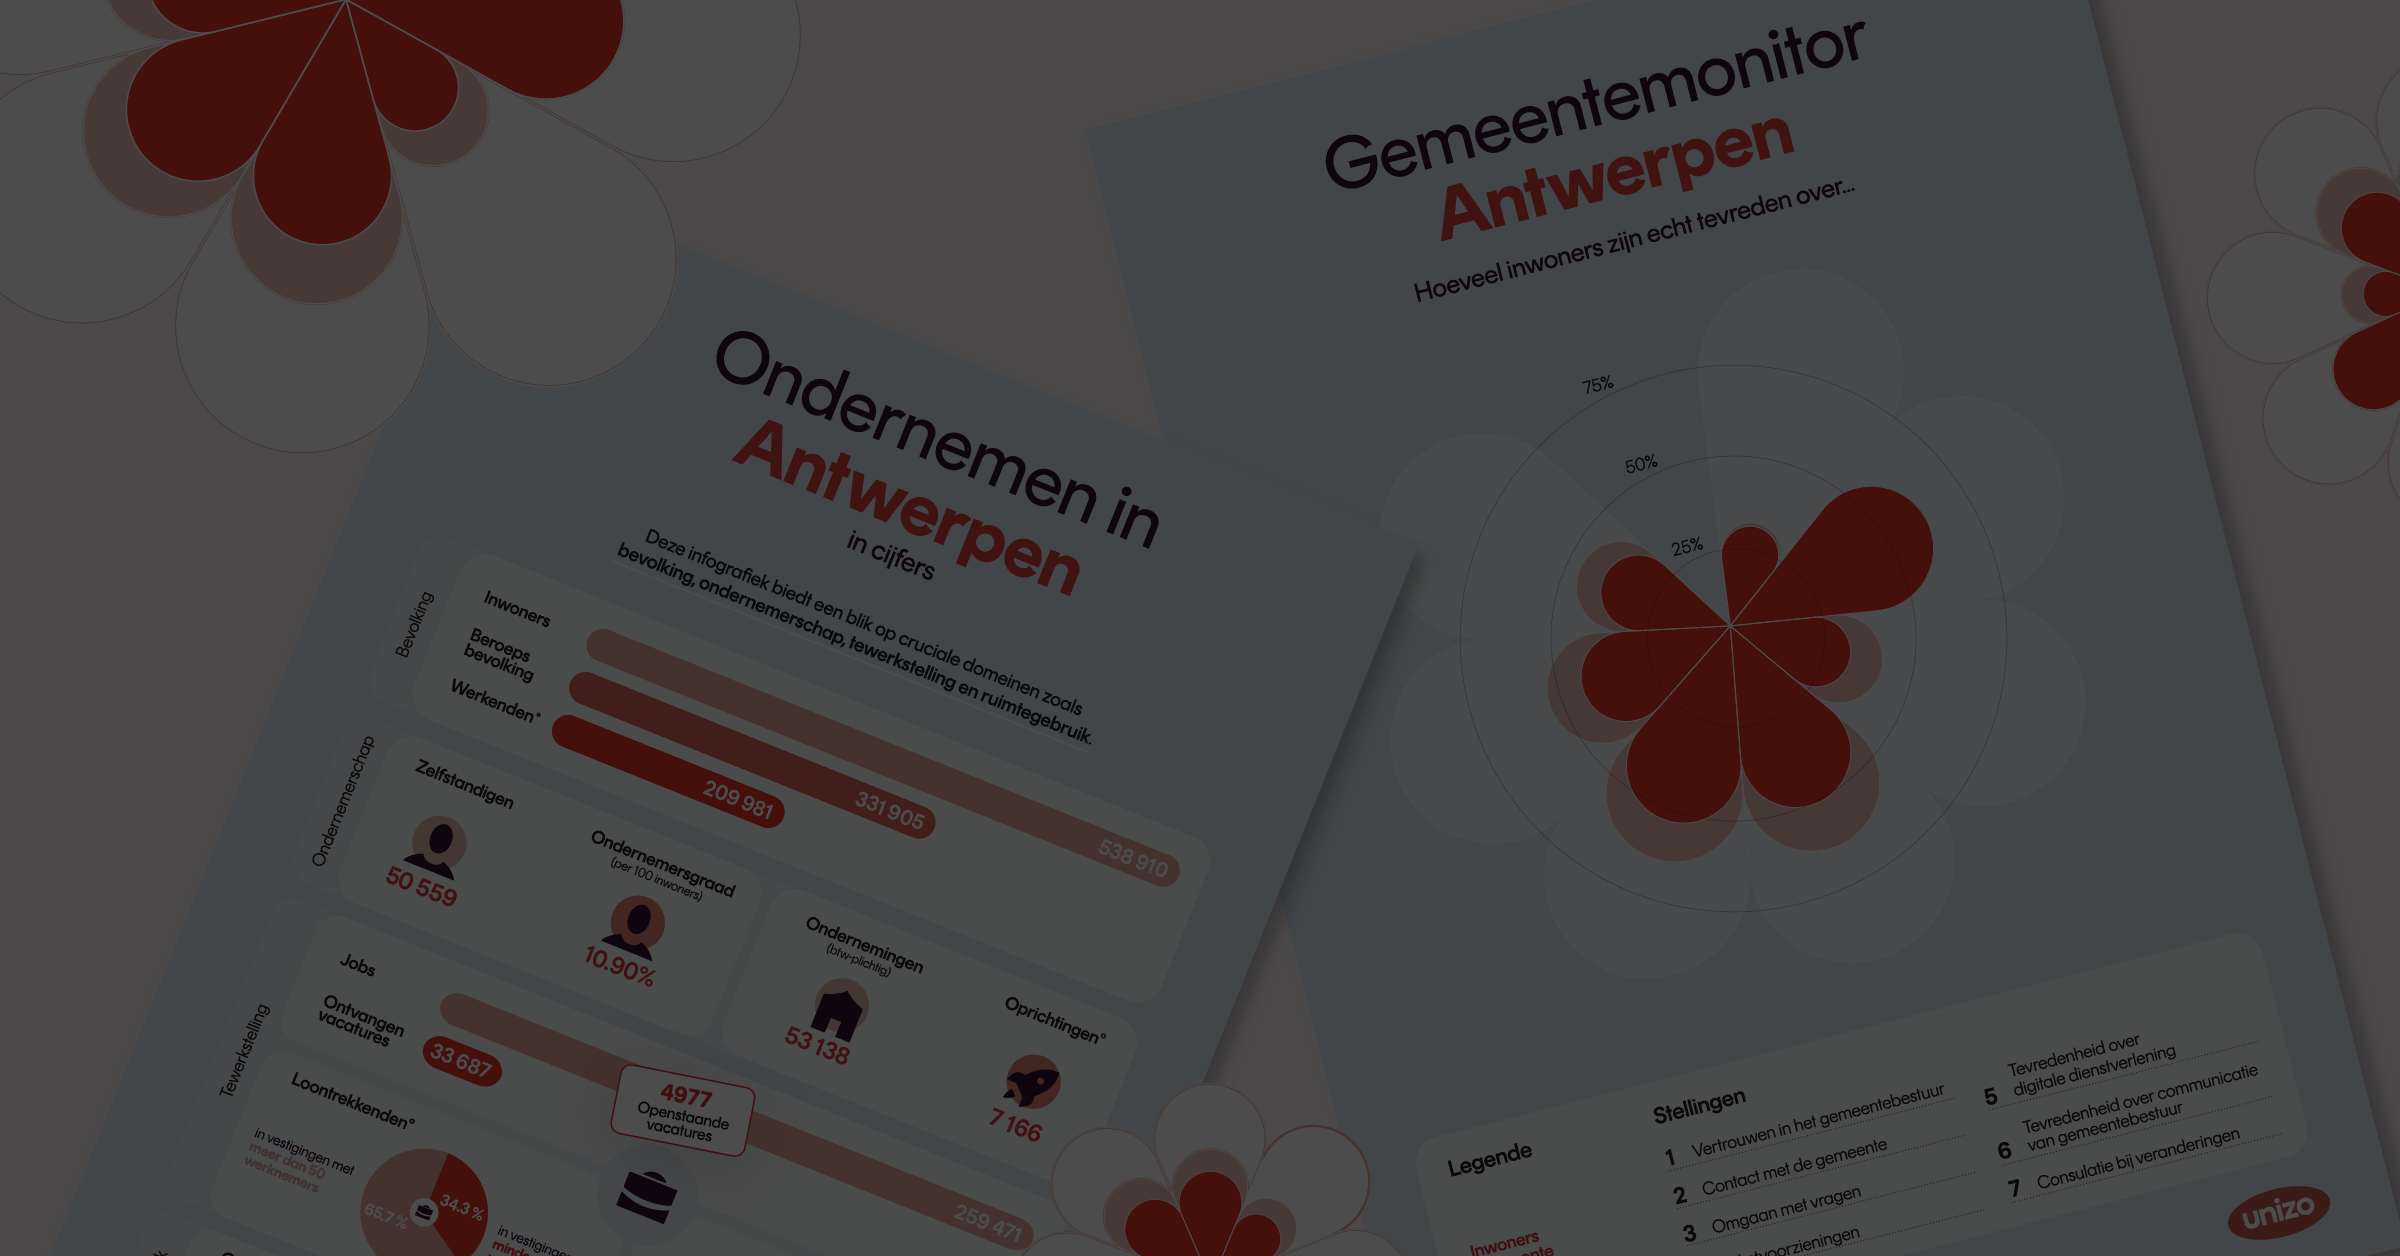
Each report was structured around two primary sections: the Entrepreneurship Dashboard, which showcased key professional demographics, and the Municipality Monitor, which summarized the results of the population satisfaction survey.

Reflecting on her experience, Gitte said, “After the initial learning curve, working with Datylon for Illustrator became quite intuitive. What really impressed me was the range of available chart types and the creative freedom to fully customize the layout and visual style of the charts. It allowed me to stay completely on-brand while delivering professional-quality data visualizations.”
Once the design was finalized and approved, the reports were exported into Datylon Report Studio, where the production process was automated for all 312 municipalities. Without the need for coding, the templates were used to rapidly generate the customized reports. This automation made the production process highly efficient, especially considering the scale of the project.
Streamlined Execution with Datylon
Given the tight project timeline, Unizo turned to Datylon for additional support with data preparation and report generation. Datylon’s team managed the data processing and executed the batch production on their Datylon Report Server, delivering all 312 reports in just one day. Reflecting on the speed and efficiency of this process, Gitte noted, “No other tool could have handled this task so quickly. It saved me countless hours of manual work.”
Following the first run, it became evident that the source data contained some inaccuracies. Fortunately, with the flexibility of Datylon’s tools, the reports were quickly updated and rerun, and the revised PDFs were delivered promptly to the municipalities.
This project exemplifies how Unizo leveraged data storytelling and automation to provide municipalities with valuable, localized insights, helping to shape a more supportive entrepreneurial environment across Flanders.
What's next?
While Datylon played a key role in supporting Unizo with the production of their customized municipal reports, there’s growing demand from designers and business professionals to manage and produce such reports independently. Responding to this need, Datylon has released a new app, Datylon ChartRunner, which empowers users to generate their own customized reports seamlessly, without coding.
Introducing Datylon ChartRunner
The upcoming Datylon ChartRunner is designed to be an intuitive tool that allows users to create tailored reports directly from Microsoft Excel. With just a simple dataset and pre-designed Datylon templates, users will be able to produce professional, data-driven reports at scale—without needing coding skills. This tool bridges the gap between raw data and polished reporting, making it accessible for a wide range of professionals across industries.
Stay Updated and Get Involved
Curious to see Datylon ChartRunner in action? You can click here to book a live demo and experience how this tool can revolutionize your reporting process.