The Swiss Coordination Center for Research and Education (SCCRE) is an institution of the Swiss federal government and the Swiss Cantonal Ministers of Education. It was established in 1974. It currently operates with 12 employees. The center publishes the Swiss education report every 4 years, starting from 2006. The report evaluates the entire educational system from early childhood to adult education.
Previous production process and associated challenges
Dr. Stefan Denzler, SCCRE Deputy Director, introduced us to a report production process. The report evaluates efficiency, effectiveness, and equity across all educational levels using actual statistical data, individual data, and regression analyses. It takes about two years to produce a report, during which statistical data is updated, and a consultation process requires near-final draft versions for commissioning actors. For each chapter, authors draft approximately 50 charts using Excel.
The previous workflow required a layouter manually import these charts into Adobe Illustrator to create design versions. A year later following data updates, the design had to be completely redone from scratch. Which in essence meant producing two reports in two years.
The manual creation of the report by different individuals caused brand style issues, while the lack of linkage between the design application and data files created a massive production burden. Previous attempts at out-of-the-box solutions, such as using InCopy or linking Excel to Adobe Illustrator, failed and forced the team to revert to manual chart creation.
Stefan identified the breaking point as the infeasibility of managing the workload with a single designer at their small institution, compounded by the requirement to translate the report into four languages without an automated workflow. At this point SCCRE turned to Datylon for a chart automation solution.
Solution and implementation
Datylon produced a custom solution for SCCRE which included a custom script and a set of branded chart templates created in Datylon for Illustrator. The input included Excel spreadsheets with numerical and translation data and chart designs placed online in Datylon Report Studio. The output was ready to publish charts. This workflow allowed to have separate control over data and translation files as well as the possibility to make fast chart updates in case of changes in data.
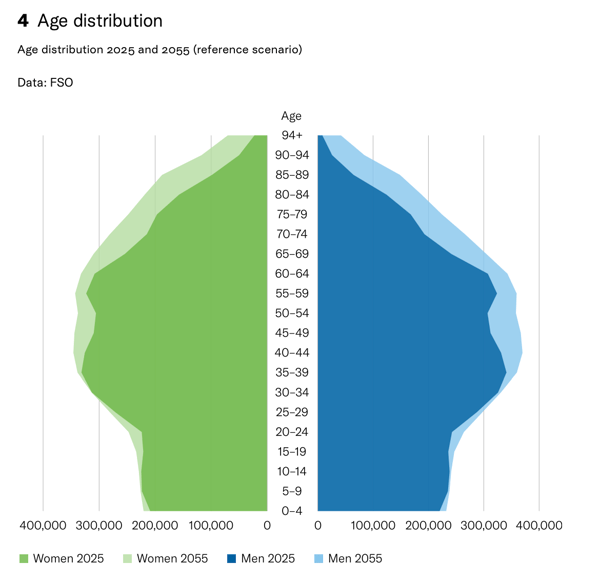
An example of a chart from Swiss Education Report 2026 made with Datylon for Illustrator and edited in Datylon Report Studio
Stefan characterized the development process with Datylon as very professional, featuring a well-structured timeline, regular meetings, and the creation of specific templates for their wide variety of chart types so that the designer and authors could handle them easily. After the handoff of the templates, script and few training sessions, Roger (SCCRE designer) was able to produce all the specific charts based on the branded templates independently. Internal authors were very pleased to be relieved of extensive chart creation and update duties, allowing them to dedicate more time to content quality, correctness, and data review.
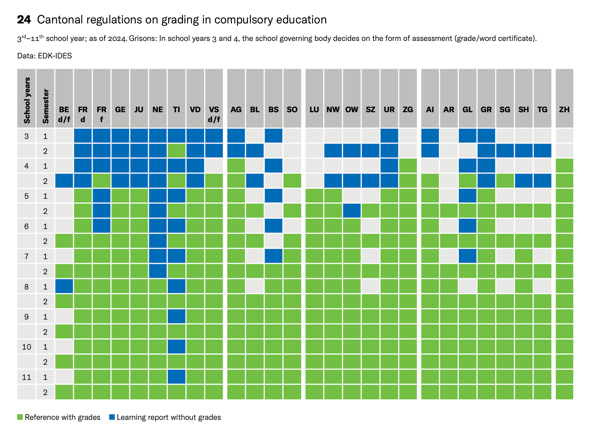 An example of a chart from Swiss Education Report 2026 made with Datylon for Illustrator and edited in Datylon Report Studio
Result and Value
Stefan compared the resources used, stating that the 2023 manual report production required two designers at 50 percent employment each, which proved insufficient and necessitated recruiting additional temporary layout resources while still resulting in pre-printing errors. For 2026 report, only one full-time designer was involved. He invested time upfront to build up the system using pre-created chart templates, Datylon Report Studio and translation sheets for automated chart translation.
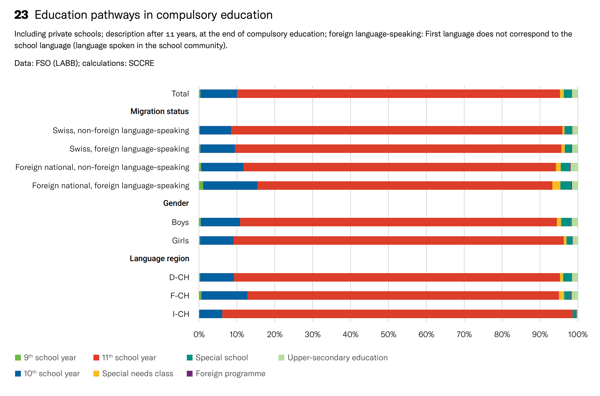 An example of a chart from Swiss Education Report 2026 made with Datylon for Illustrator and edited in Datylon Report Studio
Ultimately, the report production process in 2026 incurred no additional costs related to manual design adjustments and, overall, proceeded more smoothly and in a more structured manner than in 2023. Stefan concluded that the next report production is expected to be even faster and smoother as the automation workflow is already set up and tested during the 2026 report creation.
Stefan added that external readers provided positive feedback, noting that the report featured a smooth, homogeneous design and consistent charts compared to previous editions.
Conclusion
The biggest win from the collaboration between SCCRE and Datylon was removing the headache of manually recreating charts and handling complex multi-language translations. By building custom Report Studio templates and automated workflows together, the SCCRE team turned a stressful, time-consuming production cycle into a smooth and efficient process.