






Home → Solutions → Automated reporting

Automated Reporting for scalable, on-brand reports

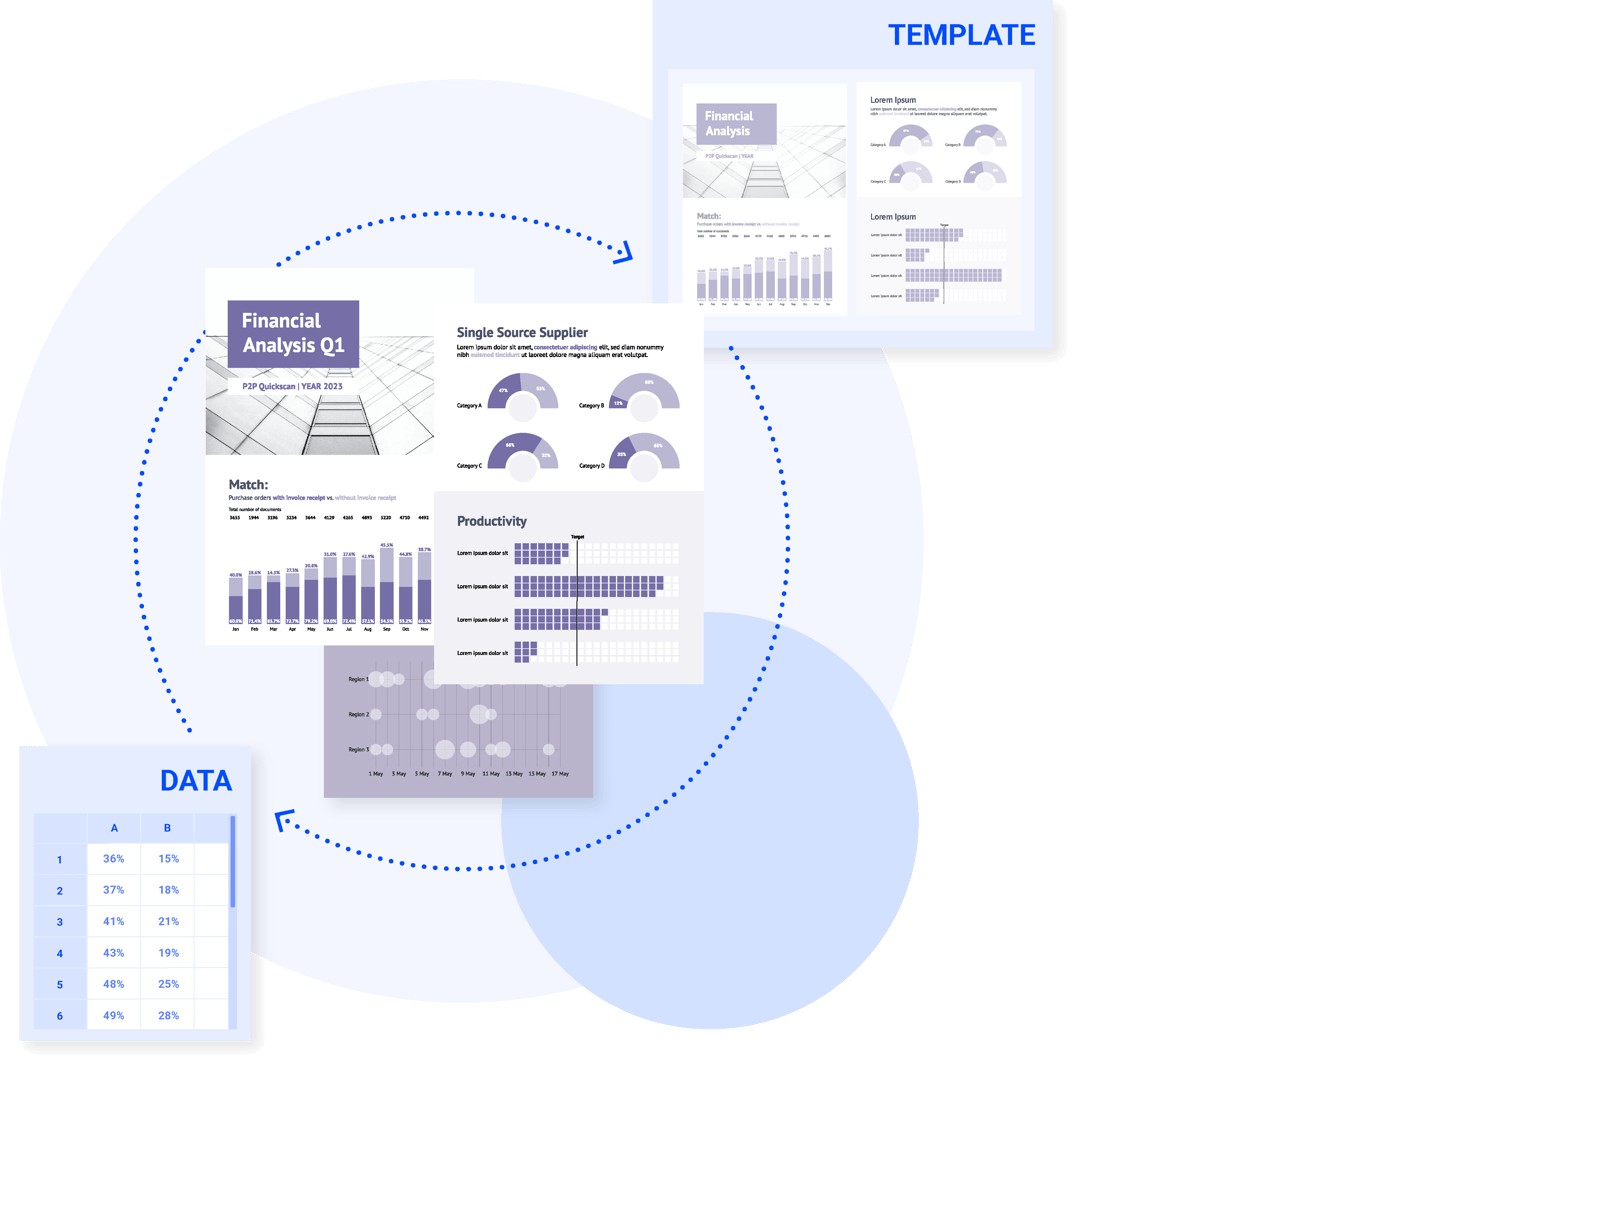
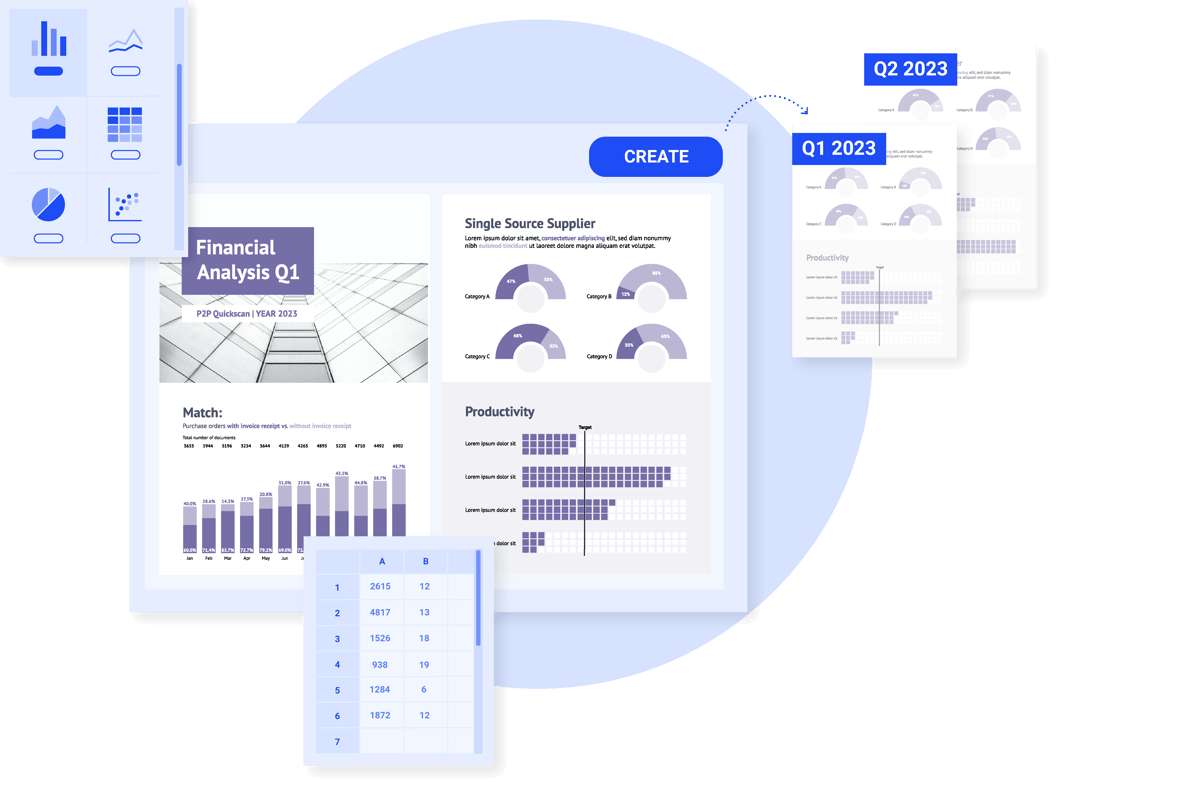
Fresh Data, Pristine Design: Datylon seamlessly integrates new data into your reports, maintaining a polished look every time. No need for manual updates.

Diagram showing data flowing into reusable Datylon templates to generate automated reports

Trusted by organizations that need accurate, on-brand reporting at scale

What is automated reporting software?

Automated reporting software turns changing data into repeatable reports without manually rebuilding each chart, page or document. Datylon combines reusable, brand-controlled templates with Excel, embedded and API-based workflows to generate recurring and personalized visual reports at scale. Datylon focuses on design-controlled, publication-ready reports rather than dashboard-only reporting.

How automated reporting works with Datylon?

datylon-product-reporting-datylon-for-illustrator-feature-02
Website visuals_2024-automate
datylon-product-reporting-datylon-report-server-step-03
1. Design a reusable report template

Create the layout, charts, brand rules and visual hierarchy in Datylon for Illustrator

2. Connect changing data

Use and Excel workflow, embedded integration or automated data connection, depending on the chosen Datylon solution.

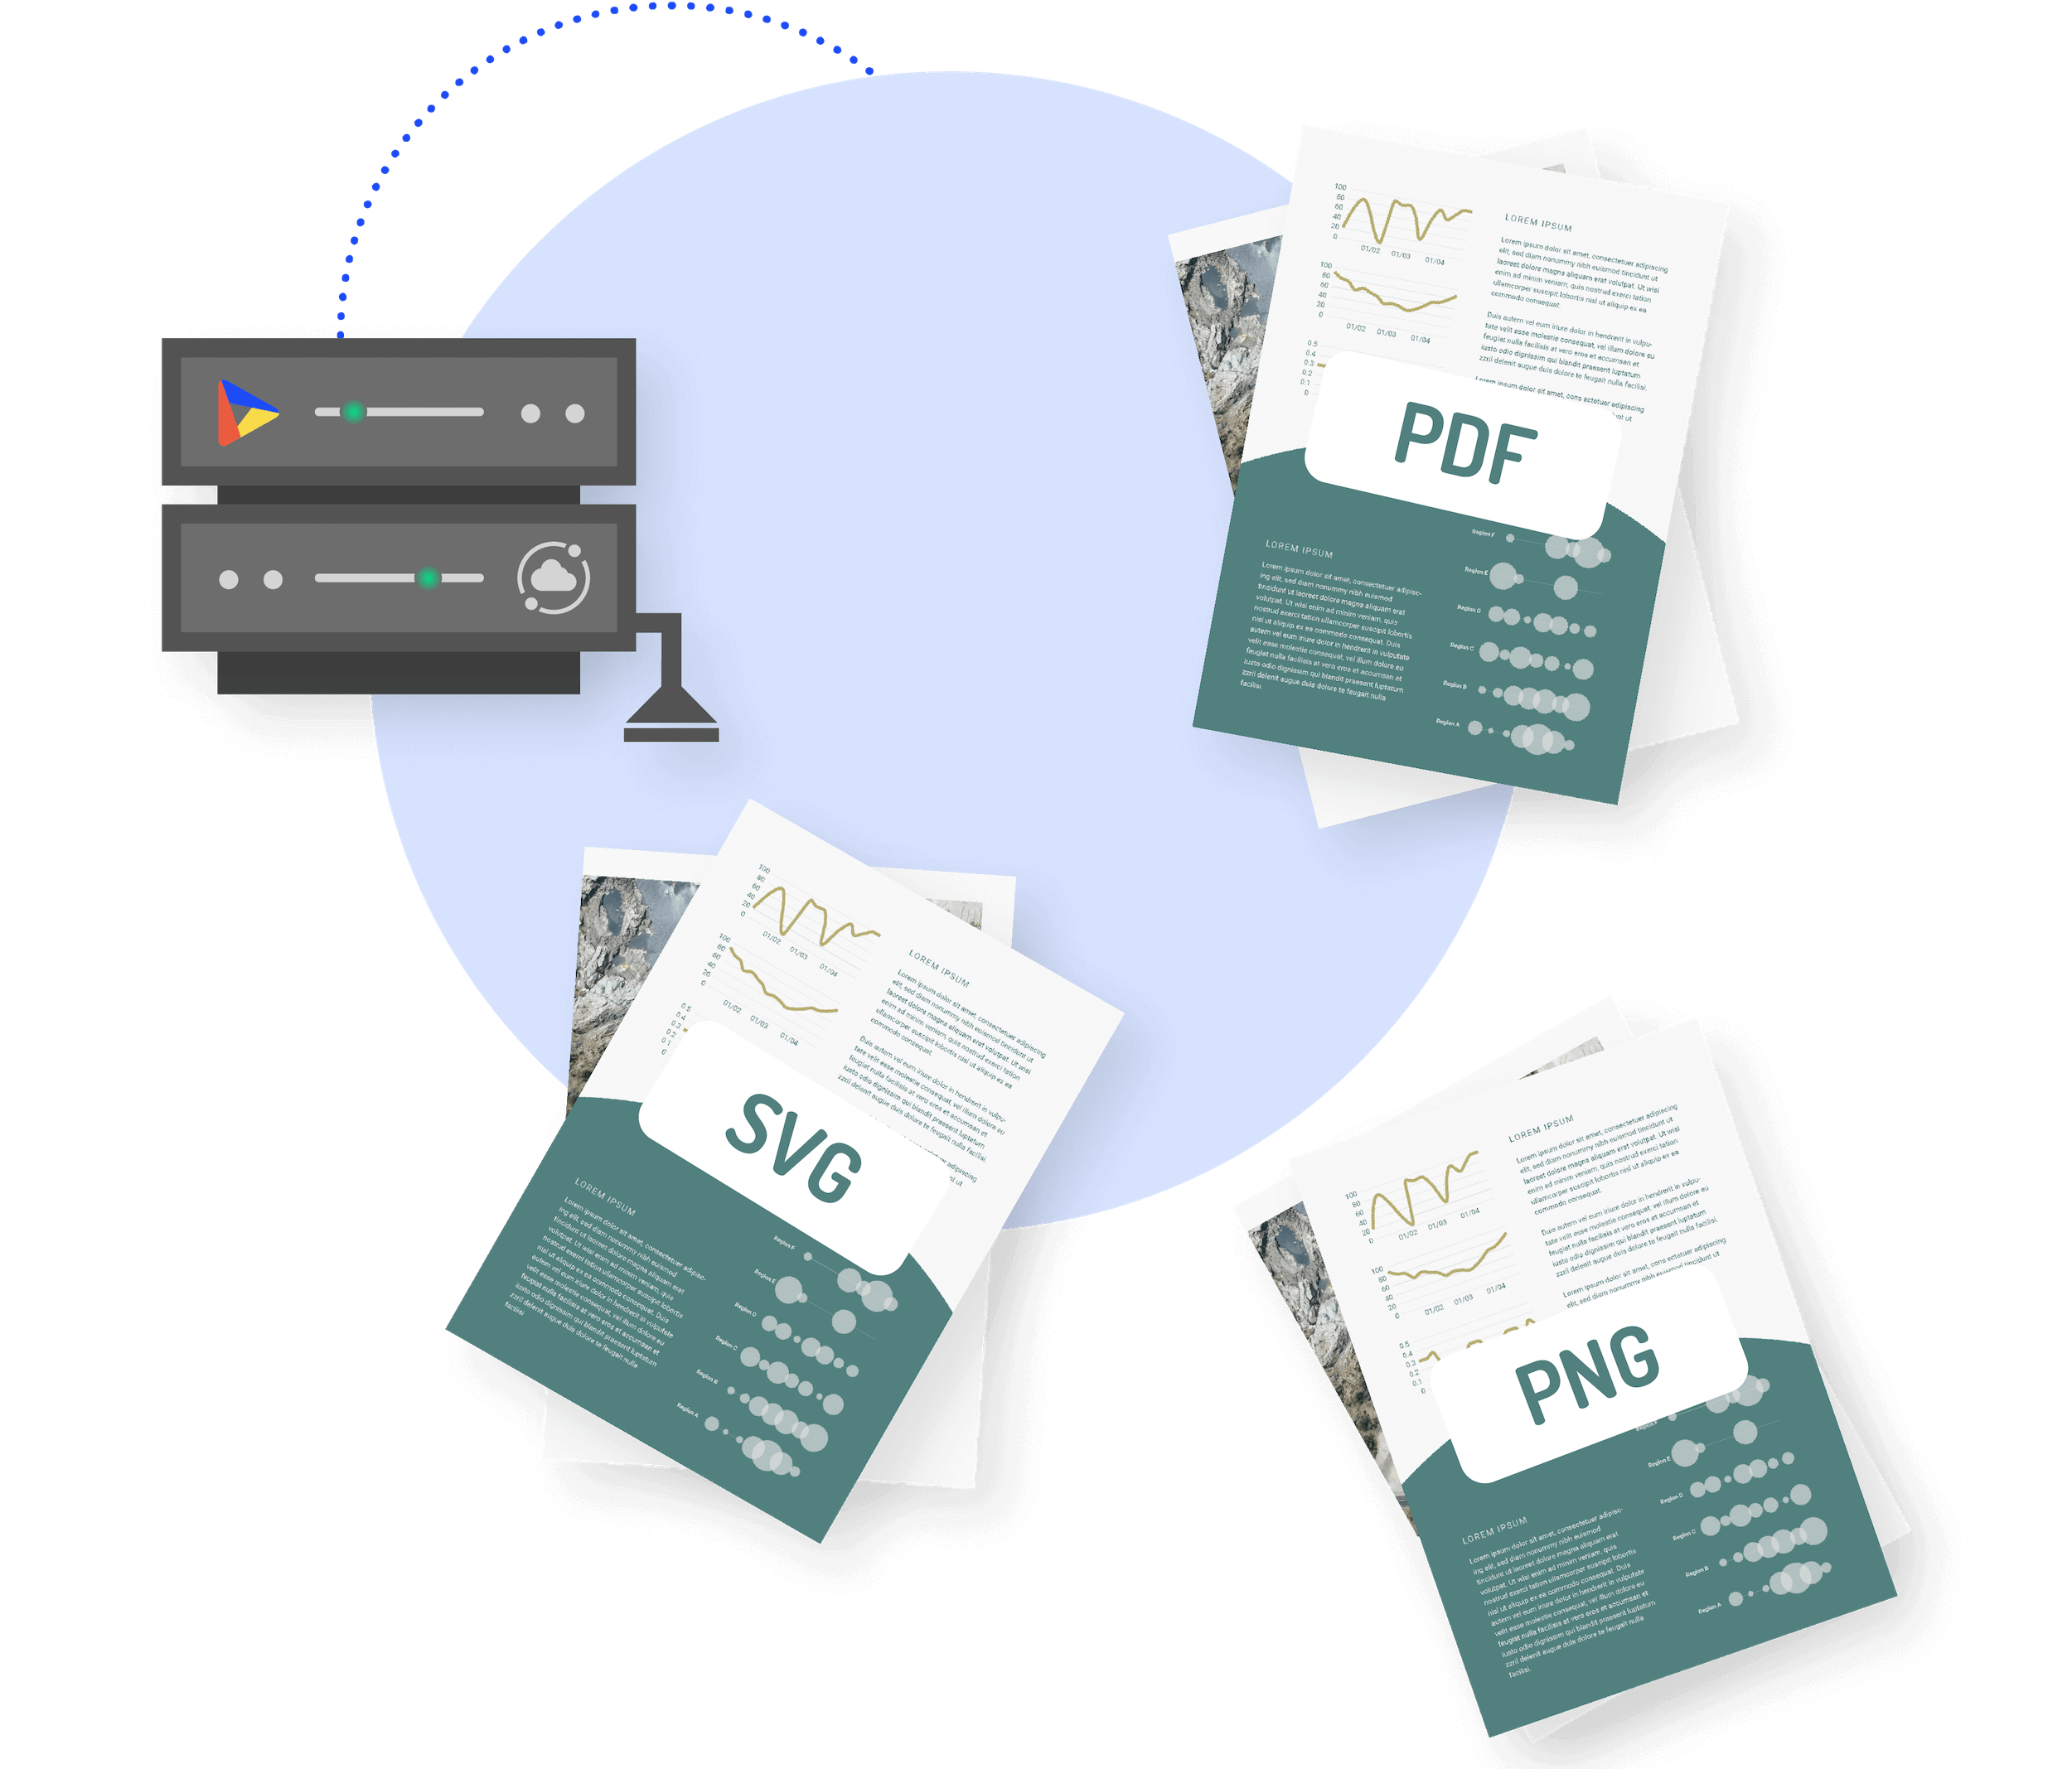
3. Generate and deliver reports

Produce updated charts, pages or complete reports without manually rebuilding the design.

illustration of pages with beautiful reports

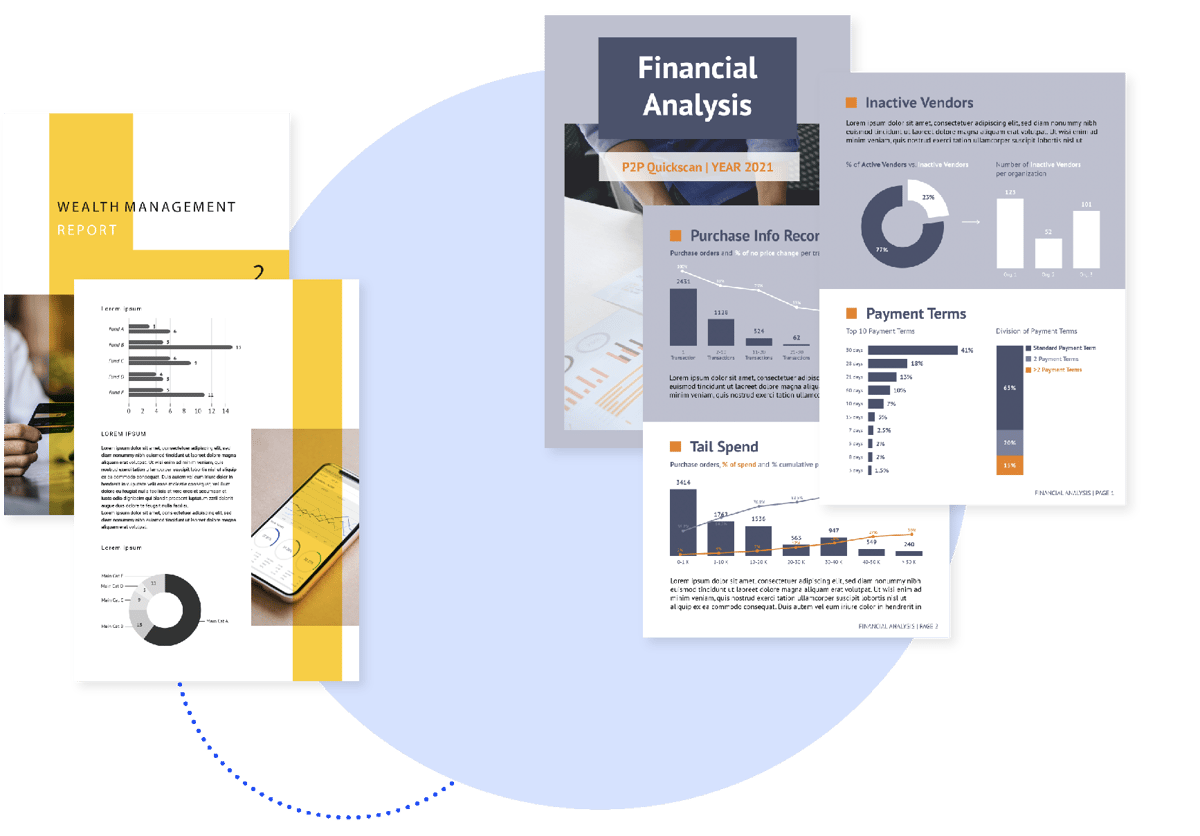
Design reusable, on-brand report templates

Create graphically rich report layouts and data visualizations and reuse the approved templates as data changes. Use Datylon ChartRunner for Excel-driven output or Datylon Report Server for complex, automated multi-page reports. 

schematically made illustration of collaborative work of designers and data specialists

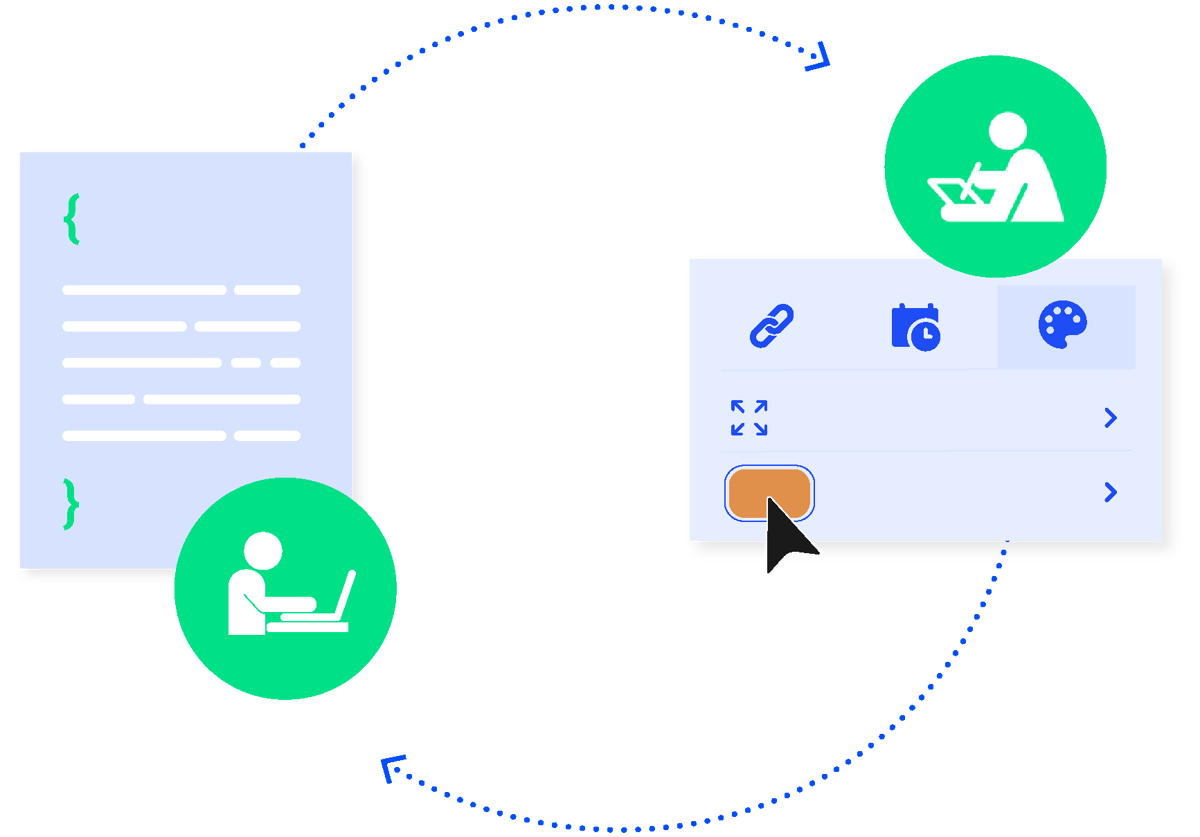
Separate report design from data operations

Designers control layout, branding and visualizations standards while analysis or developers manage changing data. Approved template changes can be deployed without rebuilding the entire workflow. 

an illustration of a possibilities of creating recurring reports

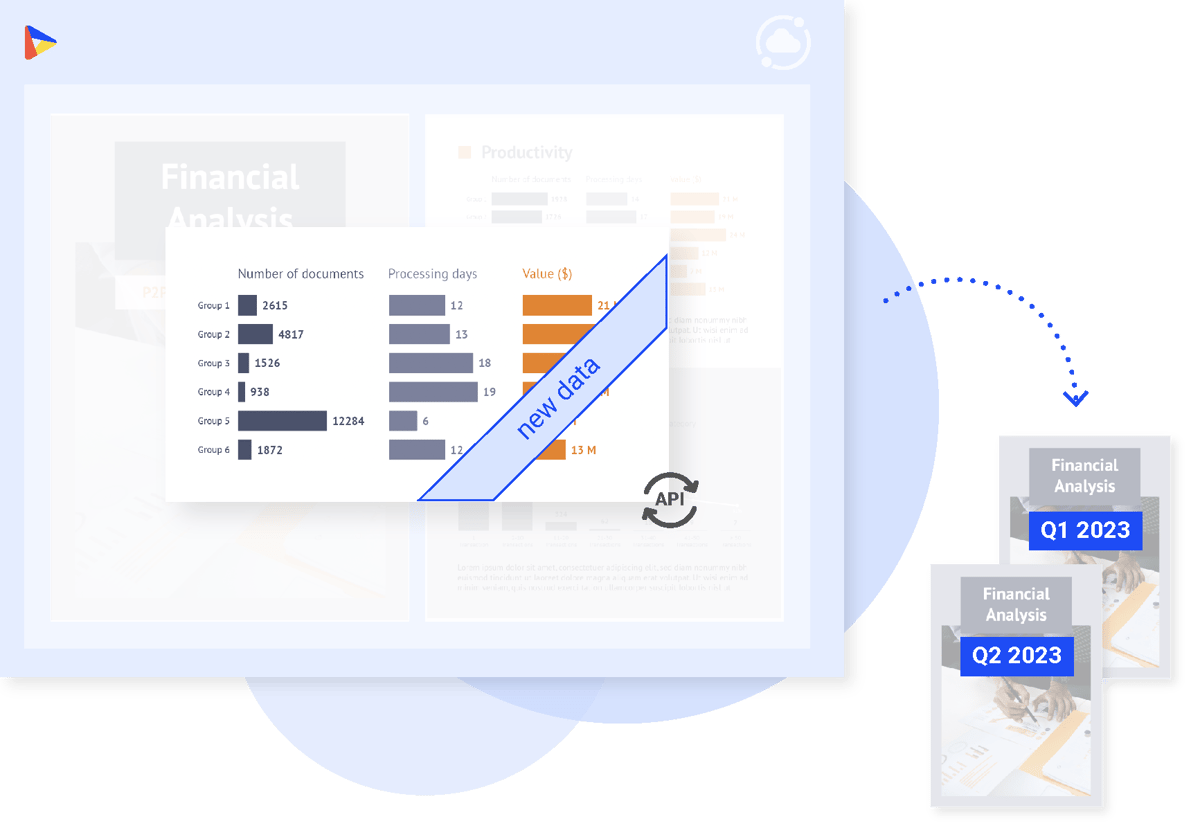
Generating recurring reports from changing data

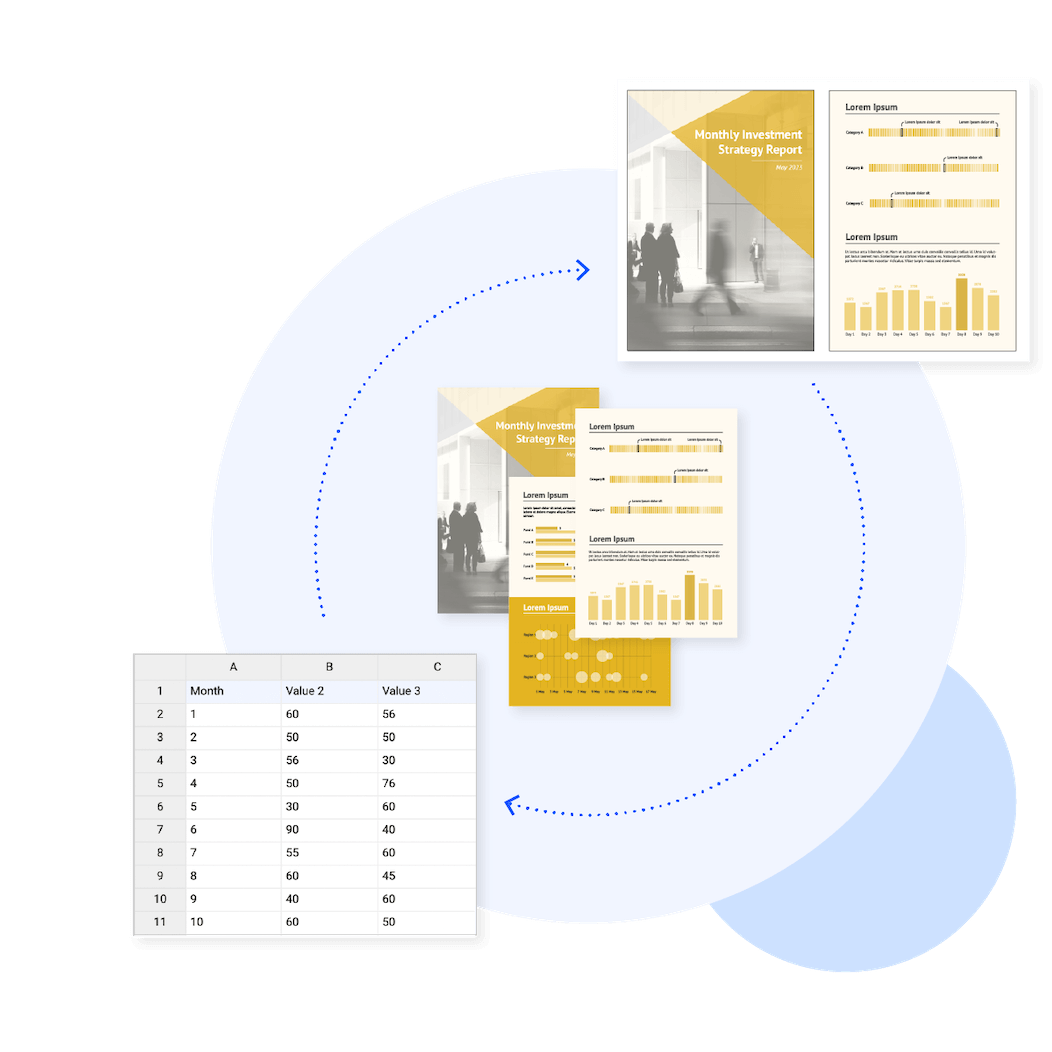
Once the report template and data mapping are configured, Datylon can produce updated report versions without repetitive formatting. Teams can spend more time on reviewing insights and less time rebuilding pages.

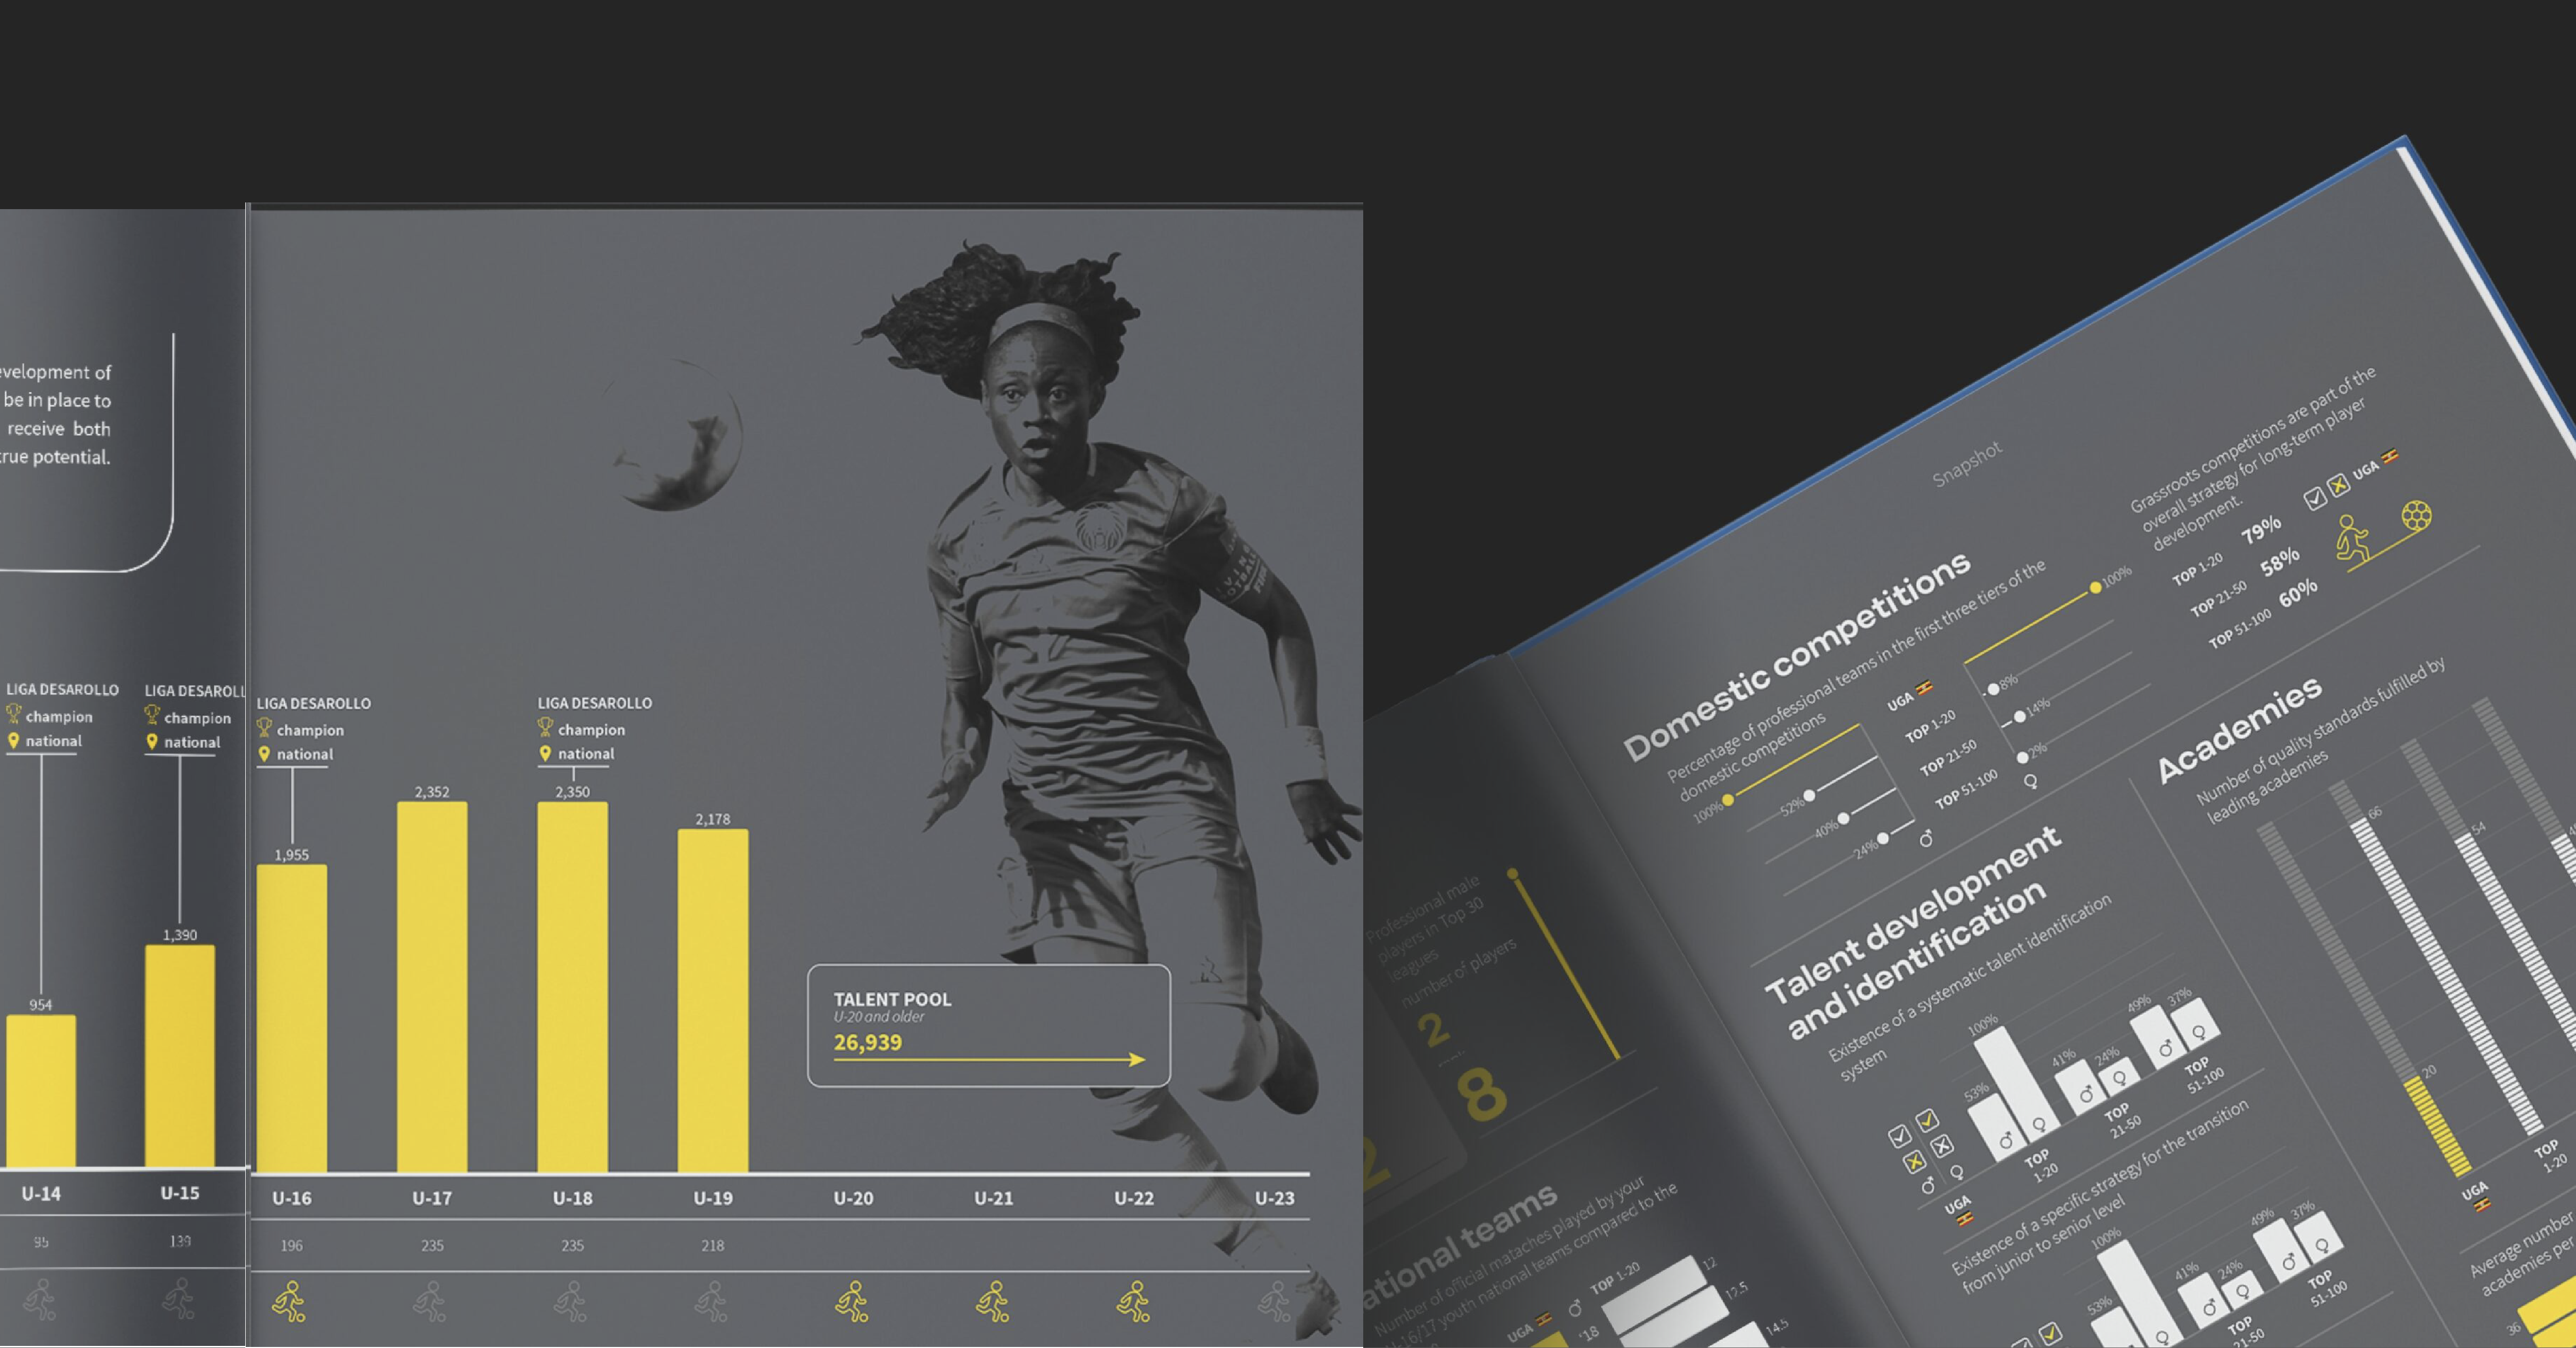
Datylon automated report template and generated output

Automate batch report production without sacrificing design

Generate multiple report variants from one data source while preserving approved layouts, branding and chart rules. Set up your Datylon ChartRunner in minutes, allowing you to deliver data insights to your customers consistently and effortlessly.

datylon-home-step-03

Choose the automated reporting workflow that fits your team

Datylon supports different reporting workflows depending on your data source, output volume, integration requirements and technical resources. 

  • Excel-based report automation with ChartRunner: Use Excel to prepare data and generate multiple report or chart variations locally with ChartRunner add-in. Best for teams that want a no-code, Excel-driven workflow.
  • Embedded Reporting for applications and portals: Datylon-generated reports or visualizations into an existing software product, portal or customer workflow. Best for product and development teams. 
  • Automated report generation with Datylon Report Server: Use Report Server for recurring, personalized or high-volume report generation through an automated data workflow. Datylon can support the implementation where required. 

Turn reccuring reporting into a repeatable workflow

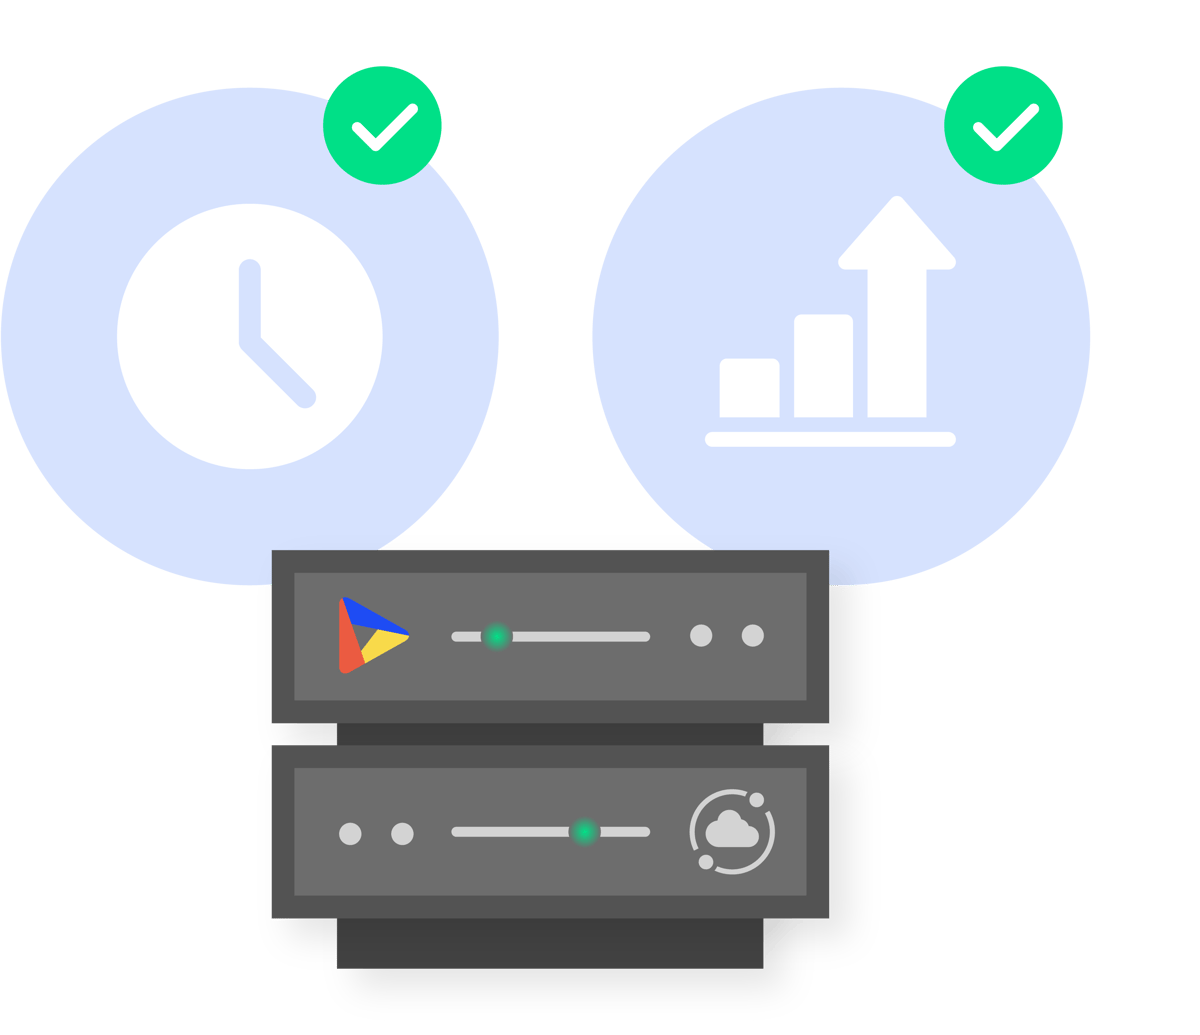
Use reusable templates and automated updates to deliver clearer, more consistent reports with less repetitive production work.

What Datylon helps reporting teams automate

Create consistent reports. shorten production cycles and scale output across reporting periods, customers and teams.
Styling charts

Keep every report on-brand

Apply approved layouts, typography, colors and visualization rules consistently as the underlying data changes.

Data update on time

Move from data update to finished report faster

Reduce repetitive chart and page formatting so analyst and stakeholders can review the latest information sooner.

Scale reporting

Scale form one report to high-volume production

Reuse templates to generate additional report versions, reporting periods or personalized outputs without redesigning each document. 

Automated reporting case studies

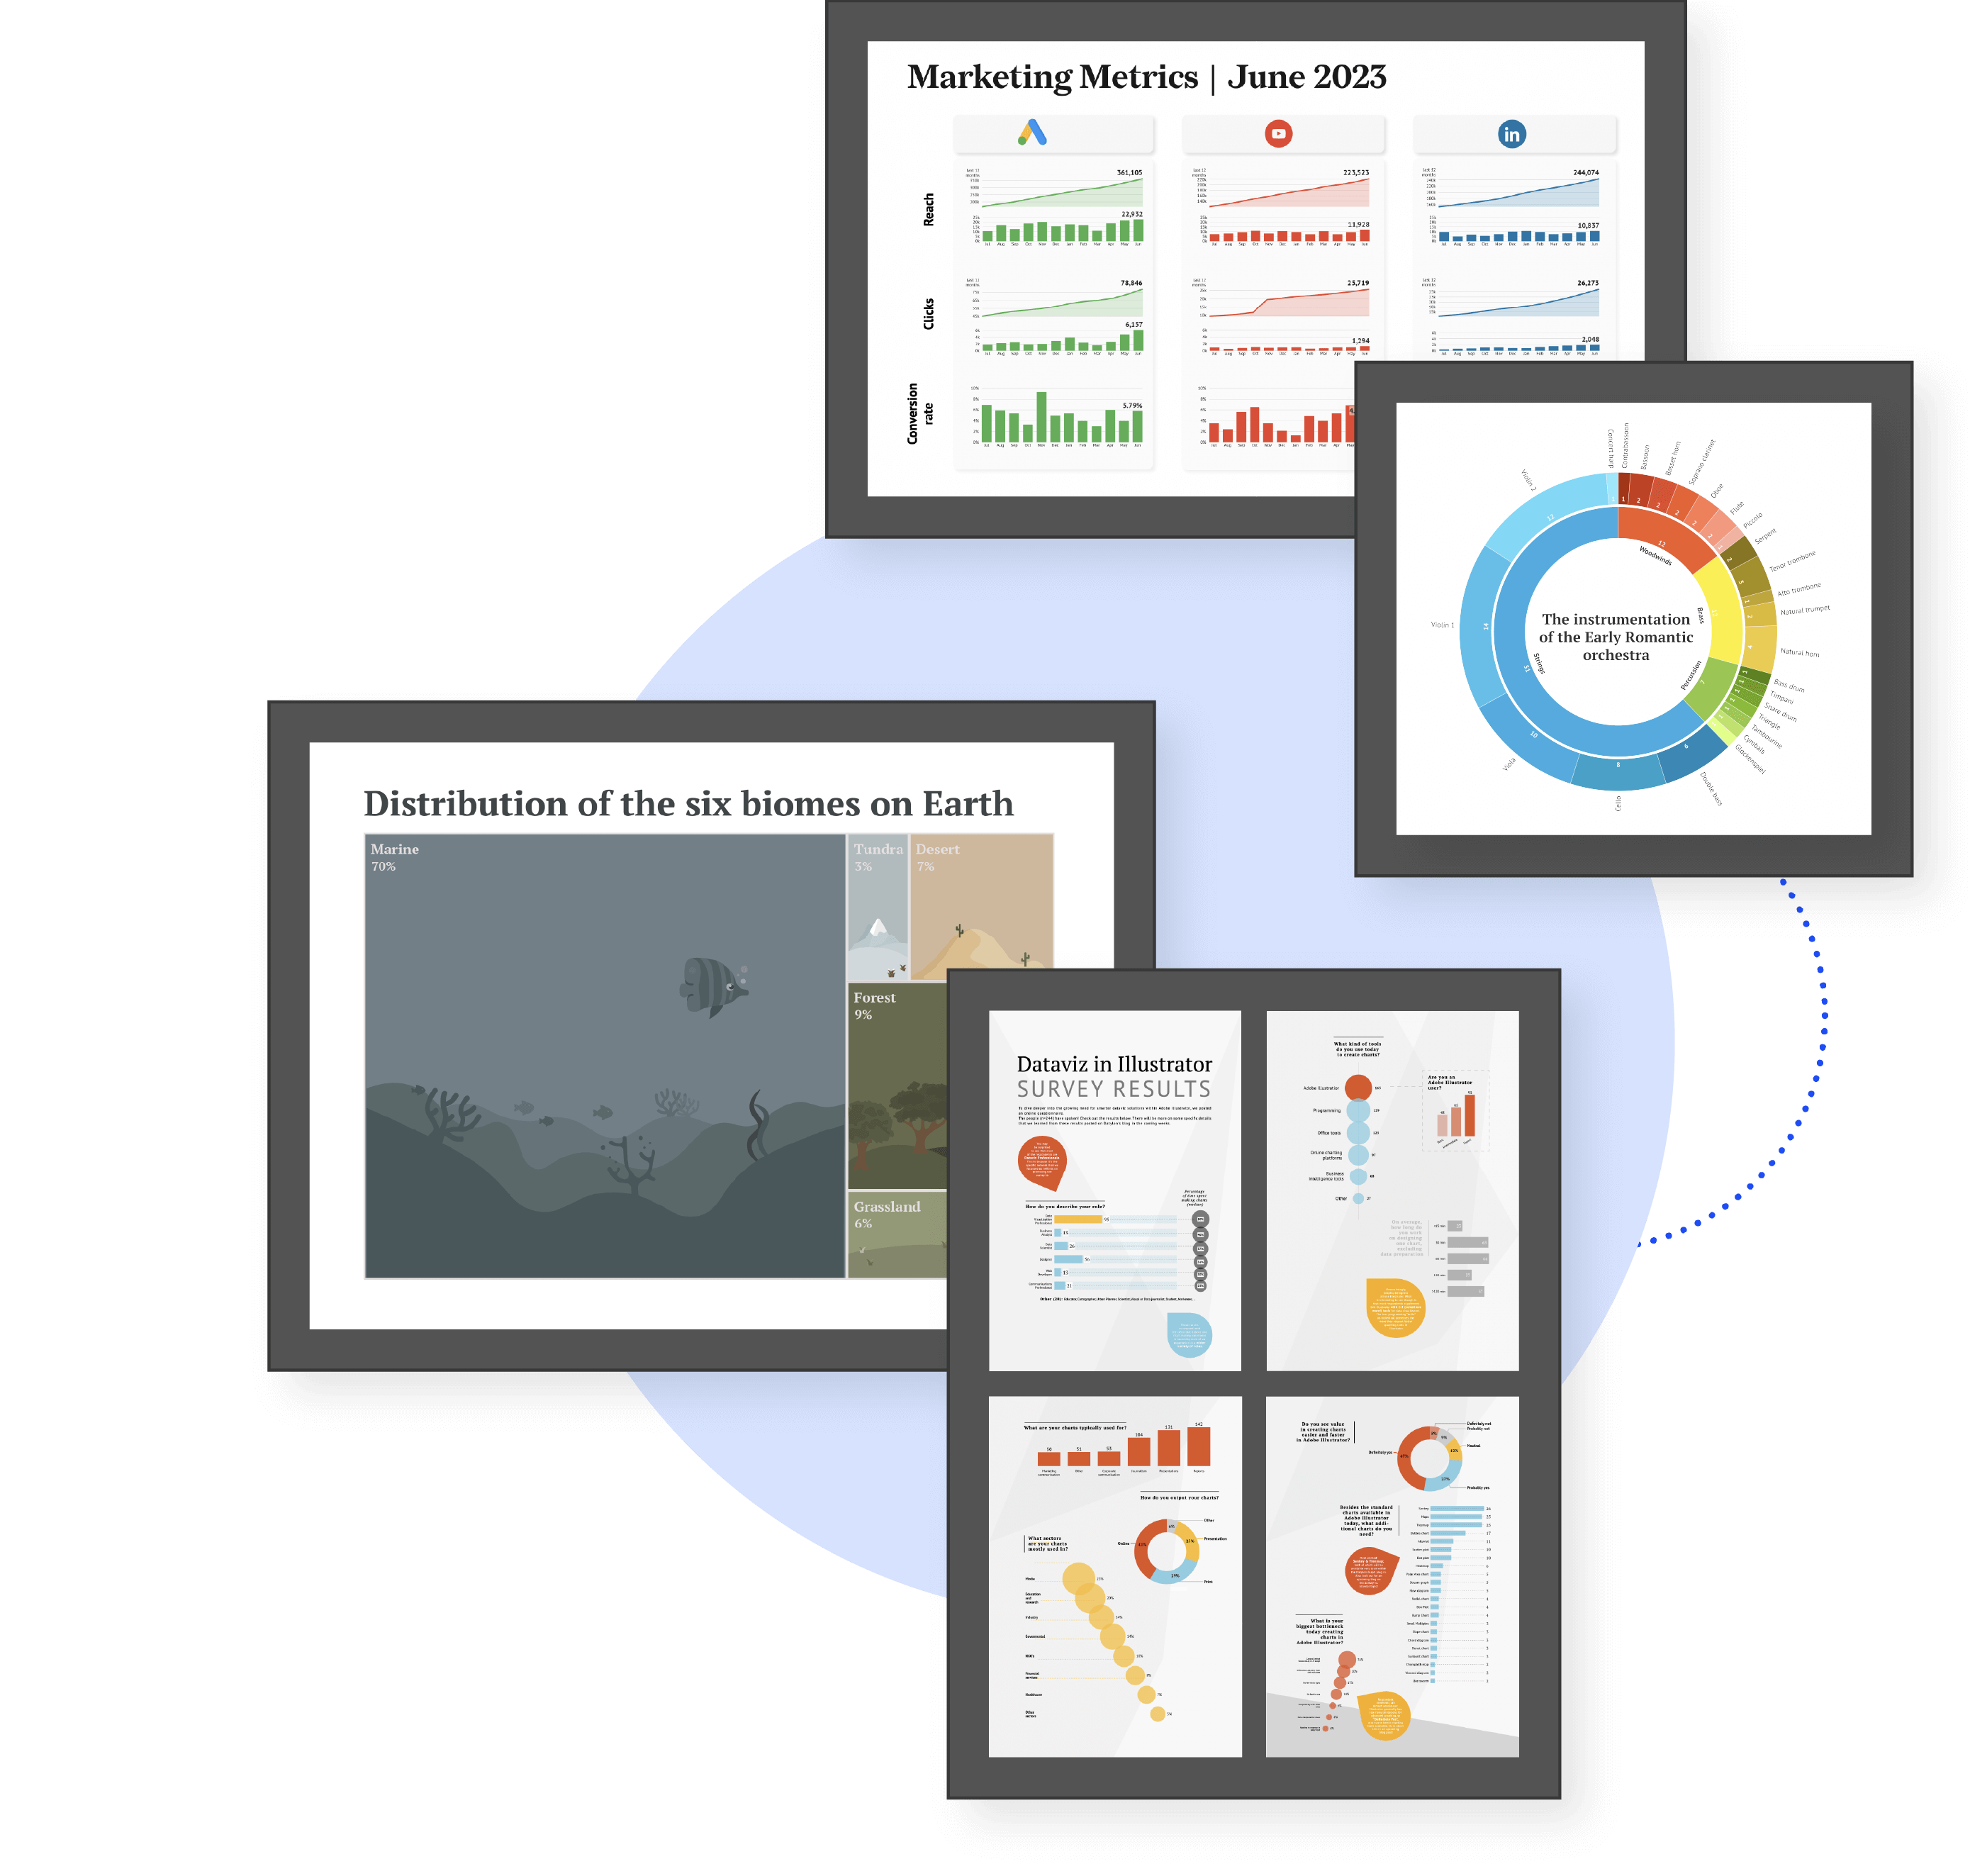
See how organizations use Datylon to create recurring, personalized and high-volume reports while preserving design quality.

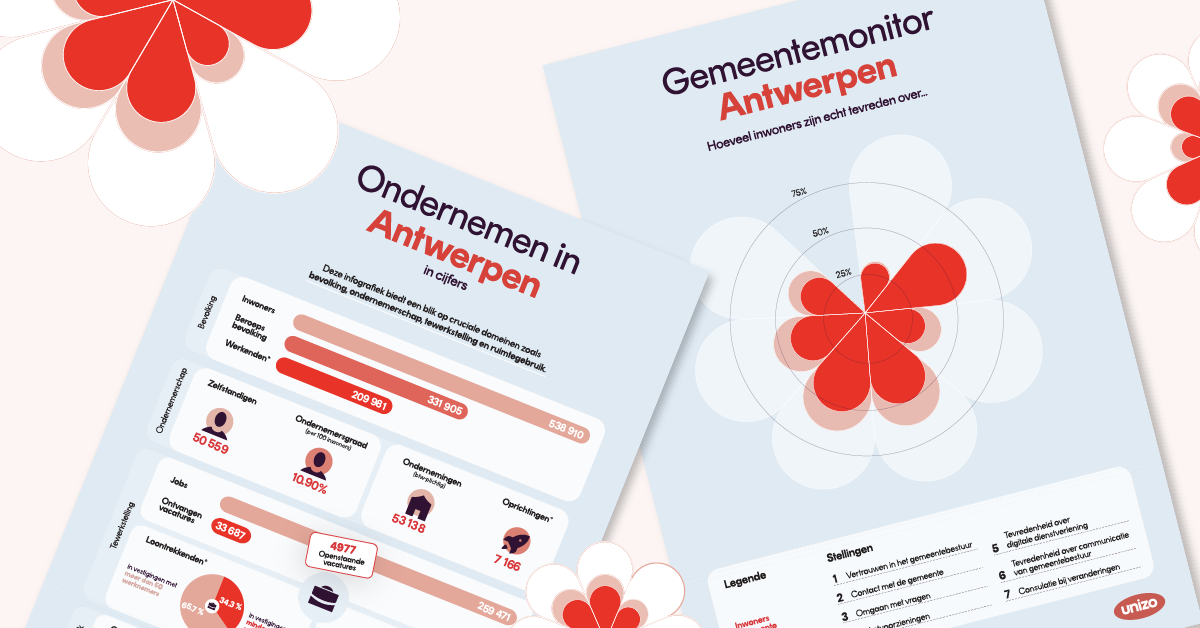
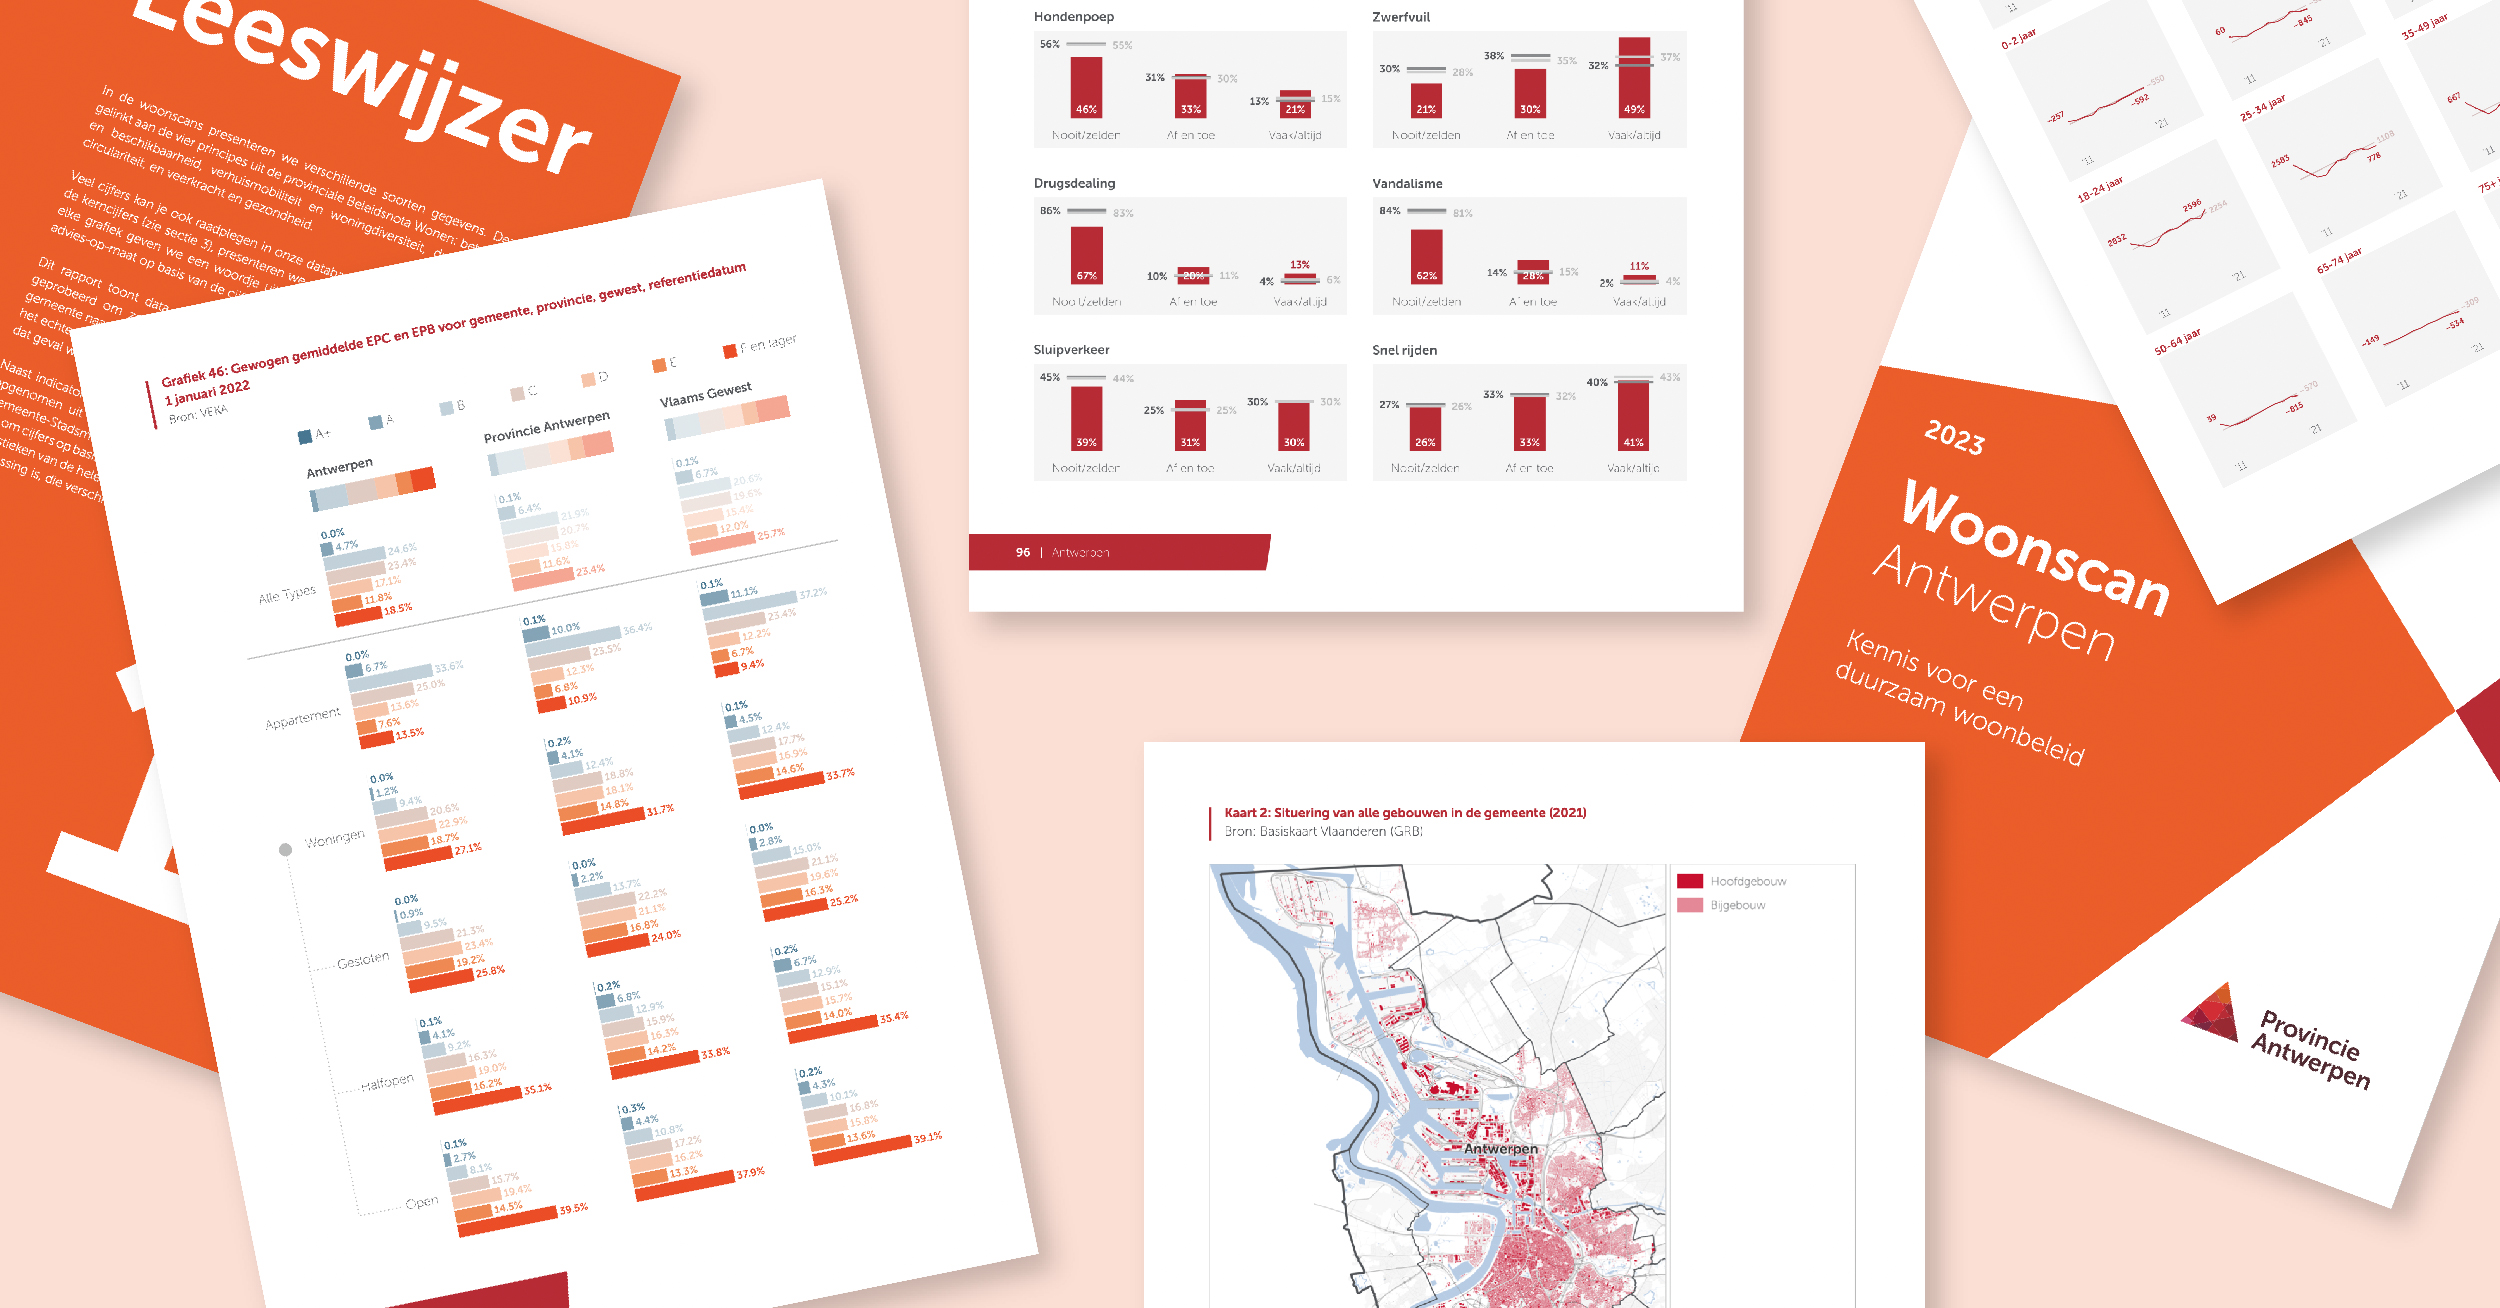
Targeted Reports to Empower Municipalities

Unizo is the largest Flemish employers’ organization in Belgium, representing over 80,000 small and...
Read More

Jaaf Information Design Unleashing the Power of Clarity

Nestled in the Netherlands with its vibrant design scene, Jaaf Information Design stands out as a...
Read More

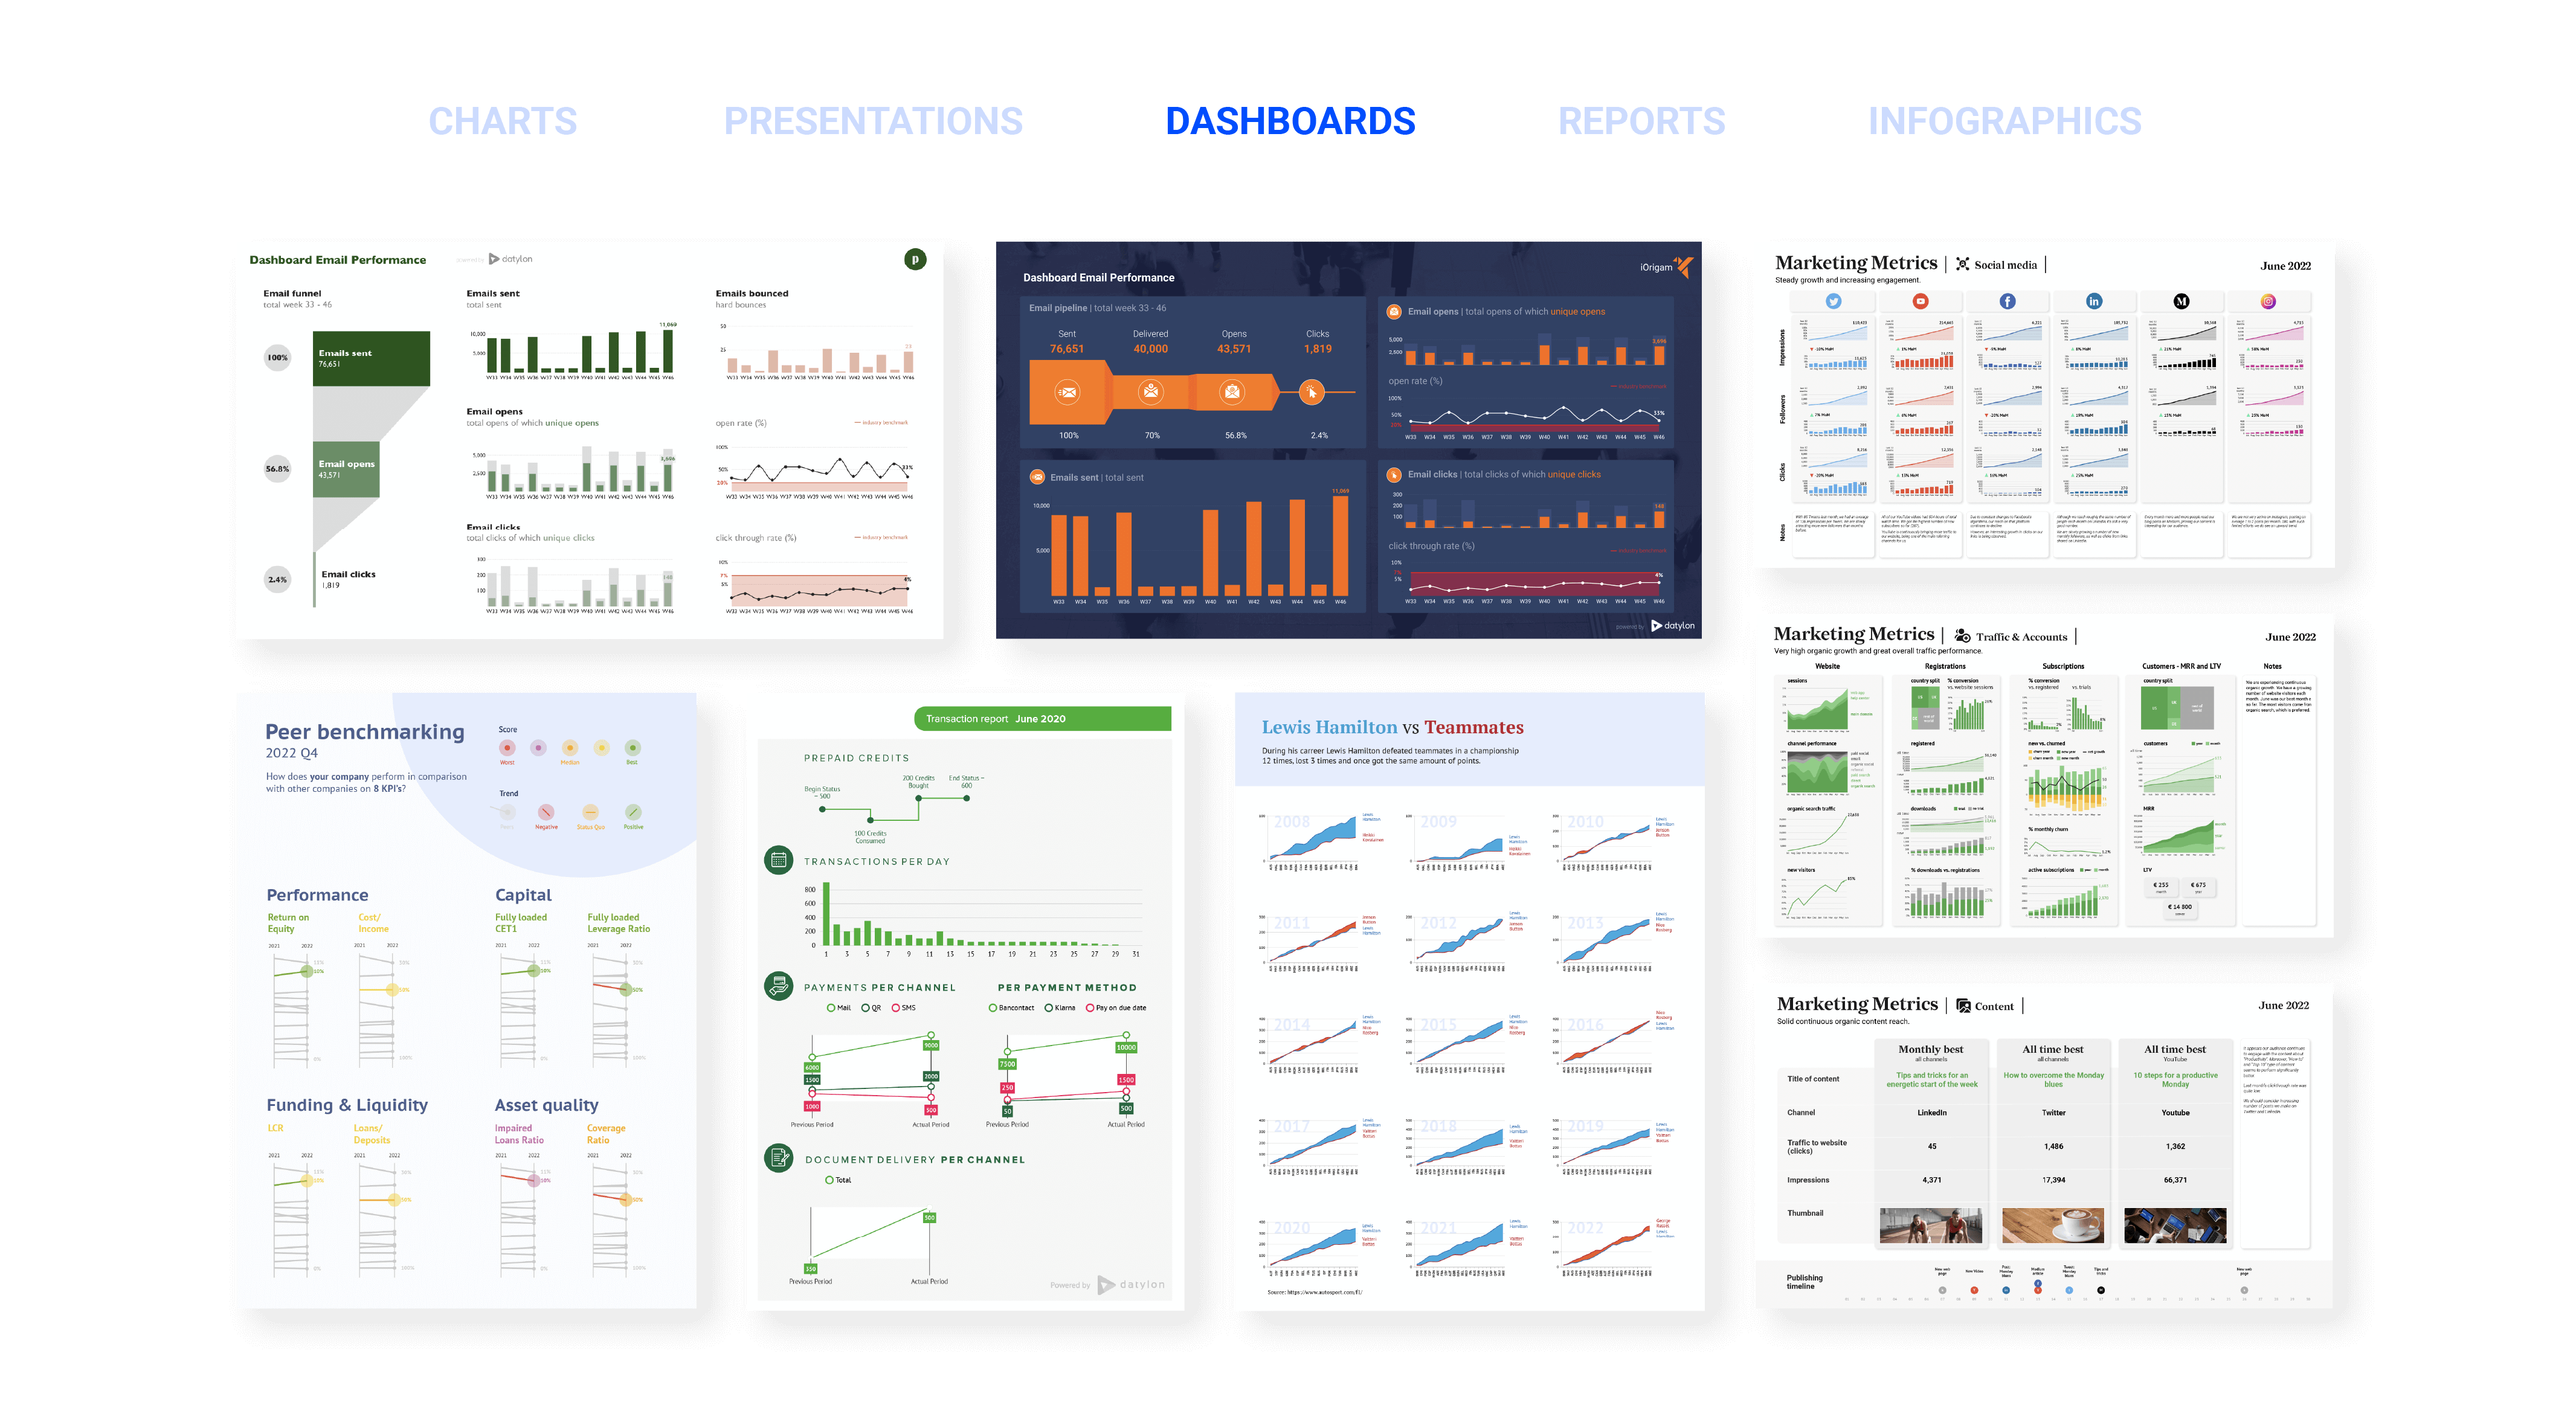
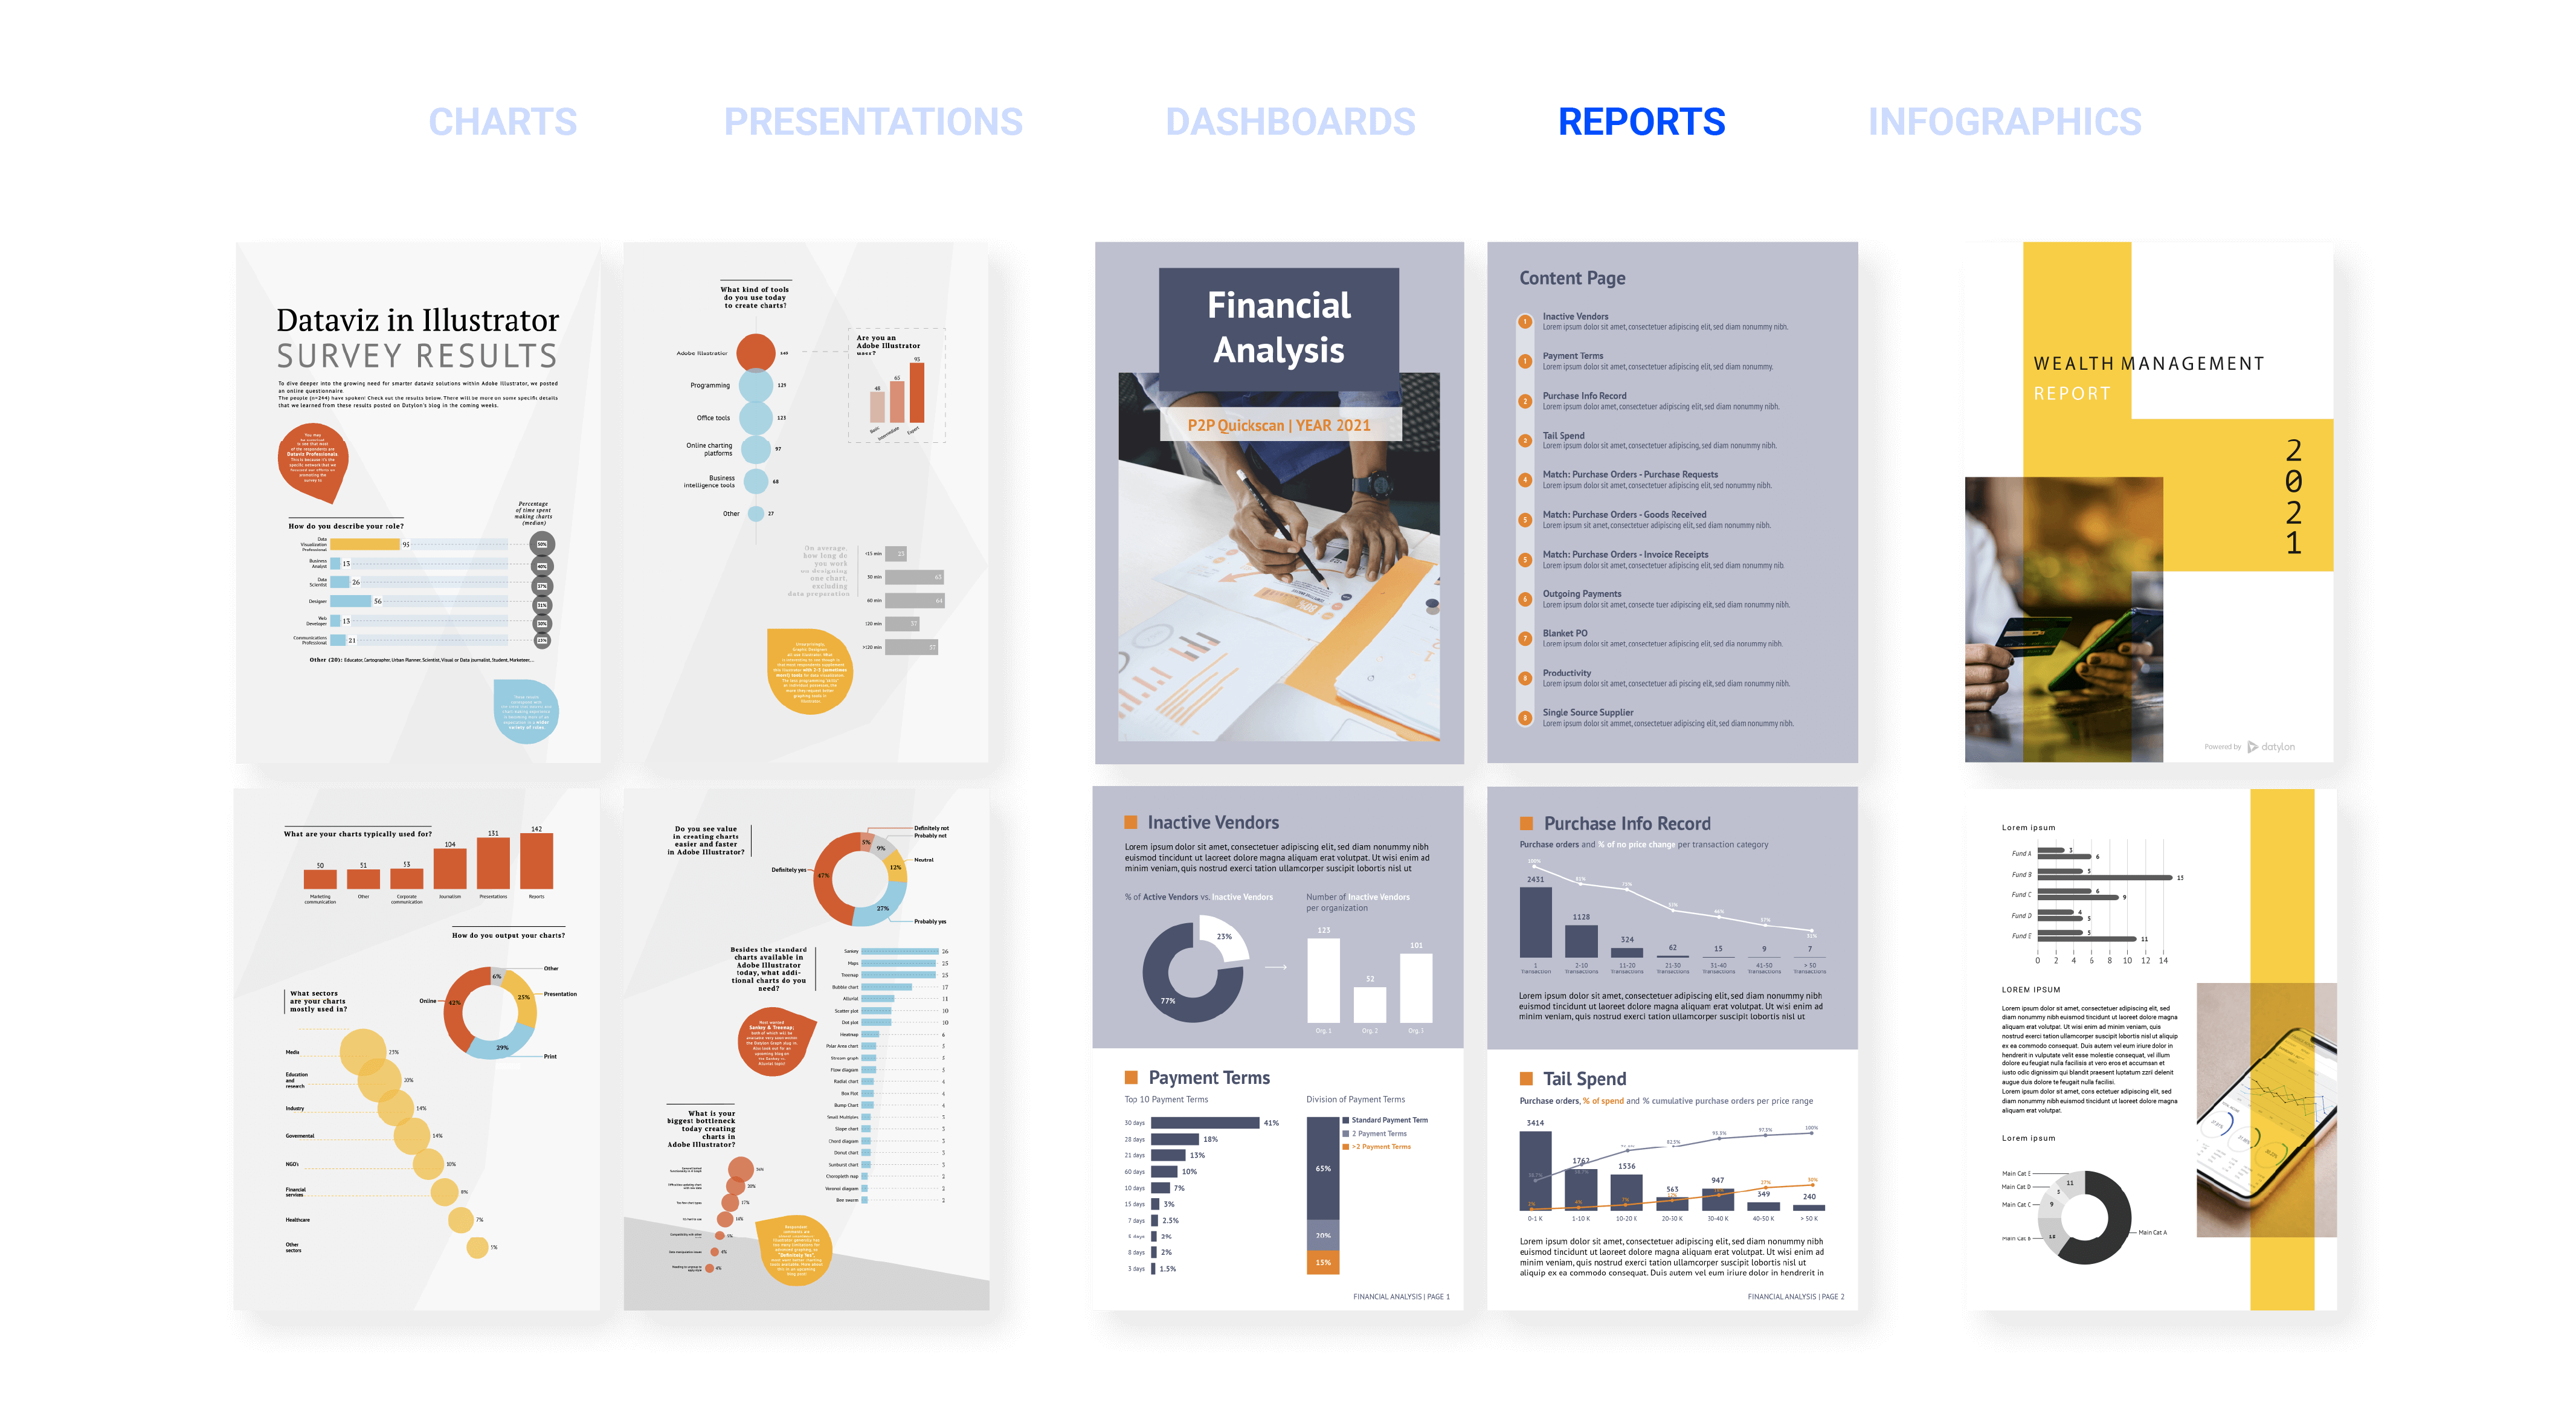
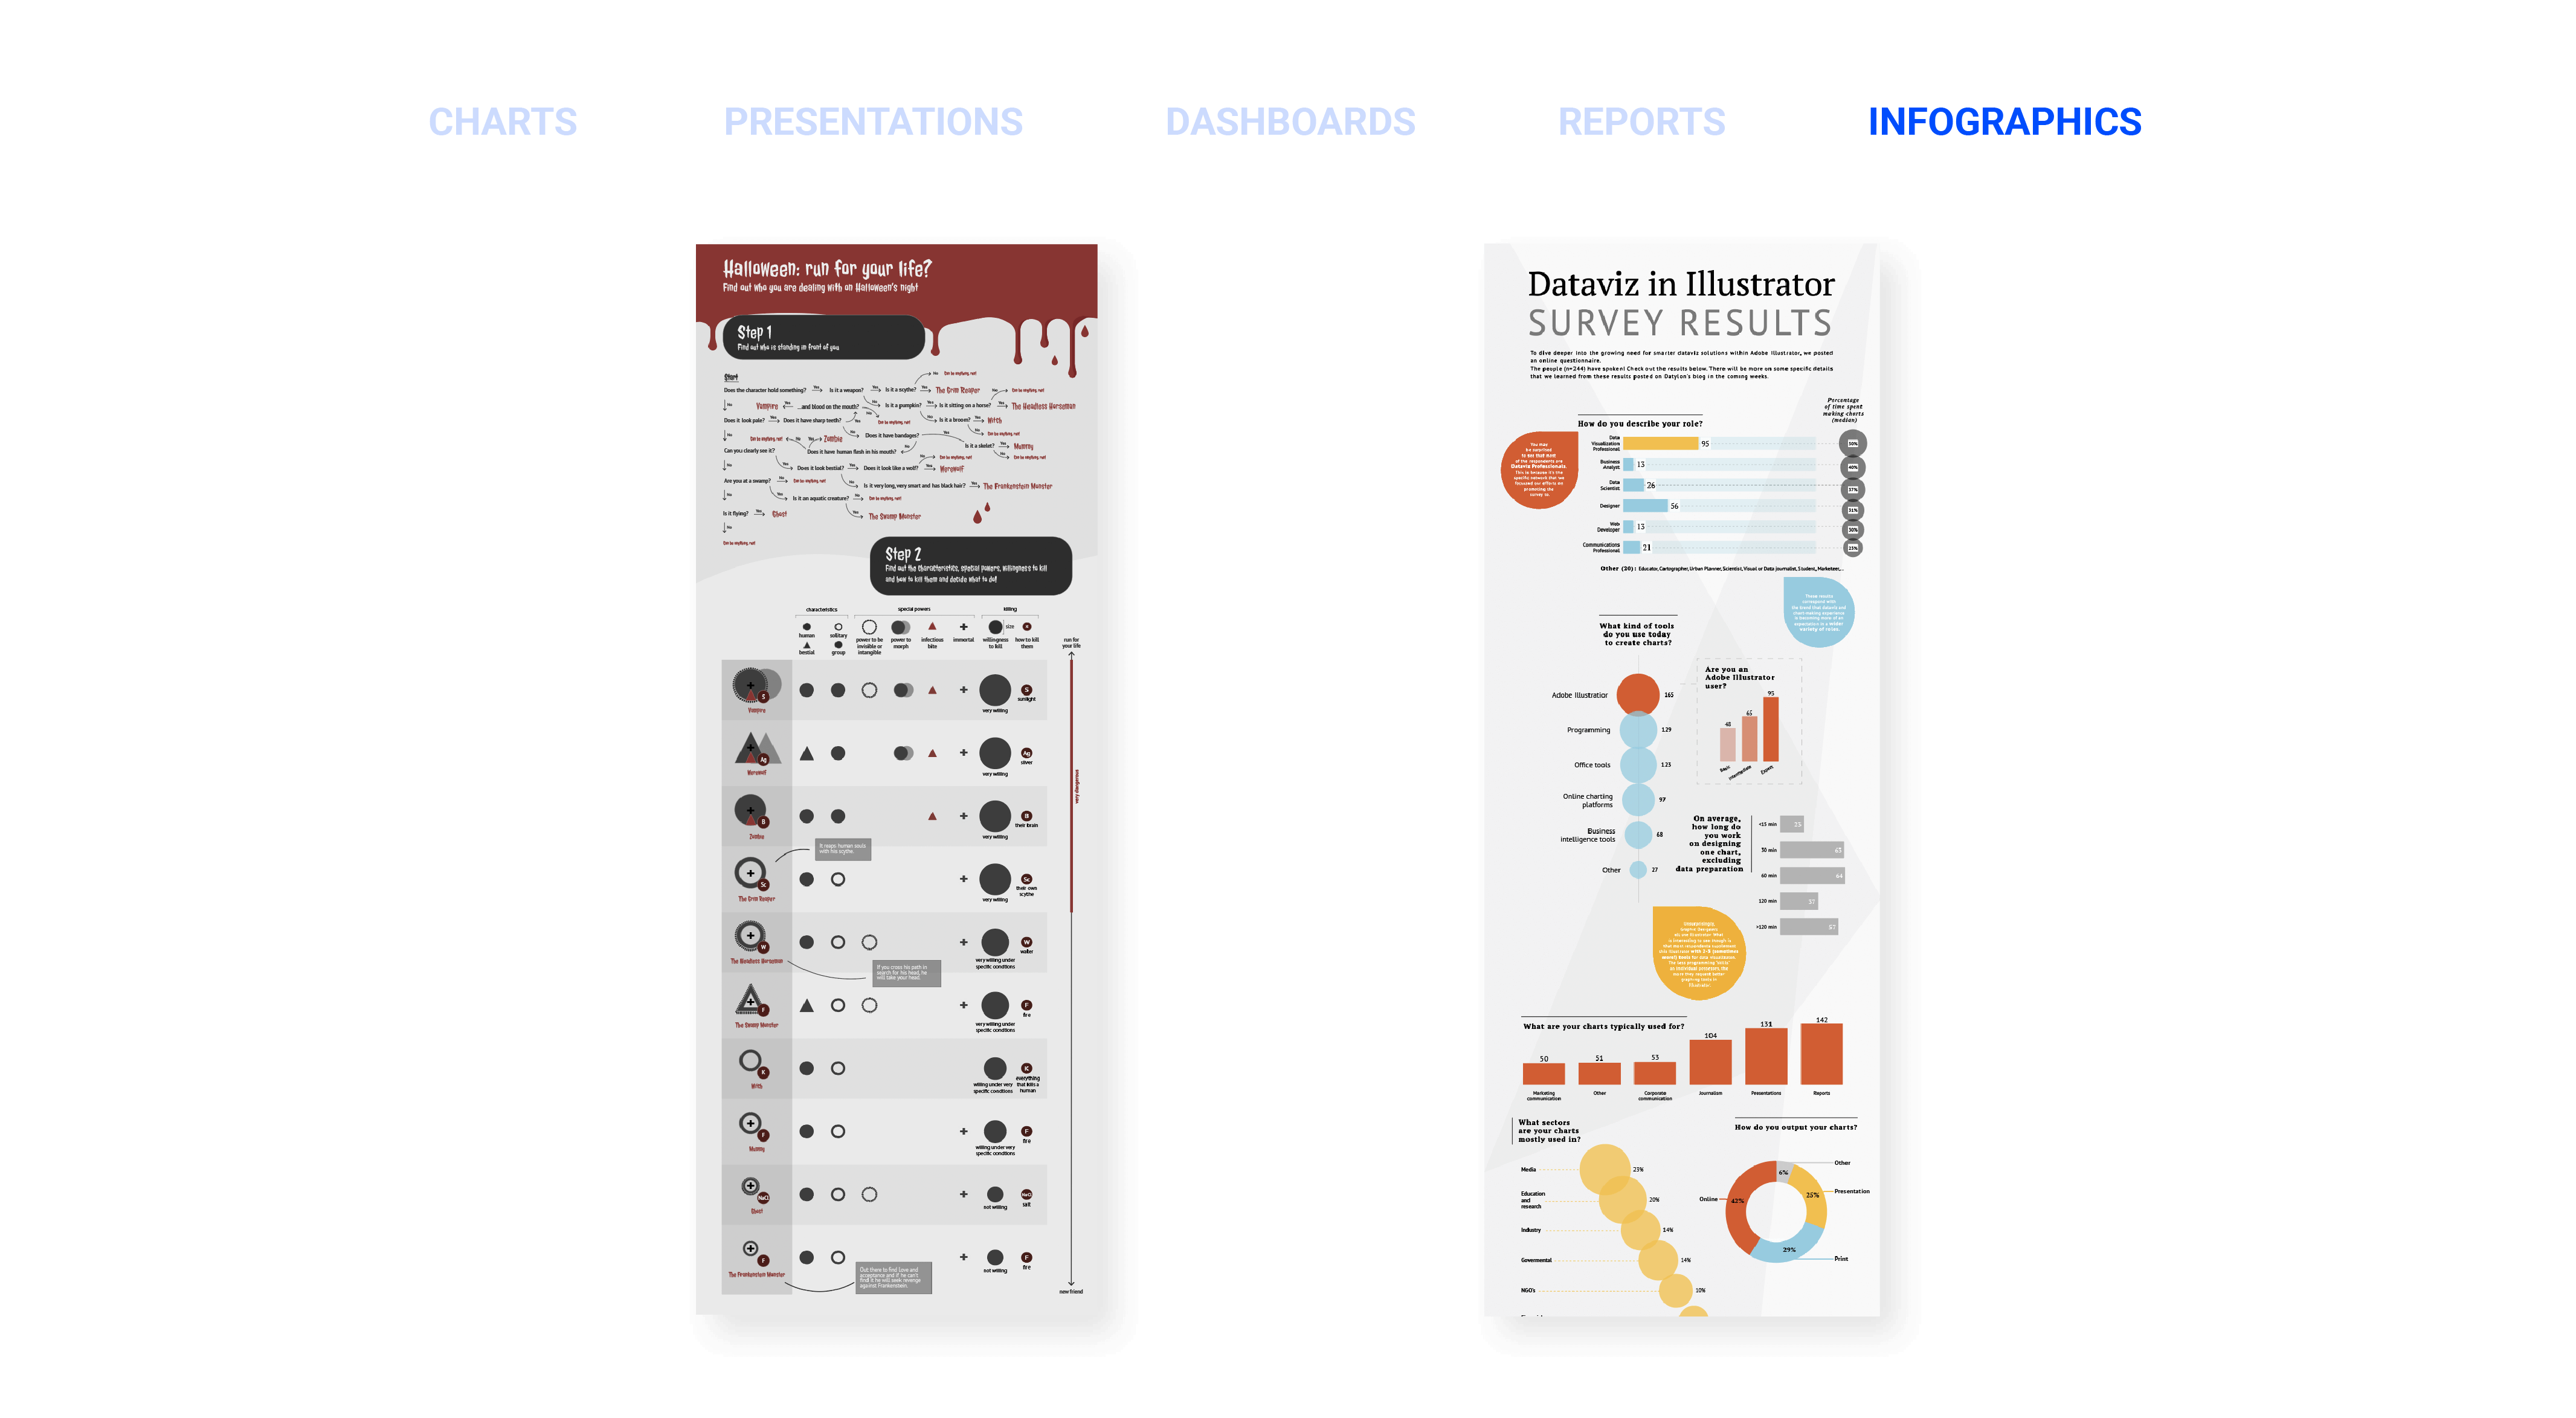
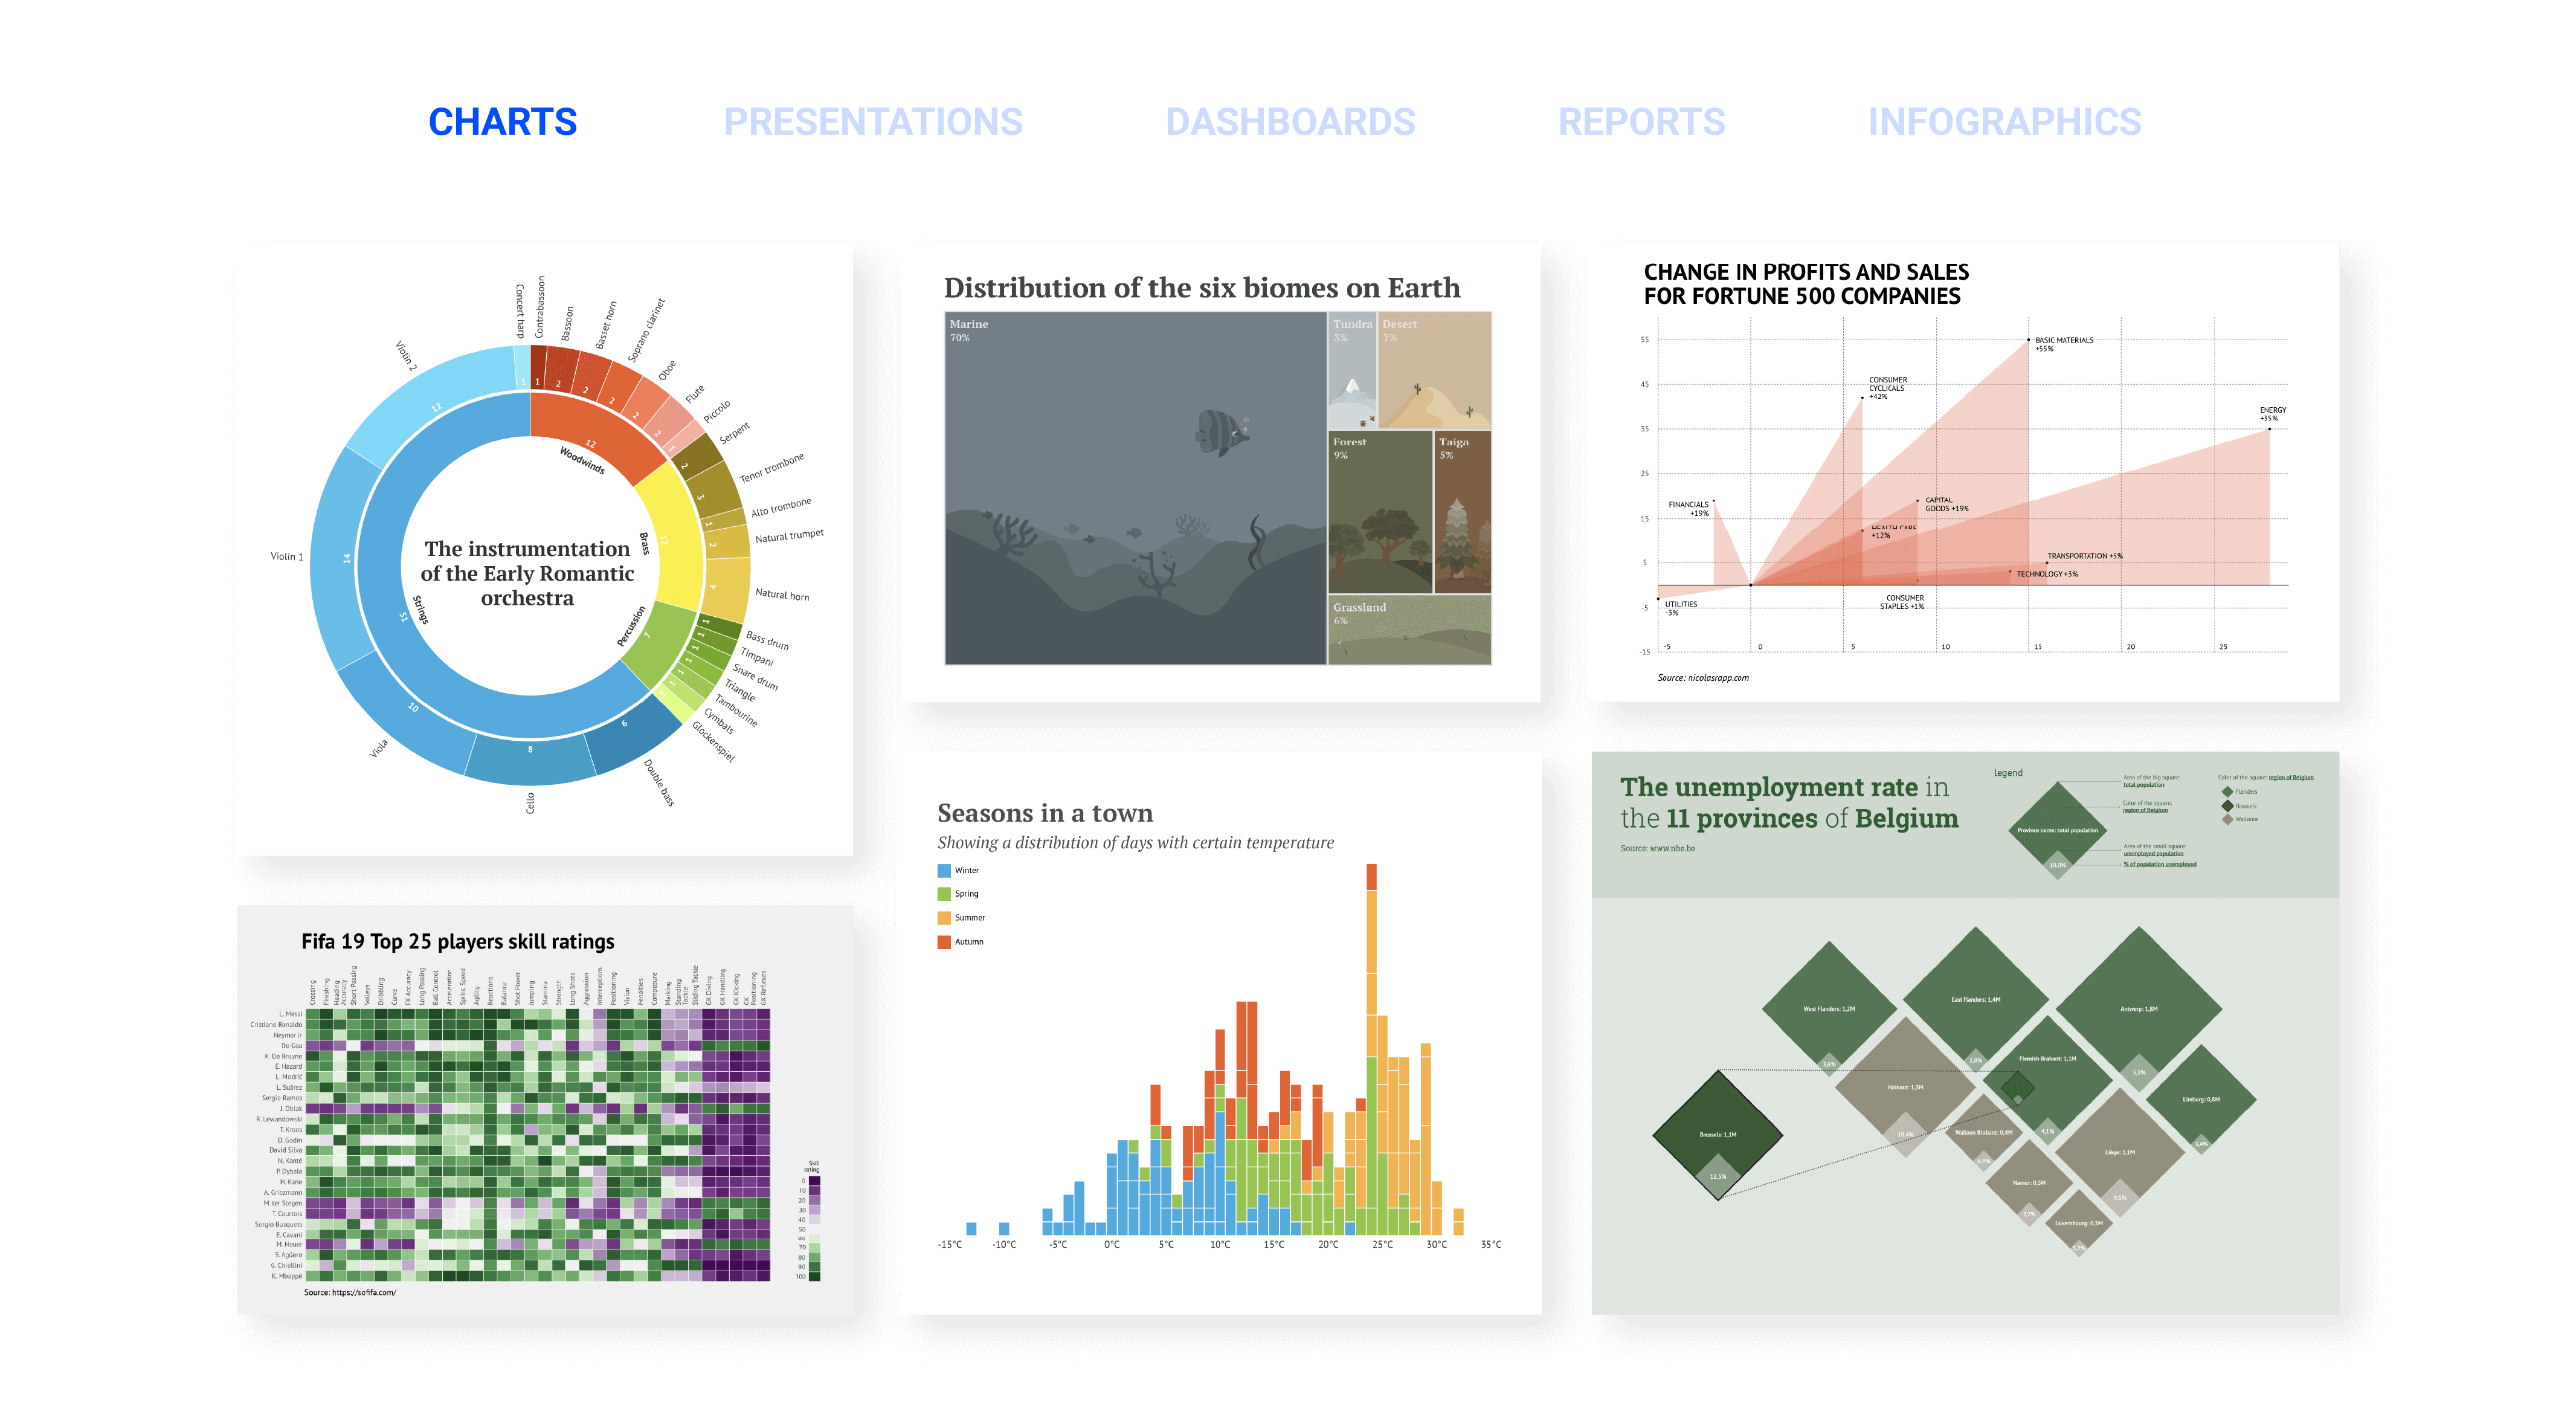
See automated reporting examples

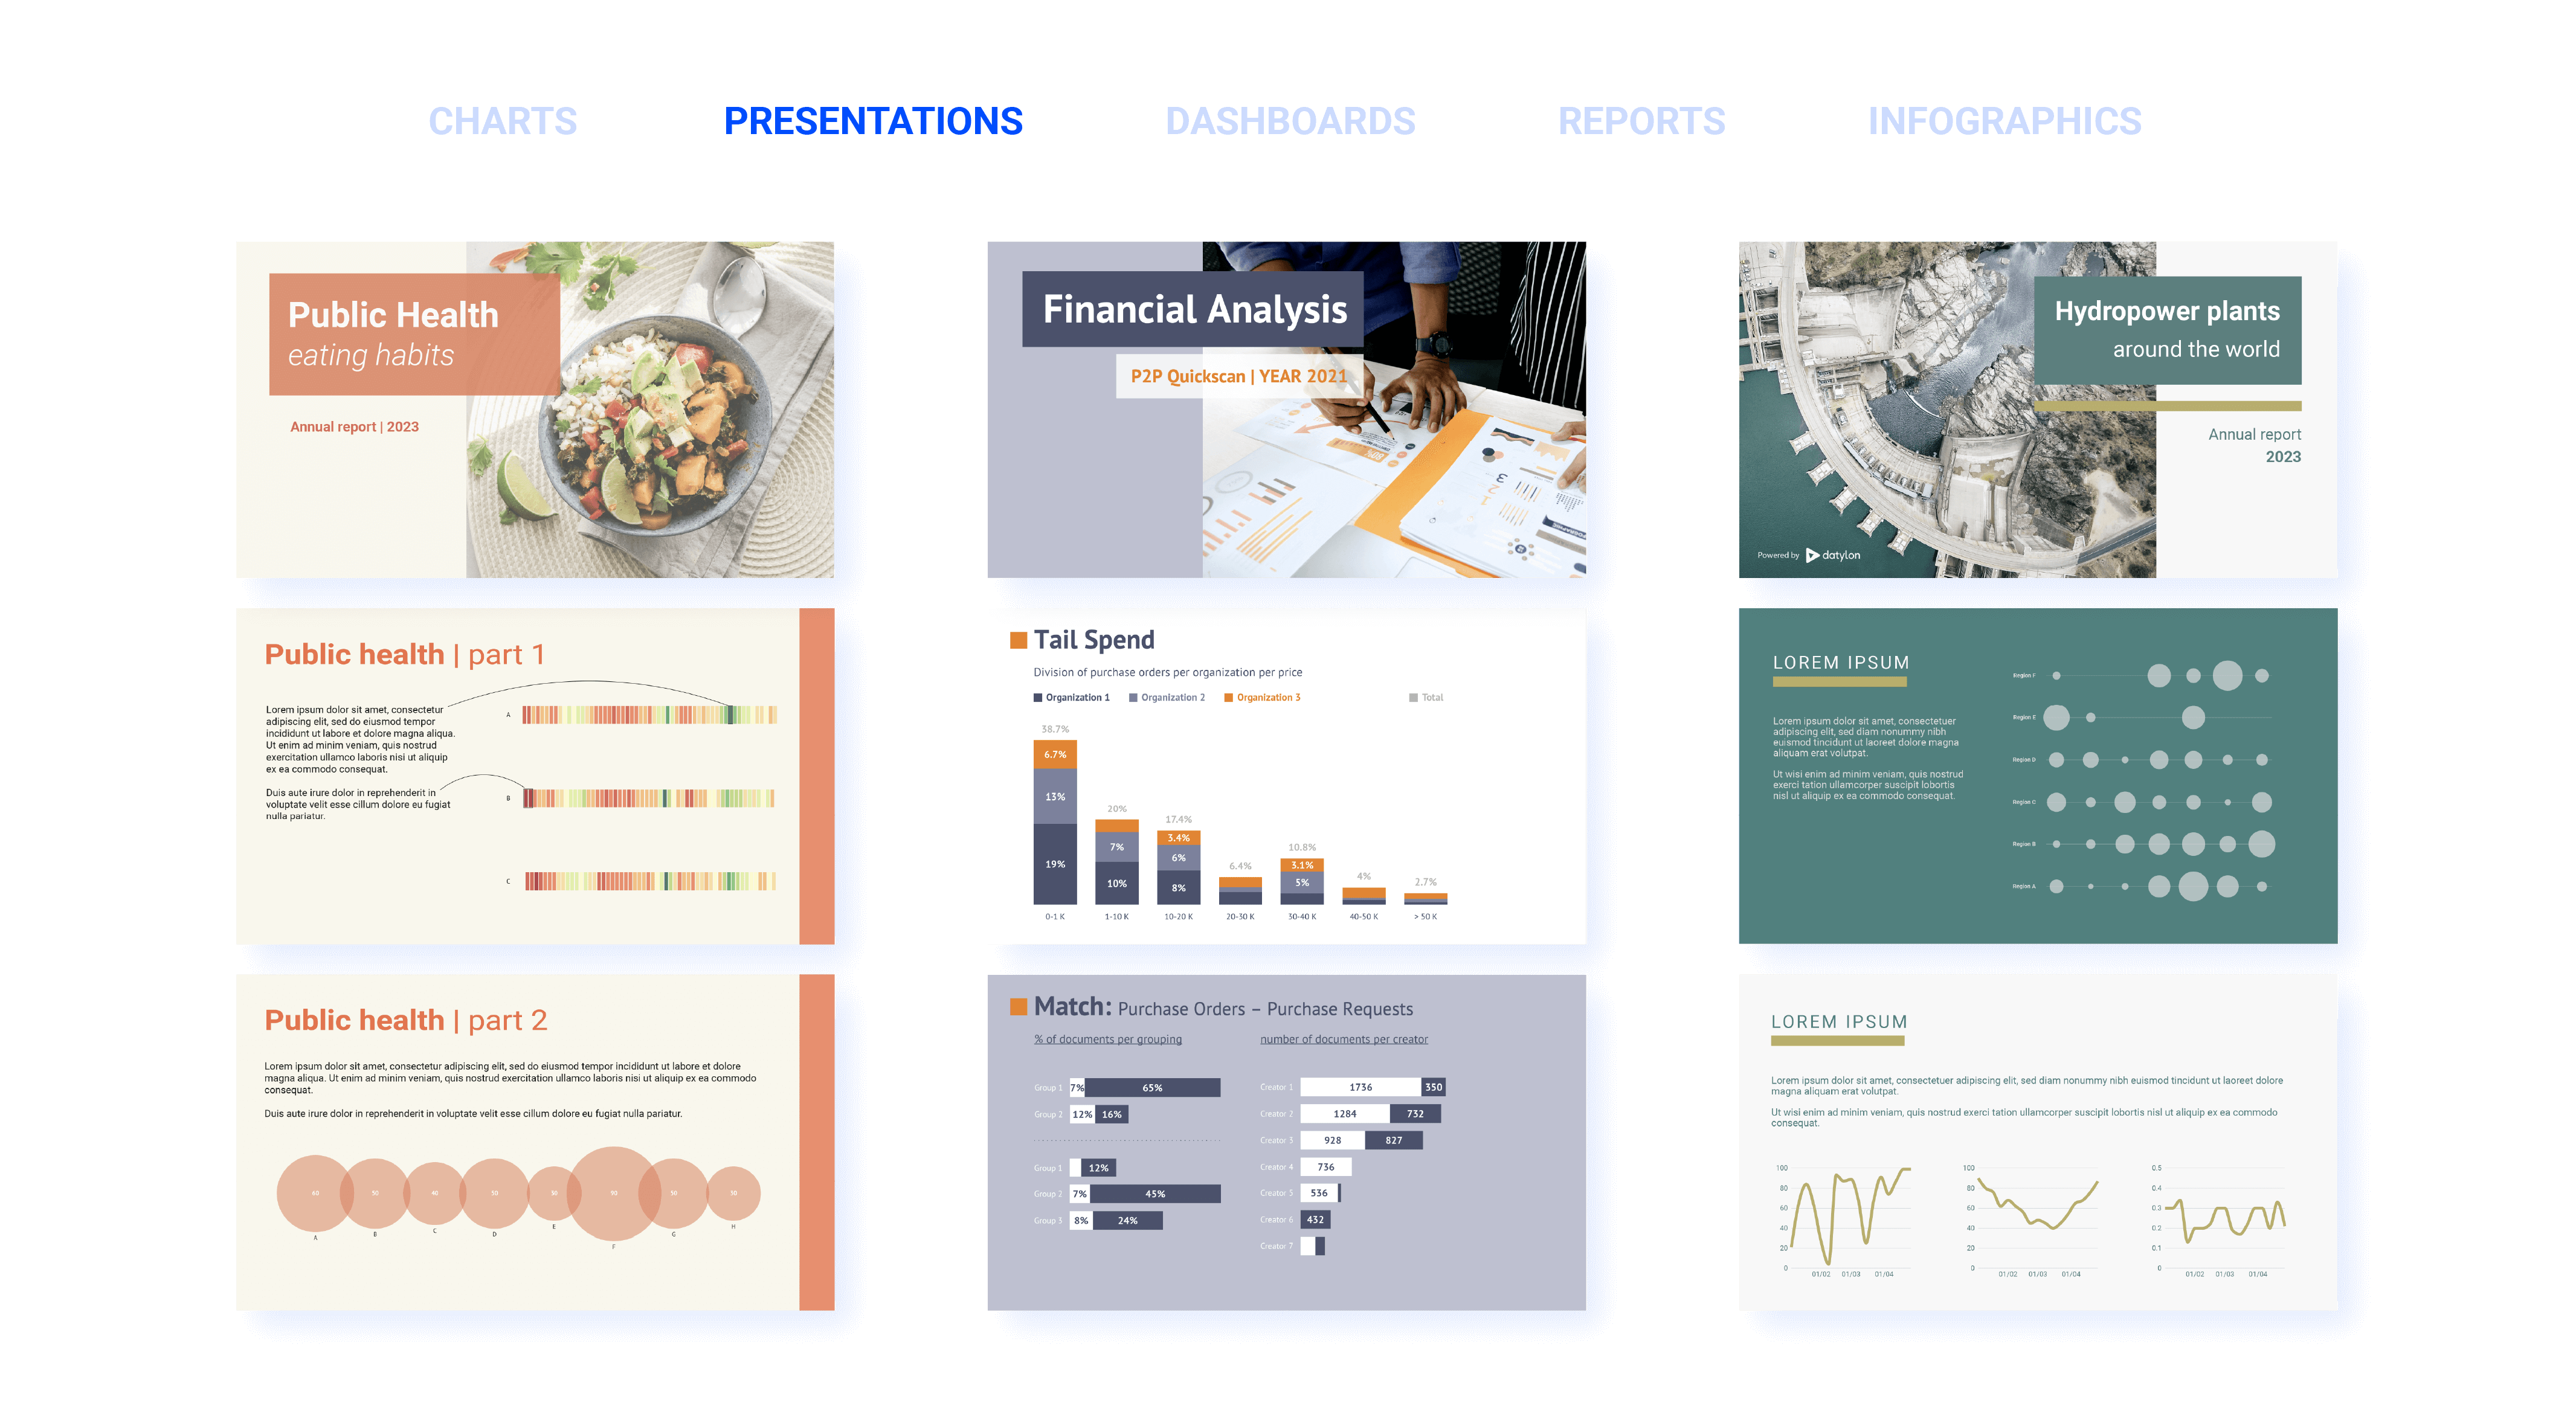
Explore examples of recurring, personalized and multi-page reports created with reusable Datylon templates. View finished outputs and contact Datylon for help designing your reporting workflow.

You're in a good company

Companies and organizations of various industries have already trusted Datylon with their reporting & dataviz needs.
datylon-homepage-industries-icon-government
Government & NGO
datylon-homepage-industries-icon-financial-services
FINANCIAL SERVICES
datylon-homepage-industries-icon-data-and-technology
DATA & TECHNOLOGY
datylon-homepage-industries-icon-marketing
MARKETING AGENCIES
datylon-homepage-industries-icon-media-and-publishing
MEDIA & PUBLISHING
datylon-homepage-industries-icon-research-and-education
RESEARCH & EDUCATION
"For one of our biggest customers, we are using Datylon Reporter Server to generate thousands of dynamic graphs and it works like a charm. The step-up from graph libraries to this product is amazing, thanks to Datylon we can make custom graphs reusable for our customers."

Steven Heijtel, Aubergine IT

Frequently asked questions about automated reporting with Datylon

Find answers about Datylon's reporting workflows, template creation, integrations, recurring reports and implementation support. For product-specific documentation, visit the Help Center.
How does Datylon automated reporting work?

The first step is creating templates using Datylon for the Illustrator plugin. It provides the all power of Illustrator combined with the extensive chart styling possibilities of Datylon.

The second step is exporting templates to Datylon Report Studio.

The third step is providing data to our Render Server via a custom service or application. 

After everything is set up the Datylon Report Server is ready to generate your report.

How is Datylon different from a BI dashboard?

BI dashboards are primarily designed for interactive data exploration and ongoing monitoring. Datylon focuses on fixed-layout, publication-ready reports where page design, visual consistency, distribution and archiving are important. Many organizations use both approaches for different communication needs.

Which Datylon product powers automated reporting?

Datylon Report Server powers fully automated, server-side report generation. It combines reusable templates created with Datylon for Illustrator with changing data to produce charts, pages or complete reports. For local Excel-based batch generation. Datylon offers ChartRunner.

Can Datylon generate personalized reports in bulk?

Yes. A shared report template can be combined with recipient-specific data to produce personalized report variants for different customers, departments, municipalities or stakeholders. The available scale and automation level depend on the selected workflow.

Can Datylon generate multi-page reports?

Yes. Datylon Report Server is designed for complex reporting workflows that can include multiple charts, pages and datasets. 

Can Datylon help implement the complete workflow?

Yes. Datylon can support workflow design, template creation, integration and report production. The level of support can range from guidance for an internal team to a more fully managed implementation.

Do I need a developer to automate reports with Datylon?

Not for every workflow. ChartRunner supports an Excel-based, no-code approach. Embedded and fully automated server workflows may require data integration or development work. Datylon can help design and implement the appropriate workflow for your team.

Can Datylon design the report templates for us?

Yes. Datylon can help with report structure, visual identity, chart selection, data visualization and production-ready templates.

Can Datylon generate recurring reports without rebuilding the design?

Yes. Once the report template and data workflow are configured, Datylon can reuse them for new reporting periods, datasets or report variants. The design does not need to be recreated for each update.

How should designers, analysts and developers divide the work?

Designers create and maintain the report templates. Analysts or reporting specialists prepare and validate the data. Developers configure automated data delivery where an embedded or server-side workflow is used. Datylon can support any of these roles if internal resources are unavailable.

Can I automate reports form Excel?

Yes. Datylon ChartRunner provides an Excel-based workflow for generating multiple charts or one-page report variations from structured spreadsheet data. It is designed for teams that want local production without building a custom integration.

How does Datylon handle privacy?

Data handling depends on the workflow and deployment selected. Please check our privacy policy to learn more.