
Dataviz Resources
Do you speak data?
Are you interested in telling data stories with data visualizations? But your data language can...
DataViz Best Practices
A deep dive into... scatter plots
When I think about scatter plots, my mind takes me back to the years when I studied and worked as...
Subscribe to our newsletter
Receive inspiration, practical advice, customer stories and news right in your mailbox

DataViz Best Practices
Master the rules - then break them
Rules are everywhere. In modern society, you can not go anywhere without rules to follow. Imagine...
DataViz Best Practices
A guide to effective data visualization
The total amount of data in the world is increasing extremely fast. It is forecasted that the...
Dataviz Resources, Chart Design
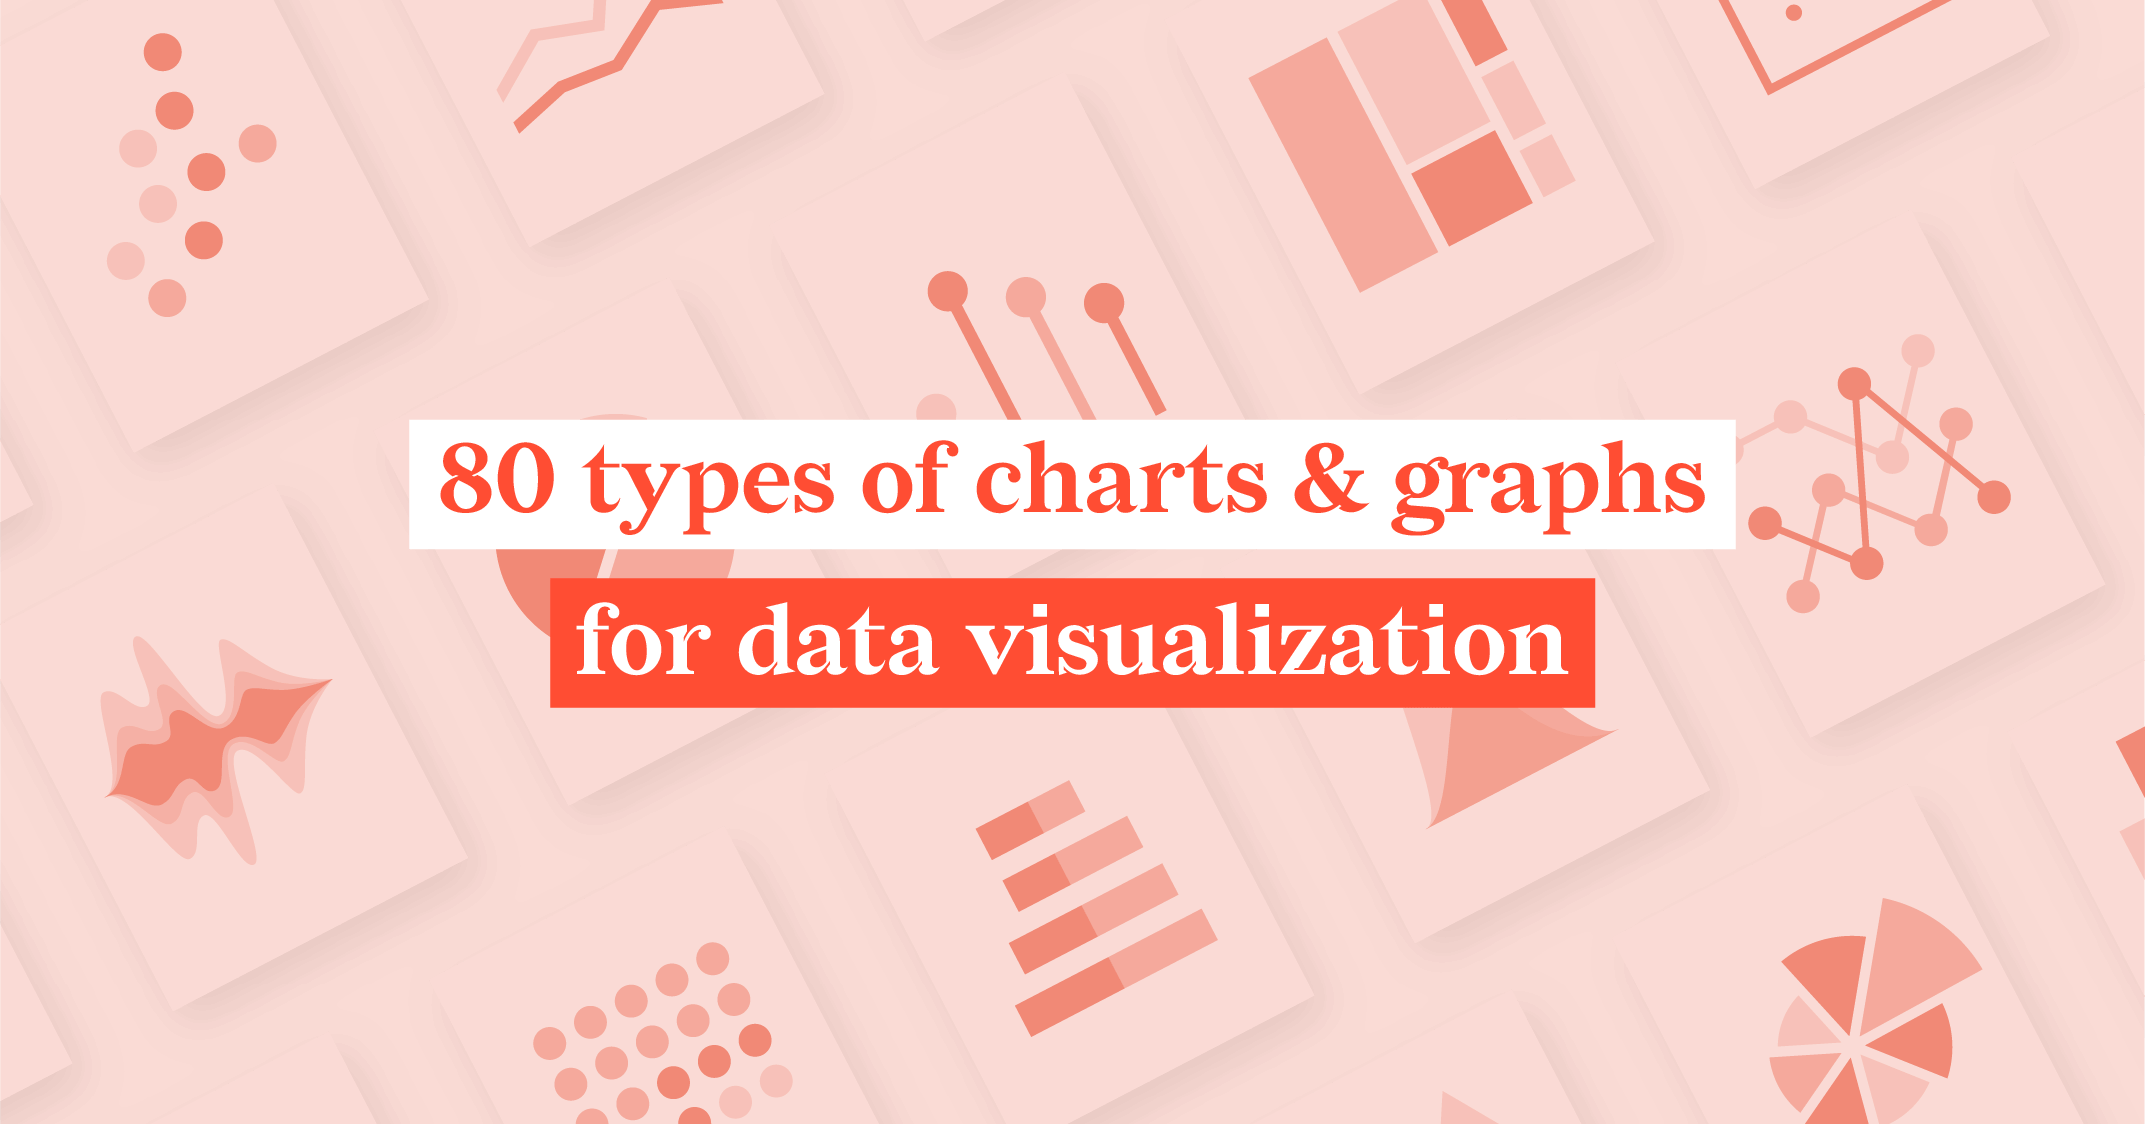
80 types of charts & graphs for data visualization (with examples)
In this article we'll talk about different types of charts and graphs. They are sorted into six...
Dataviz Resources
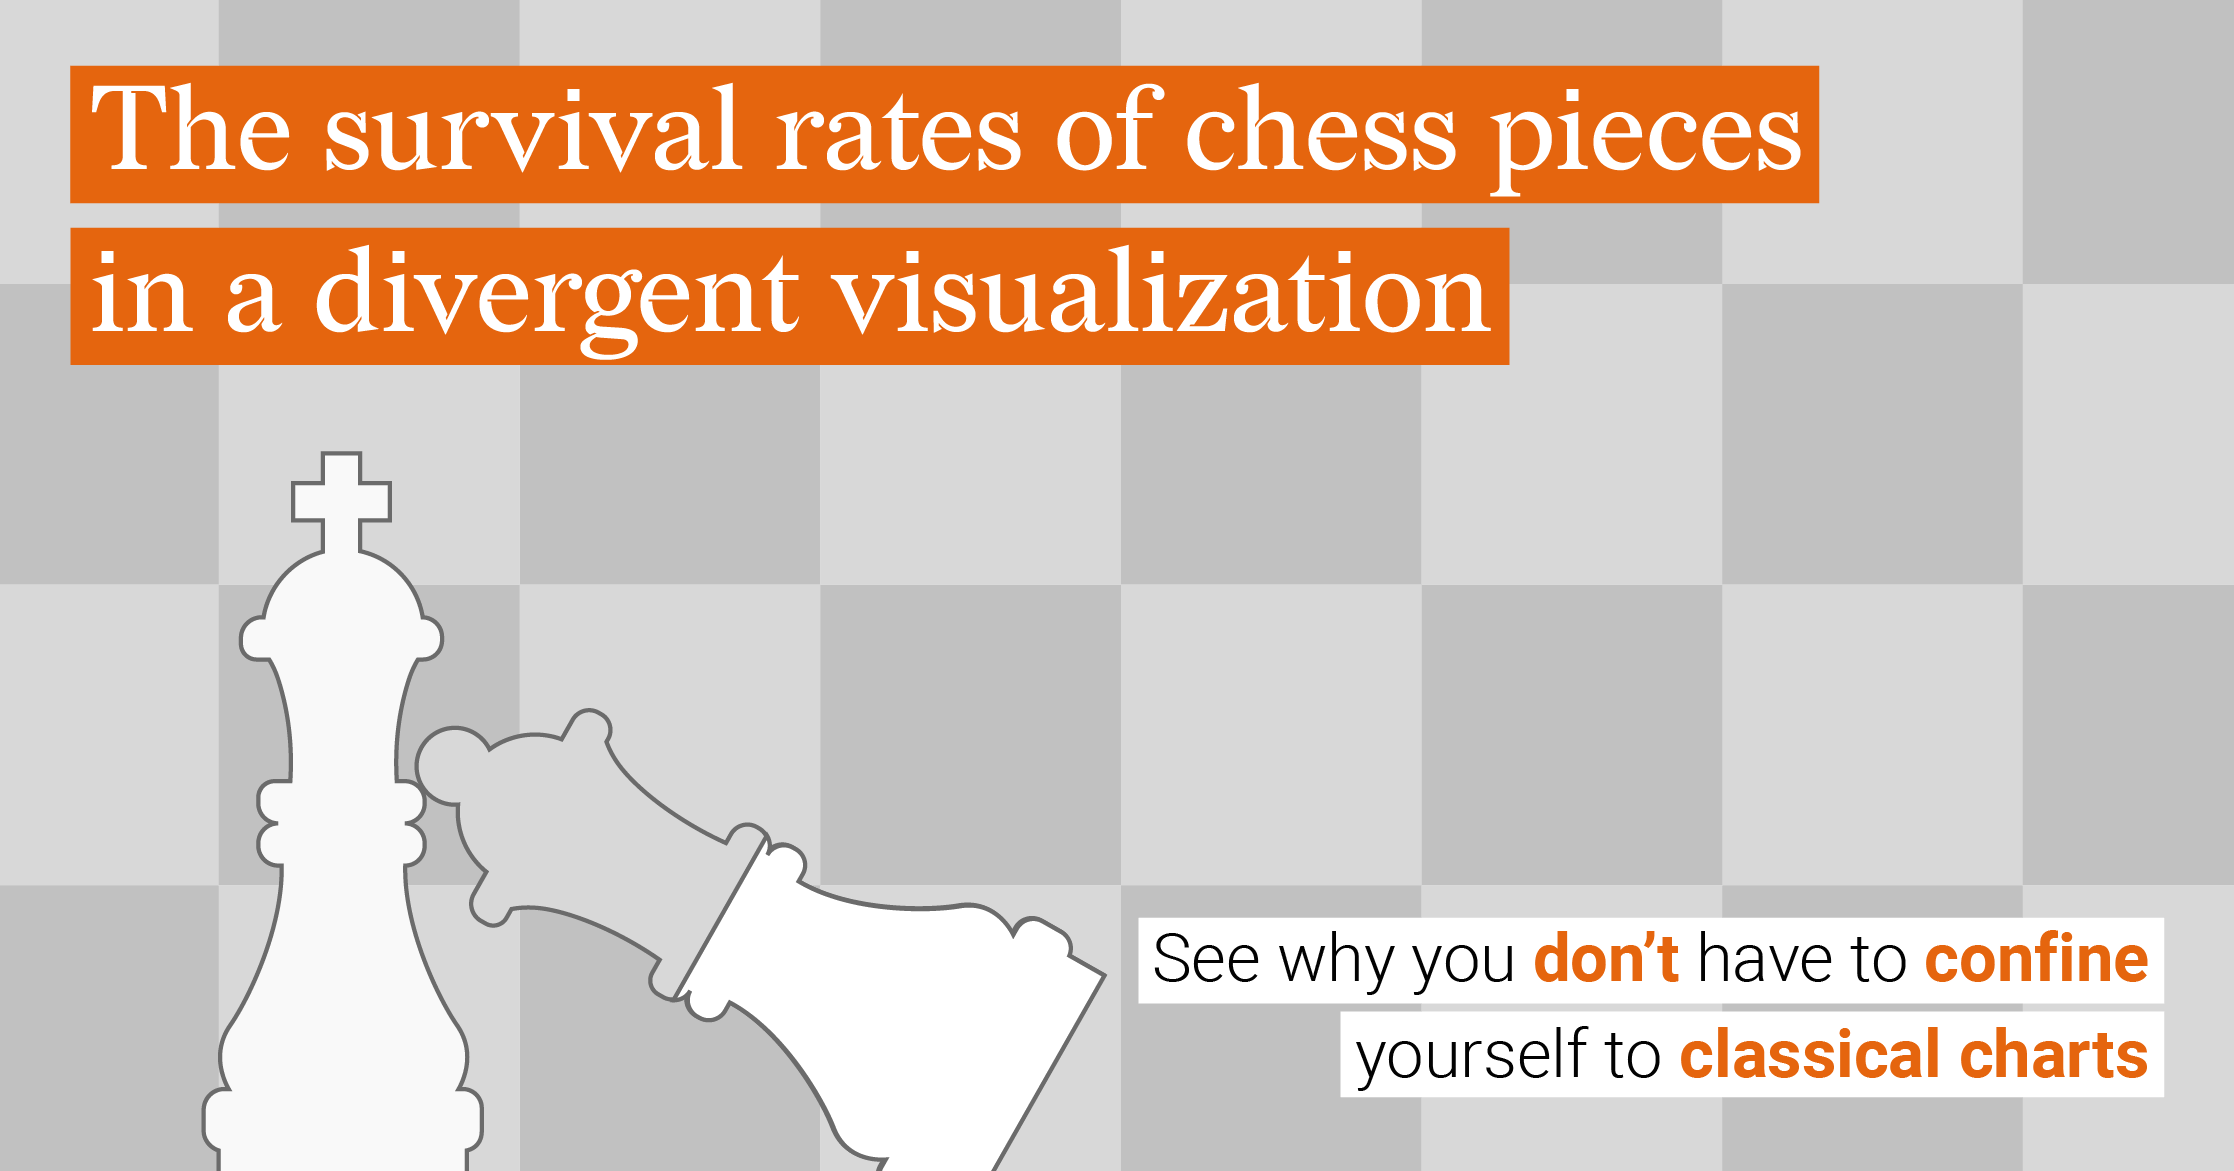
The survival rates of chess pieces in a divergent visualization
Recently I wrote a ‘deep dive’ blog post about bar charts. The bar chart is used often because of...
DataViz Best Practices
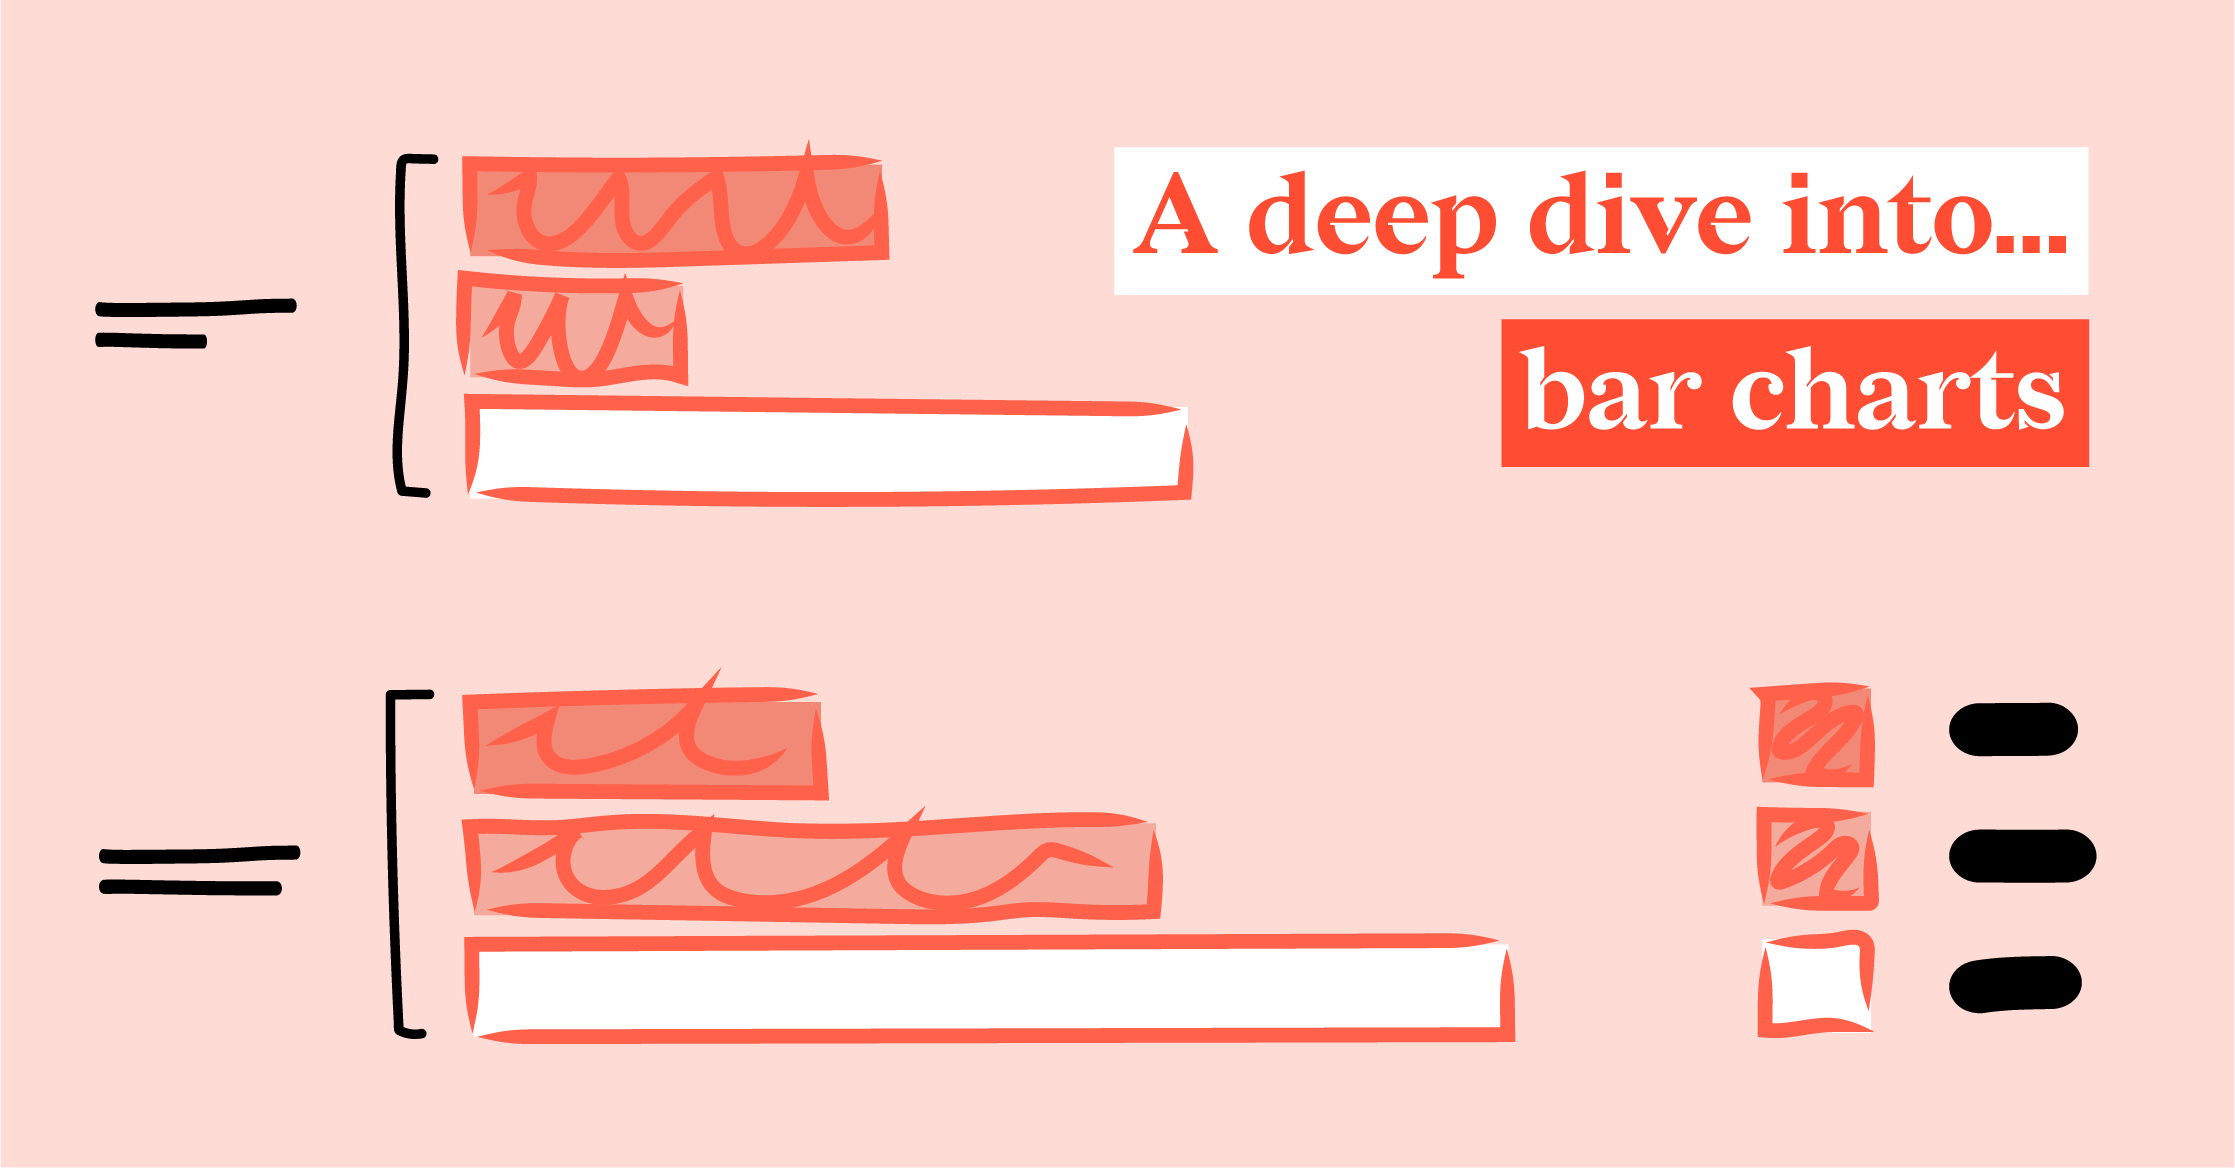
A deep dive into... bar charts
Bar charts and pencils: what do they have in common? When writing this blog, I really don’t know...
Dataviz Resources
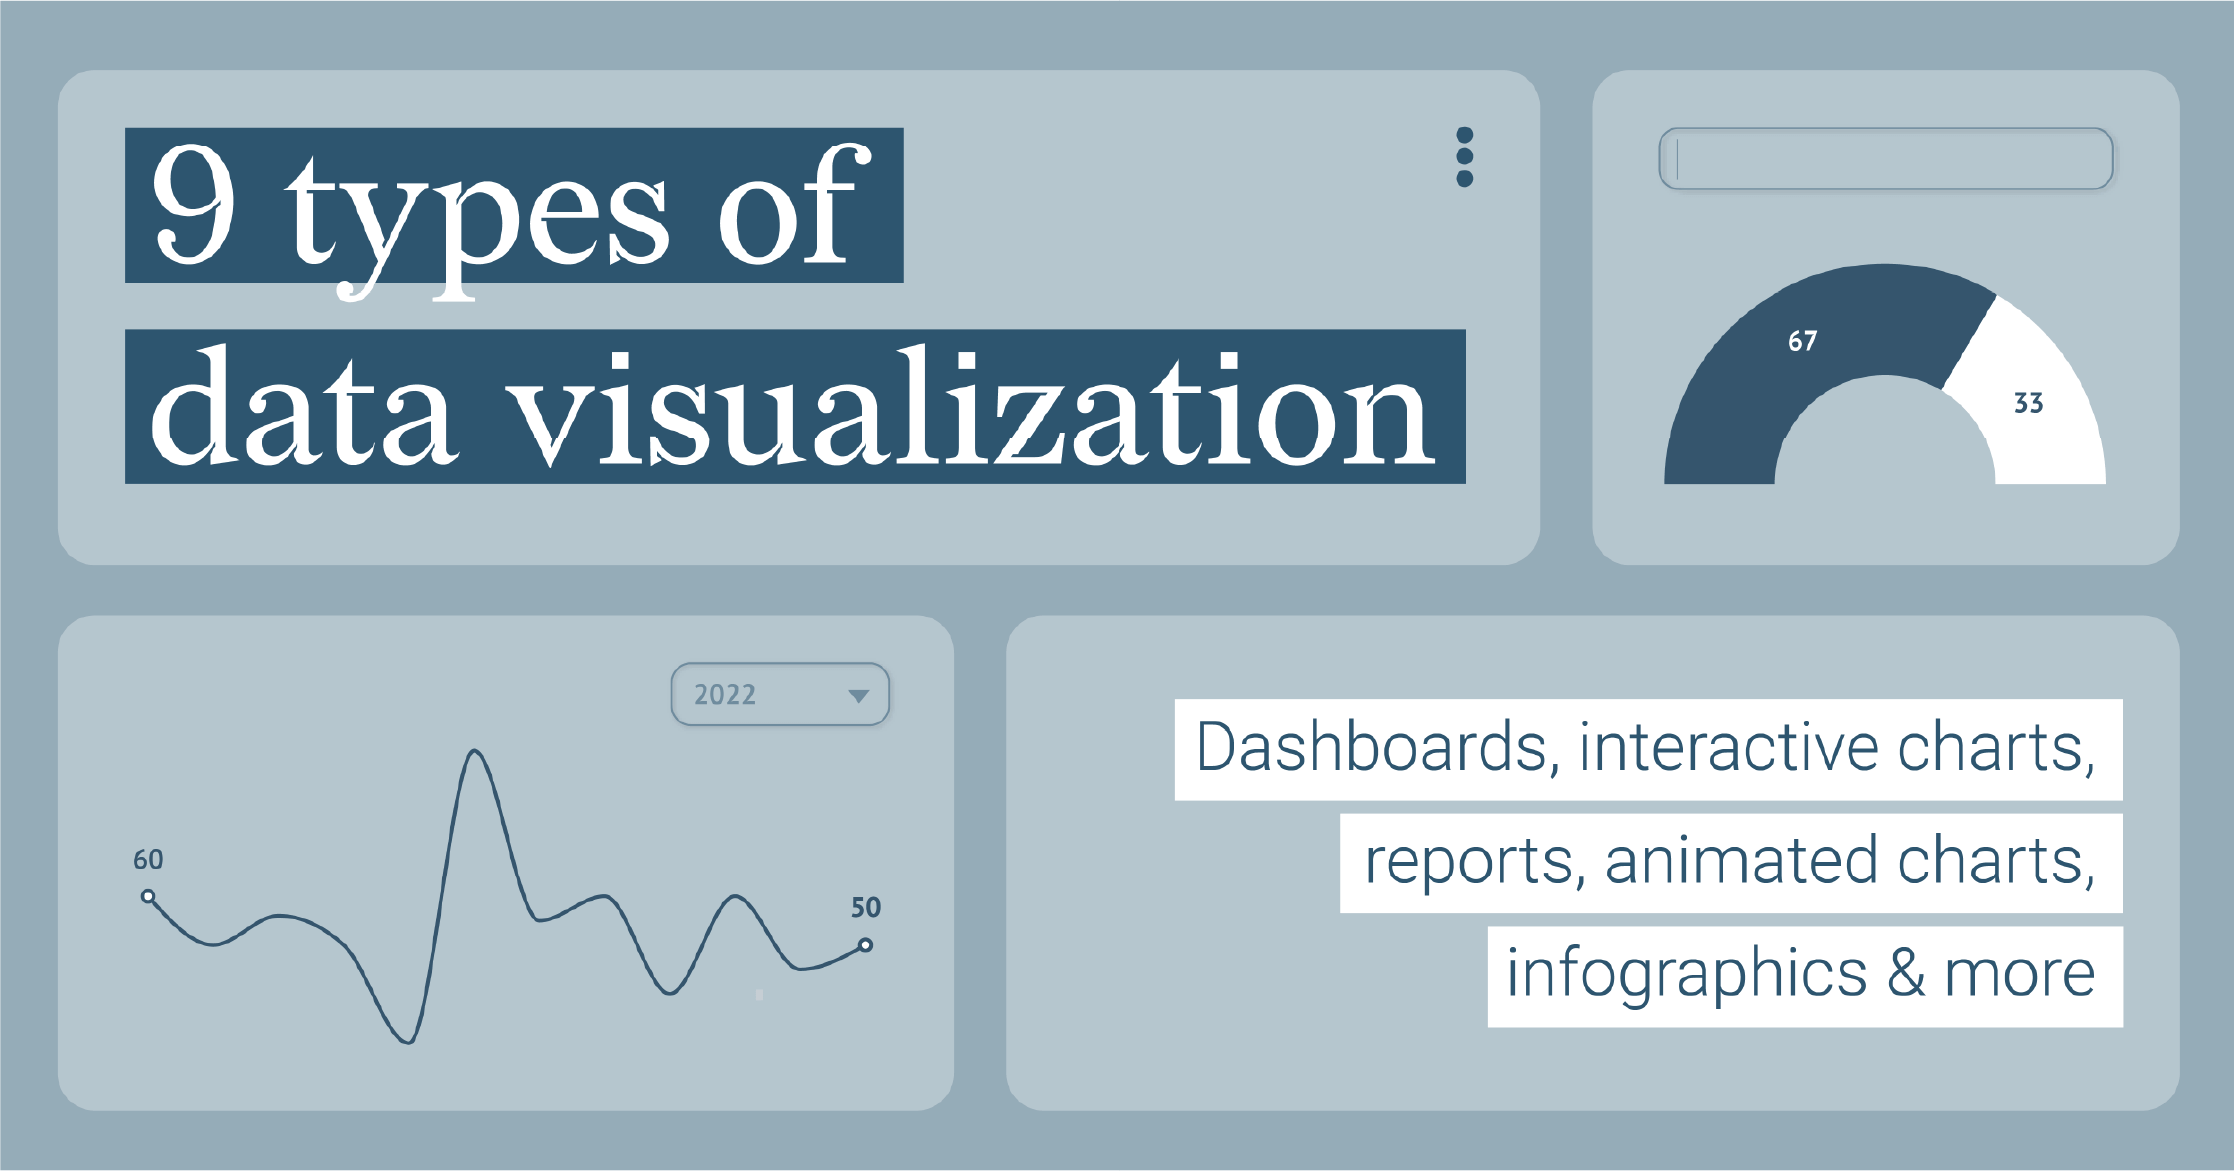
9 types of data visualization
When somebody asks me about my profession and I tell them that I’m a data visualization designer,...
DataViz Best Practices
Mind your data visualization
If I am to believe my mom, I was already pasting stickers next to each other in a neat pattern...
DataViz Best Practices
A deep dive into... treemaps
“Your disk is almost full. Save space by optimizing storage”. Does this sound familiar? Well, for...