
Dataviz Resources
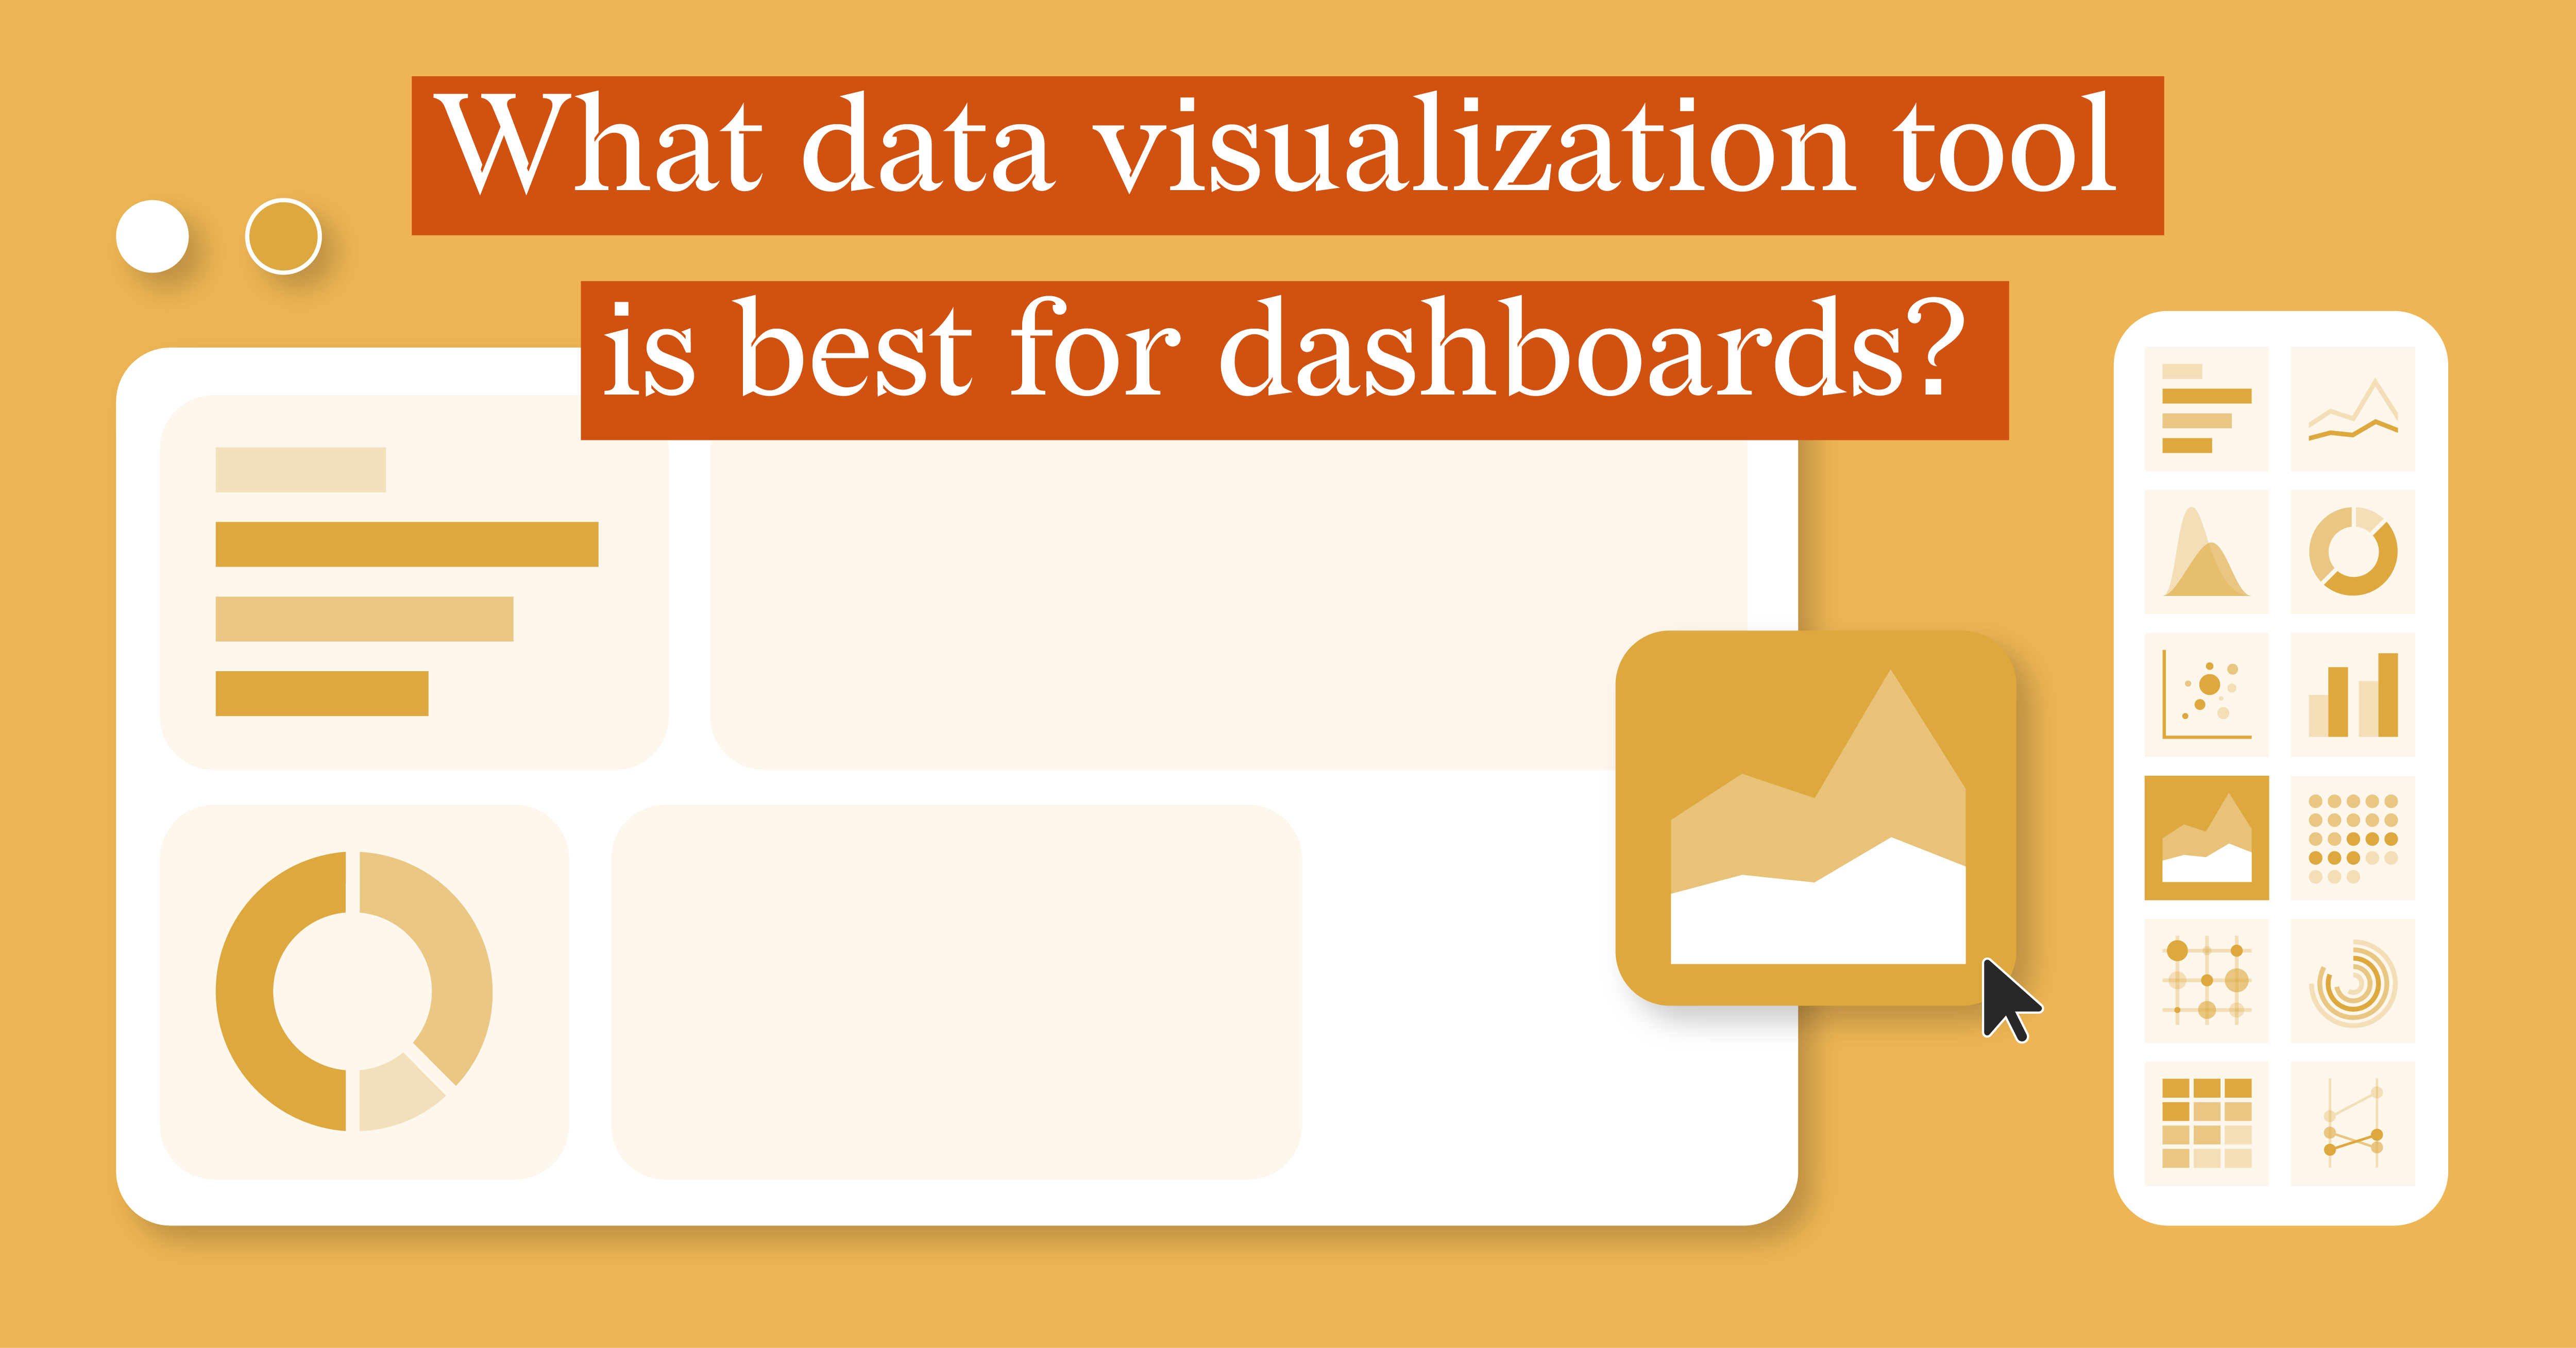
Which Data Visualization Tool Is Best For Dashboards?
Are you dealing with mountains of data but struggling to make sense of it? Spreadsheets and tables...
Report Design, Report Server, Reporting, Automated Reporting
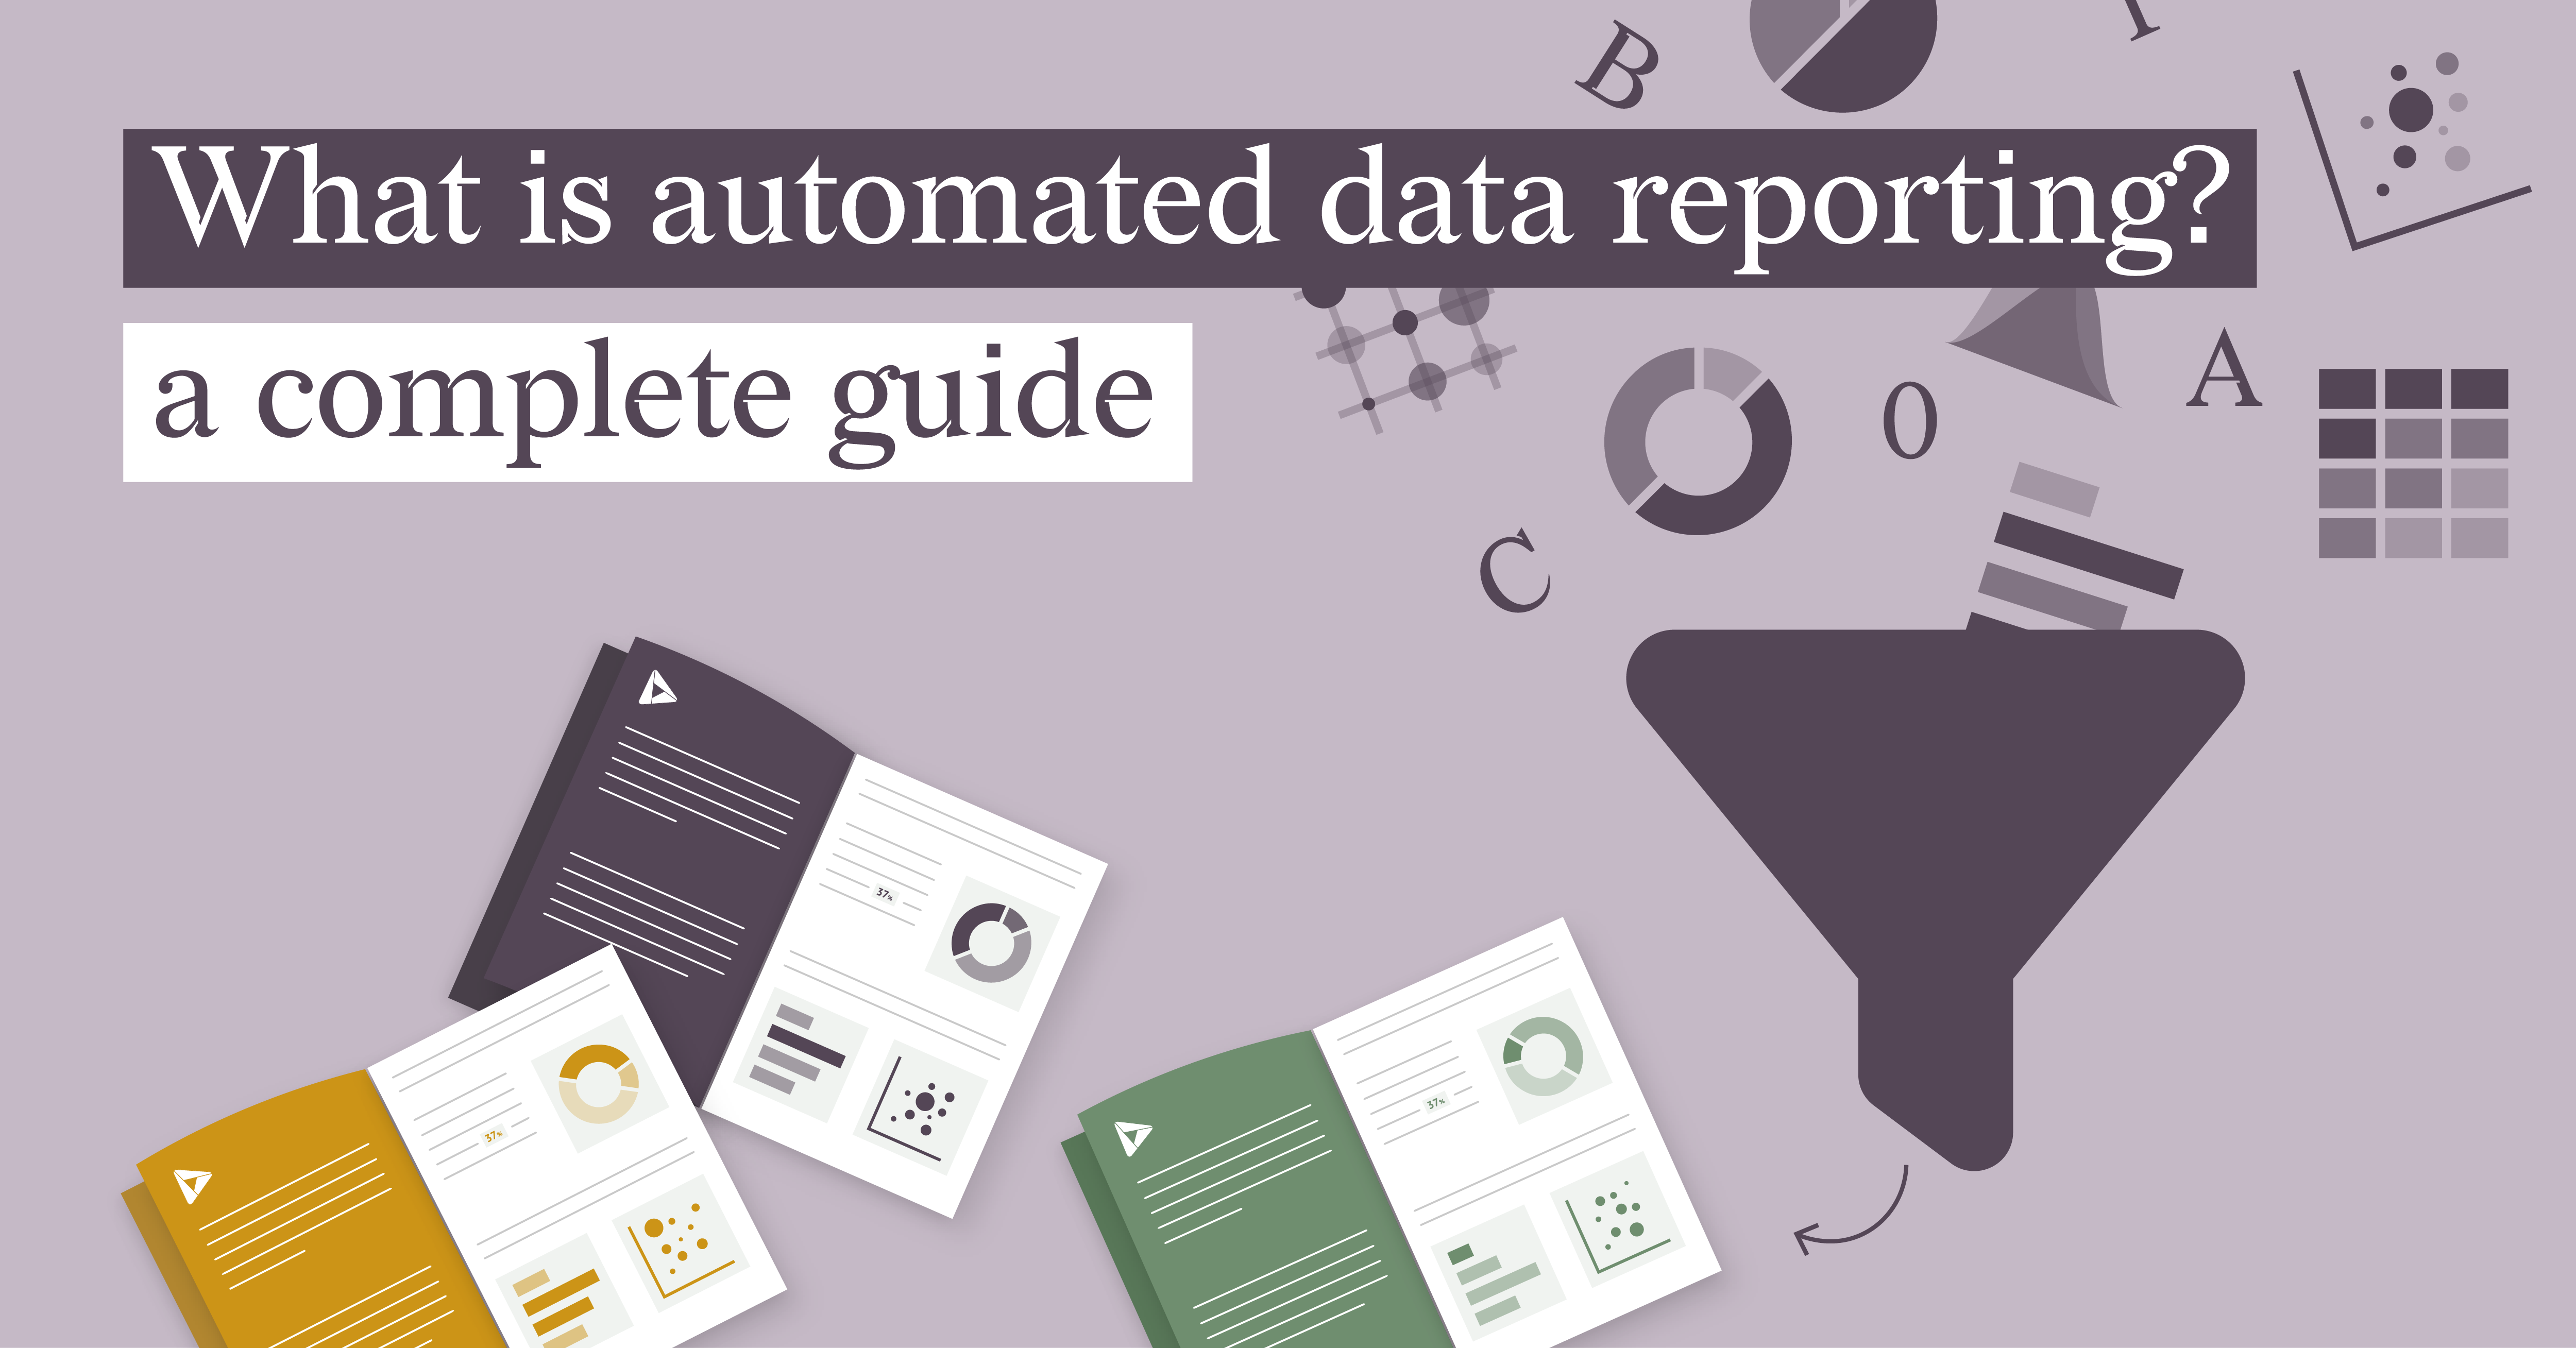
What is automated data reporting? A complete guide
Reporting doesn’t have to be a headache. Still, for many teams, it often is. Data gets pulled from...
Subscribe to our newsletter
Receive inspiration, practical advice, customer stories and news right in your mailbox

DataViz Best Practices, Dataviz Resources, Healthcare
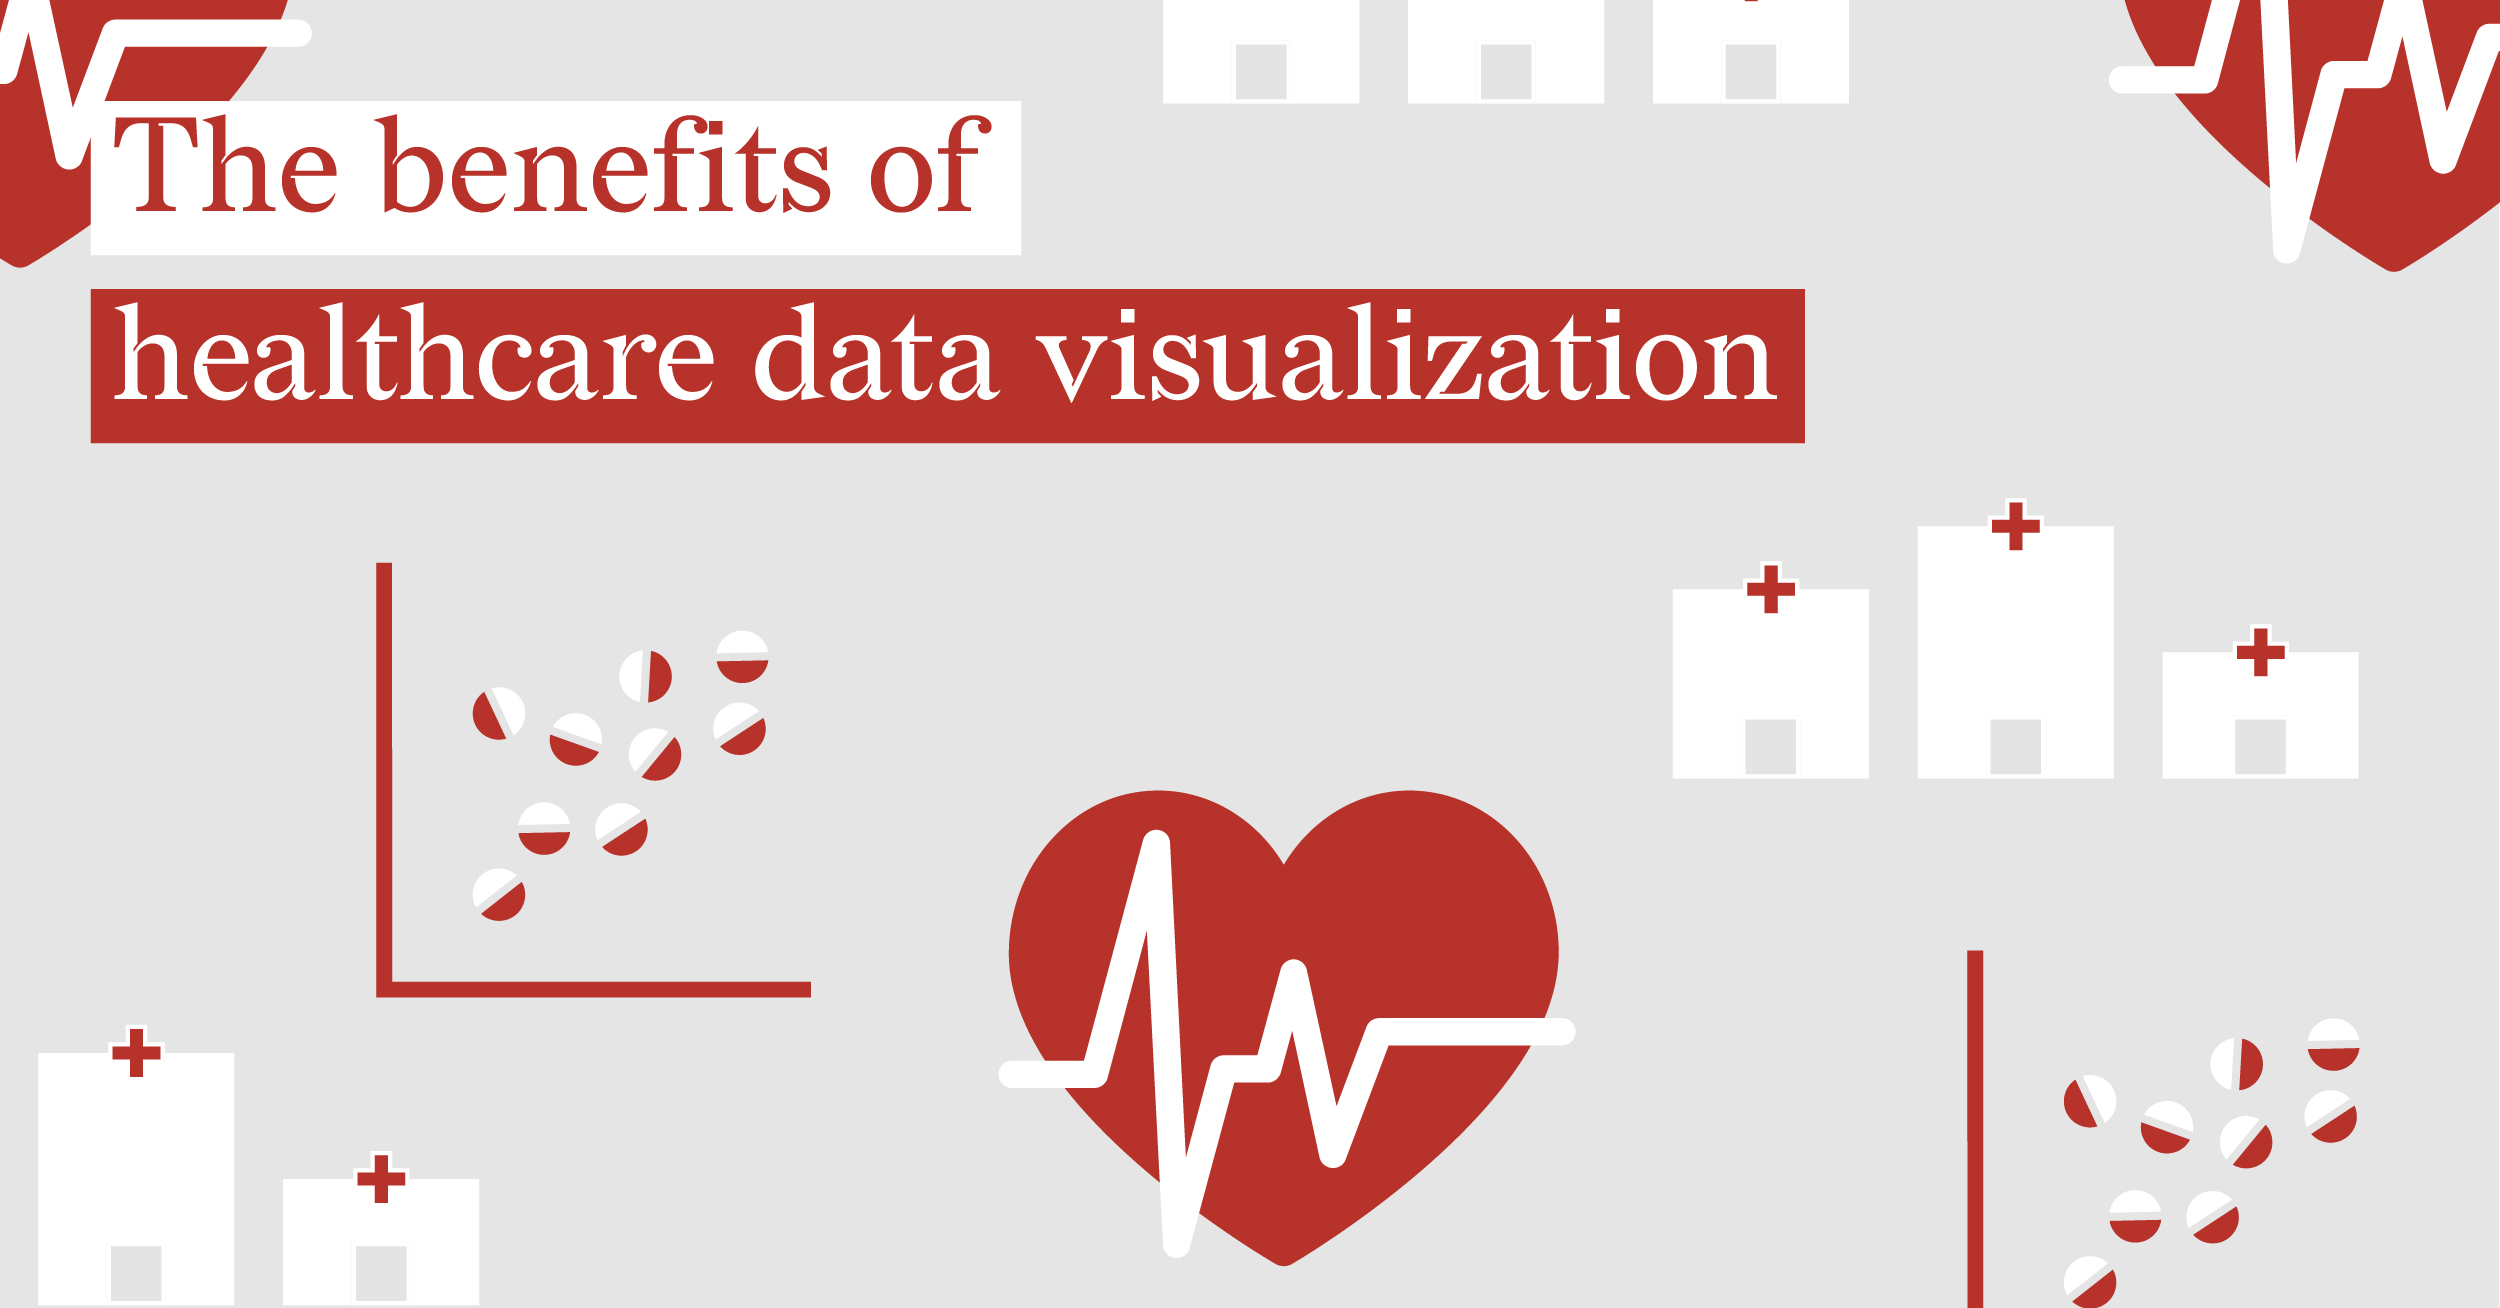
The Benefits Of Healthcare Data Visualization
When questioned about my profession, my response is that I work as a data visualization designer....
DataViz Best Practices
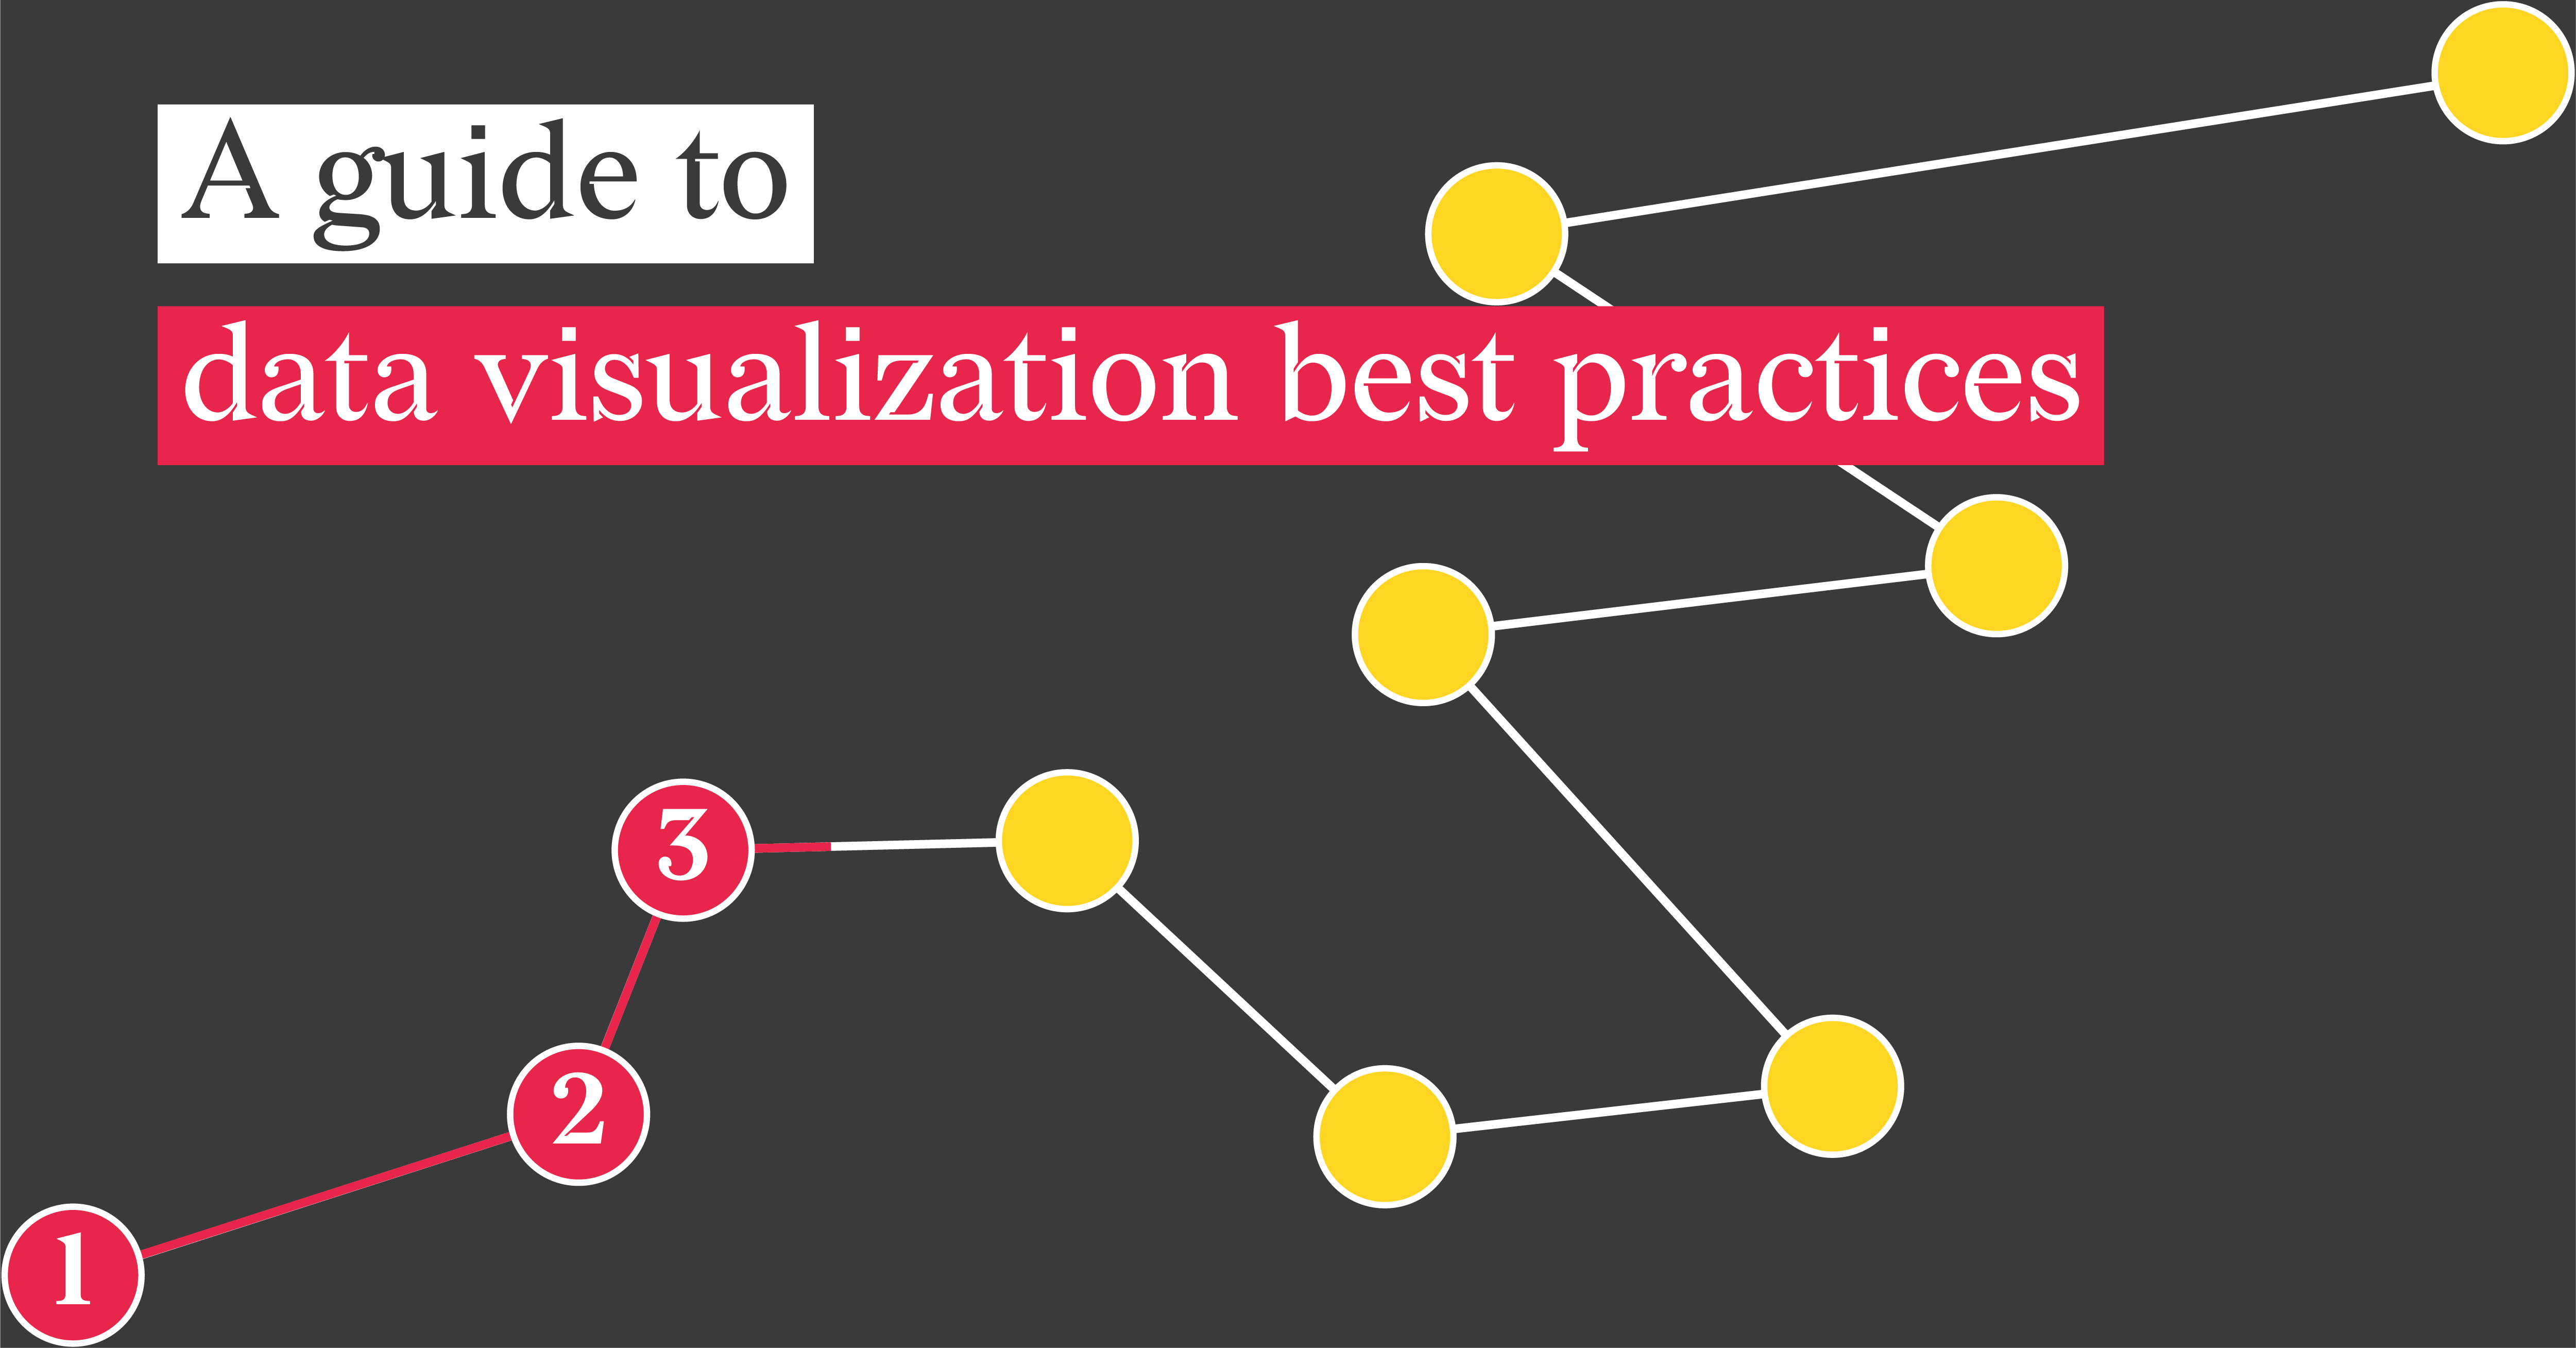
A Guide to Data Visualization Best Practices
You have done the hard work of gathering the data. But let’s be honest: staring at a giant...
DataViz Best Practices
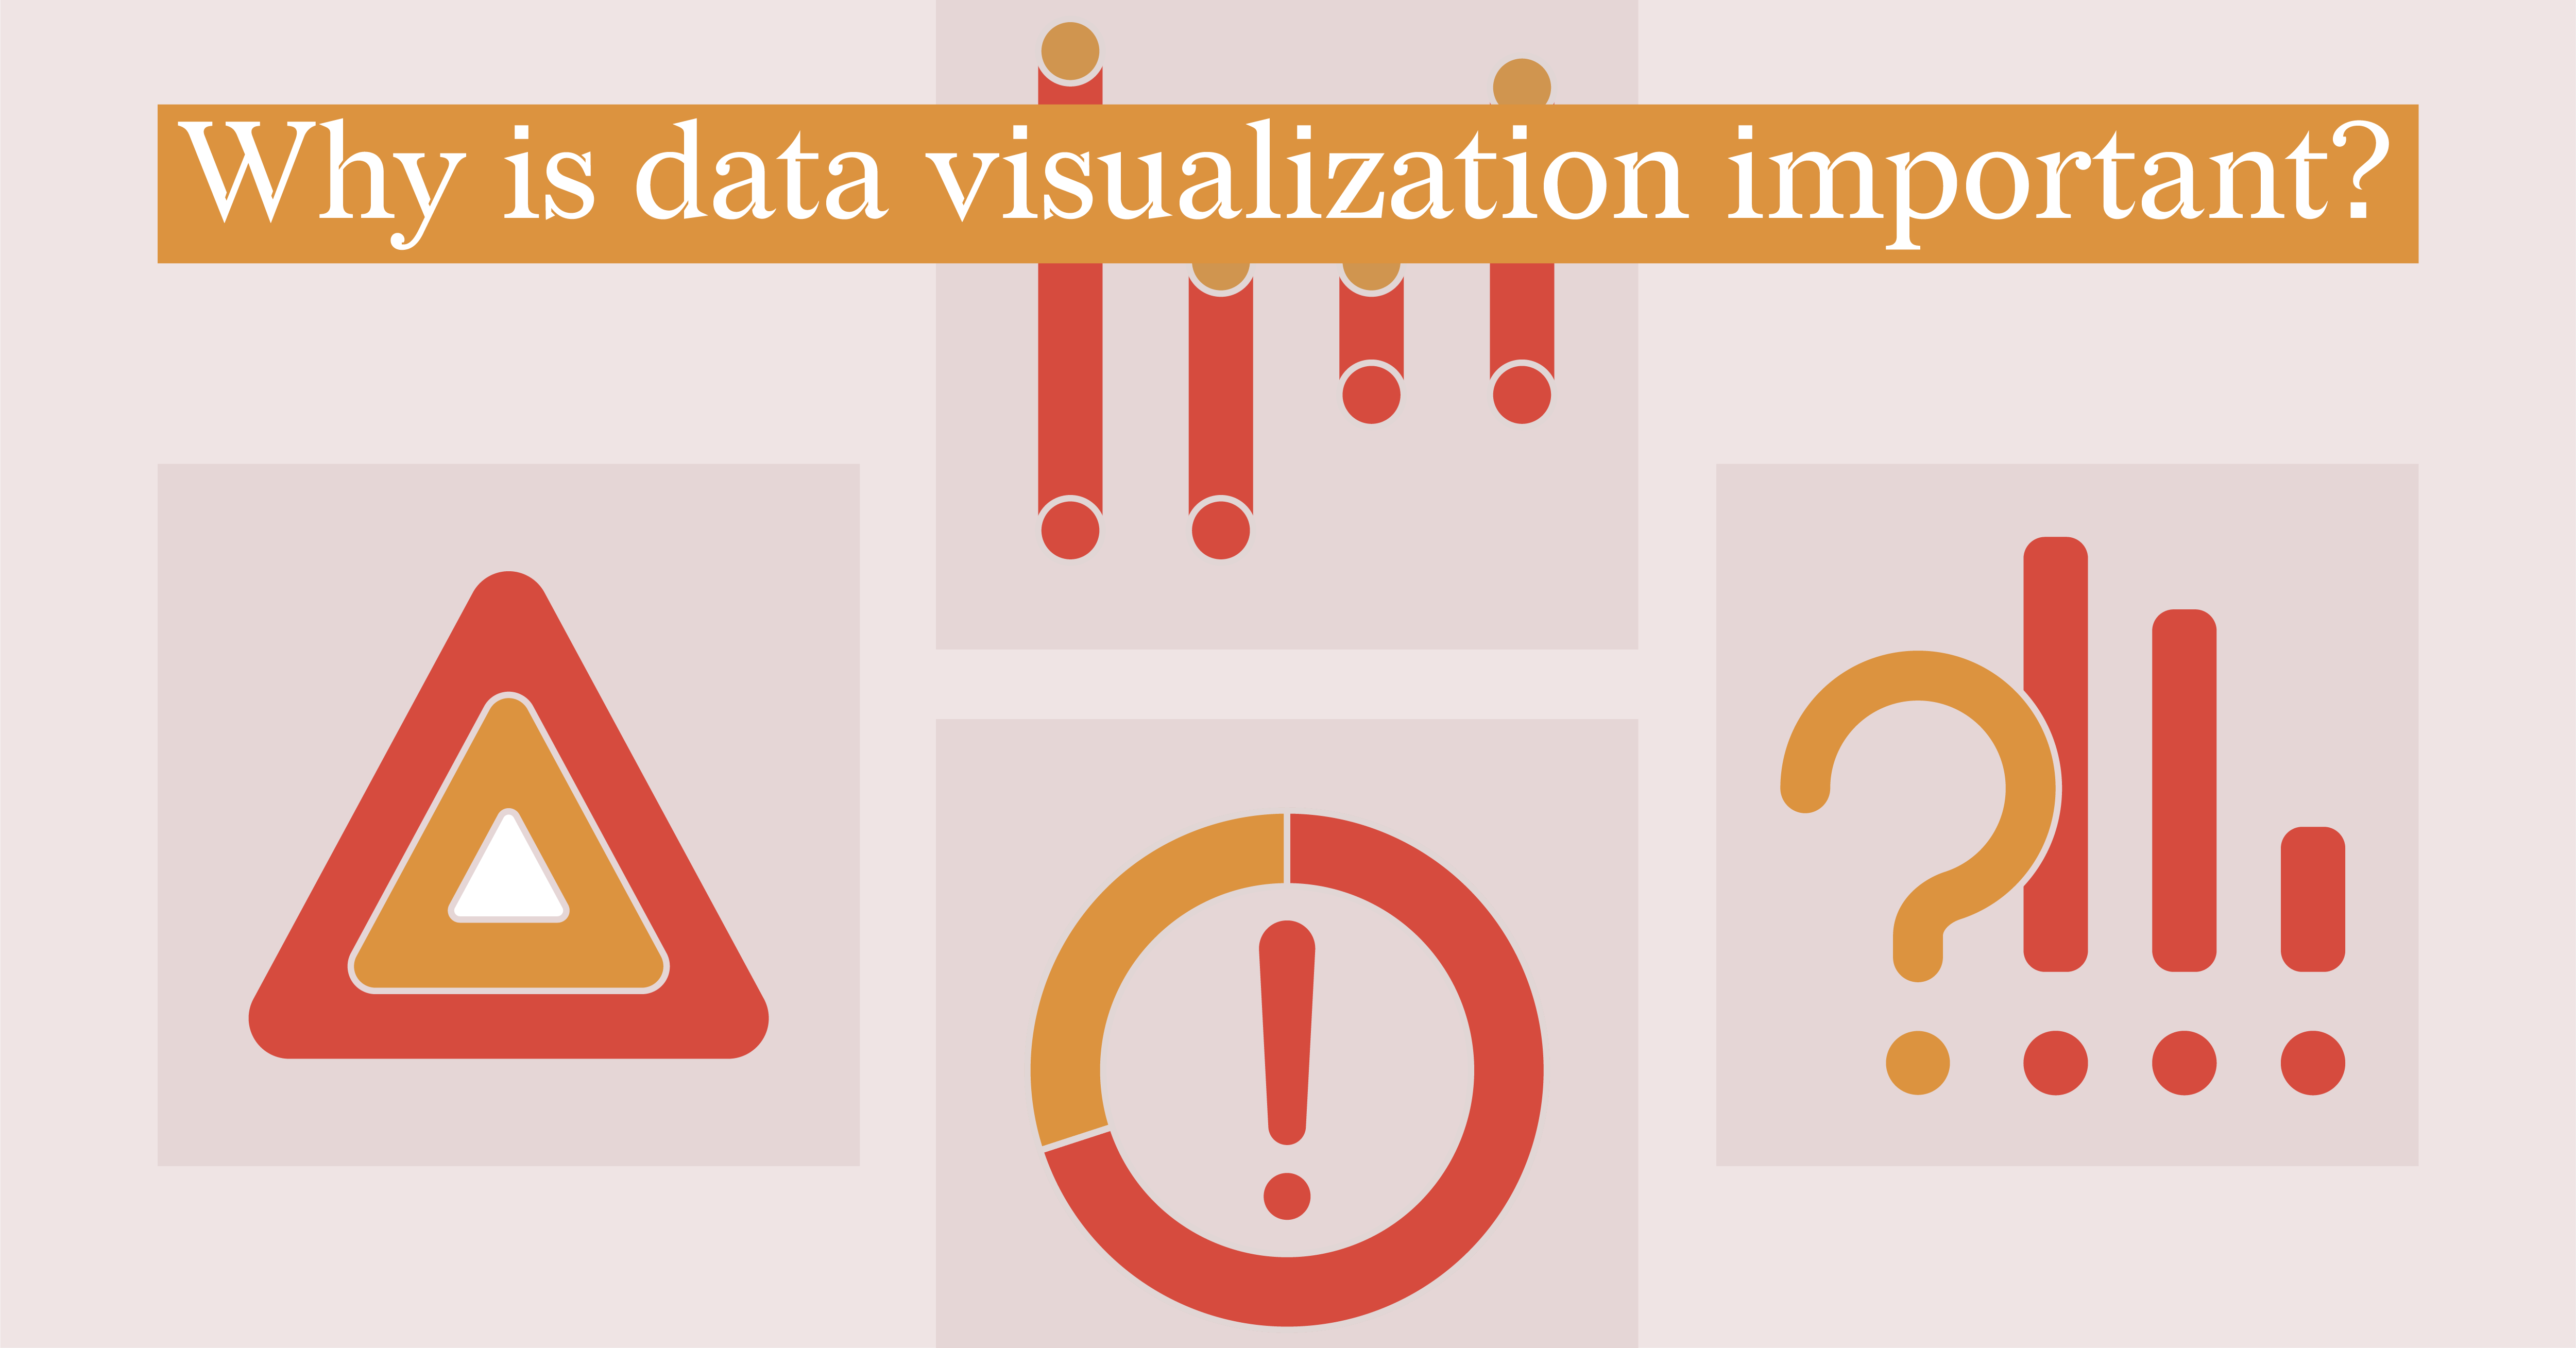
Why Is Data Visualization Important?
We live in a world overflowing with data. From business dashboards to social media metrics,...
Technical, Report Server, Reporting
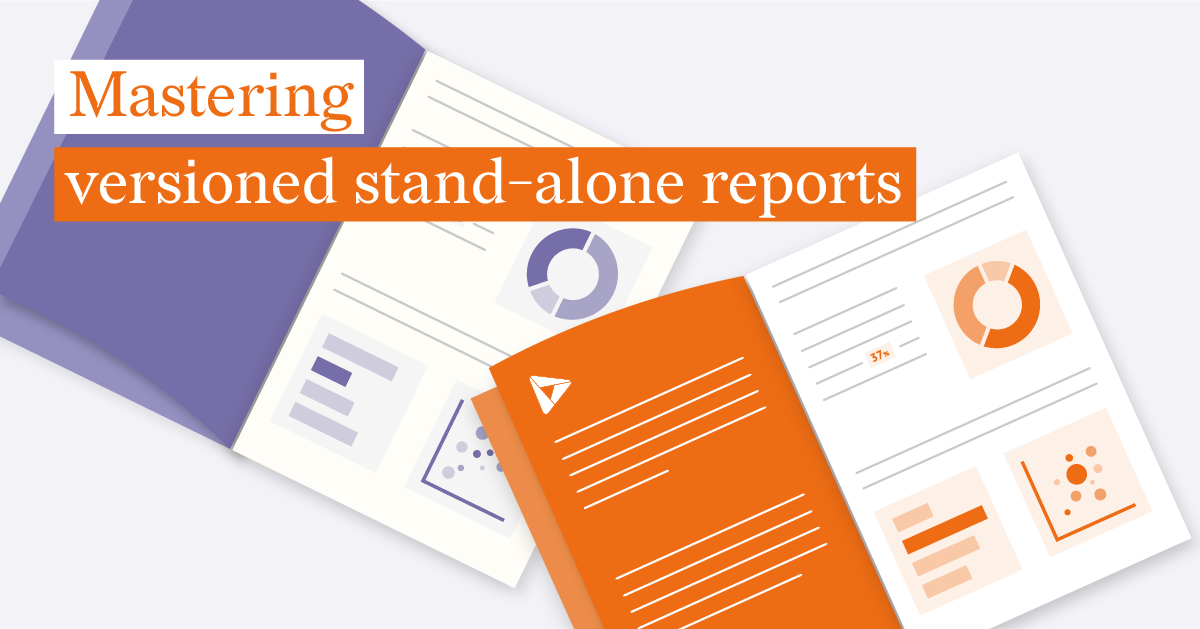
Mastering Versioned Stand-Alone Reports
In the world of data reporting, versioned stand-alone reports occupy a special niche. They are a...
Food For Thought
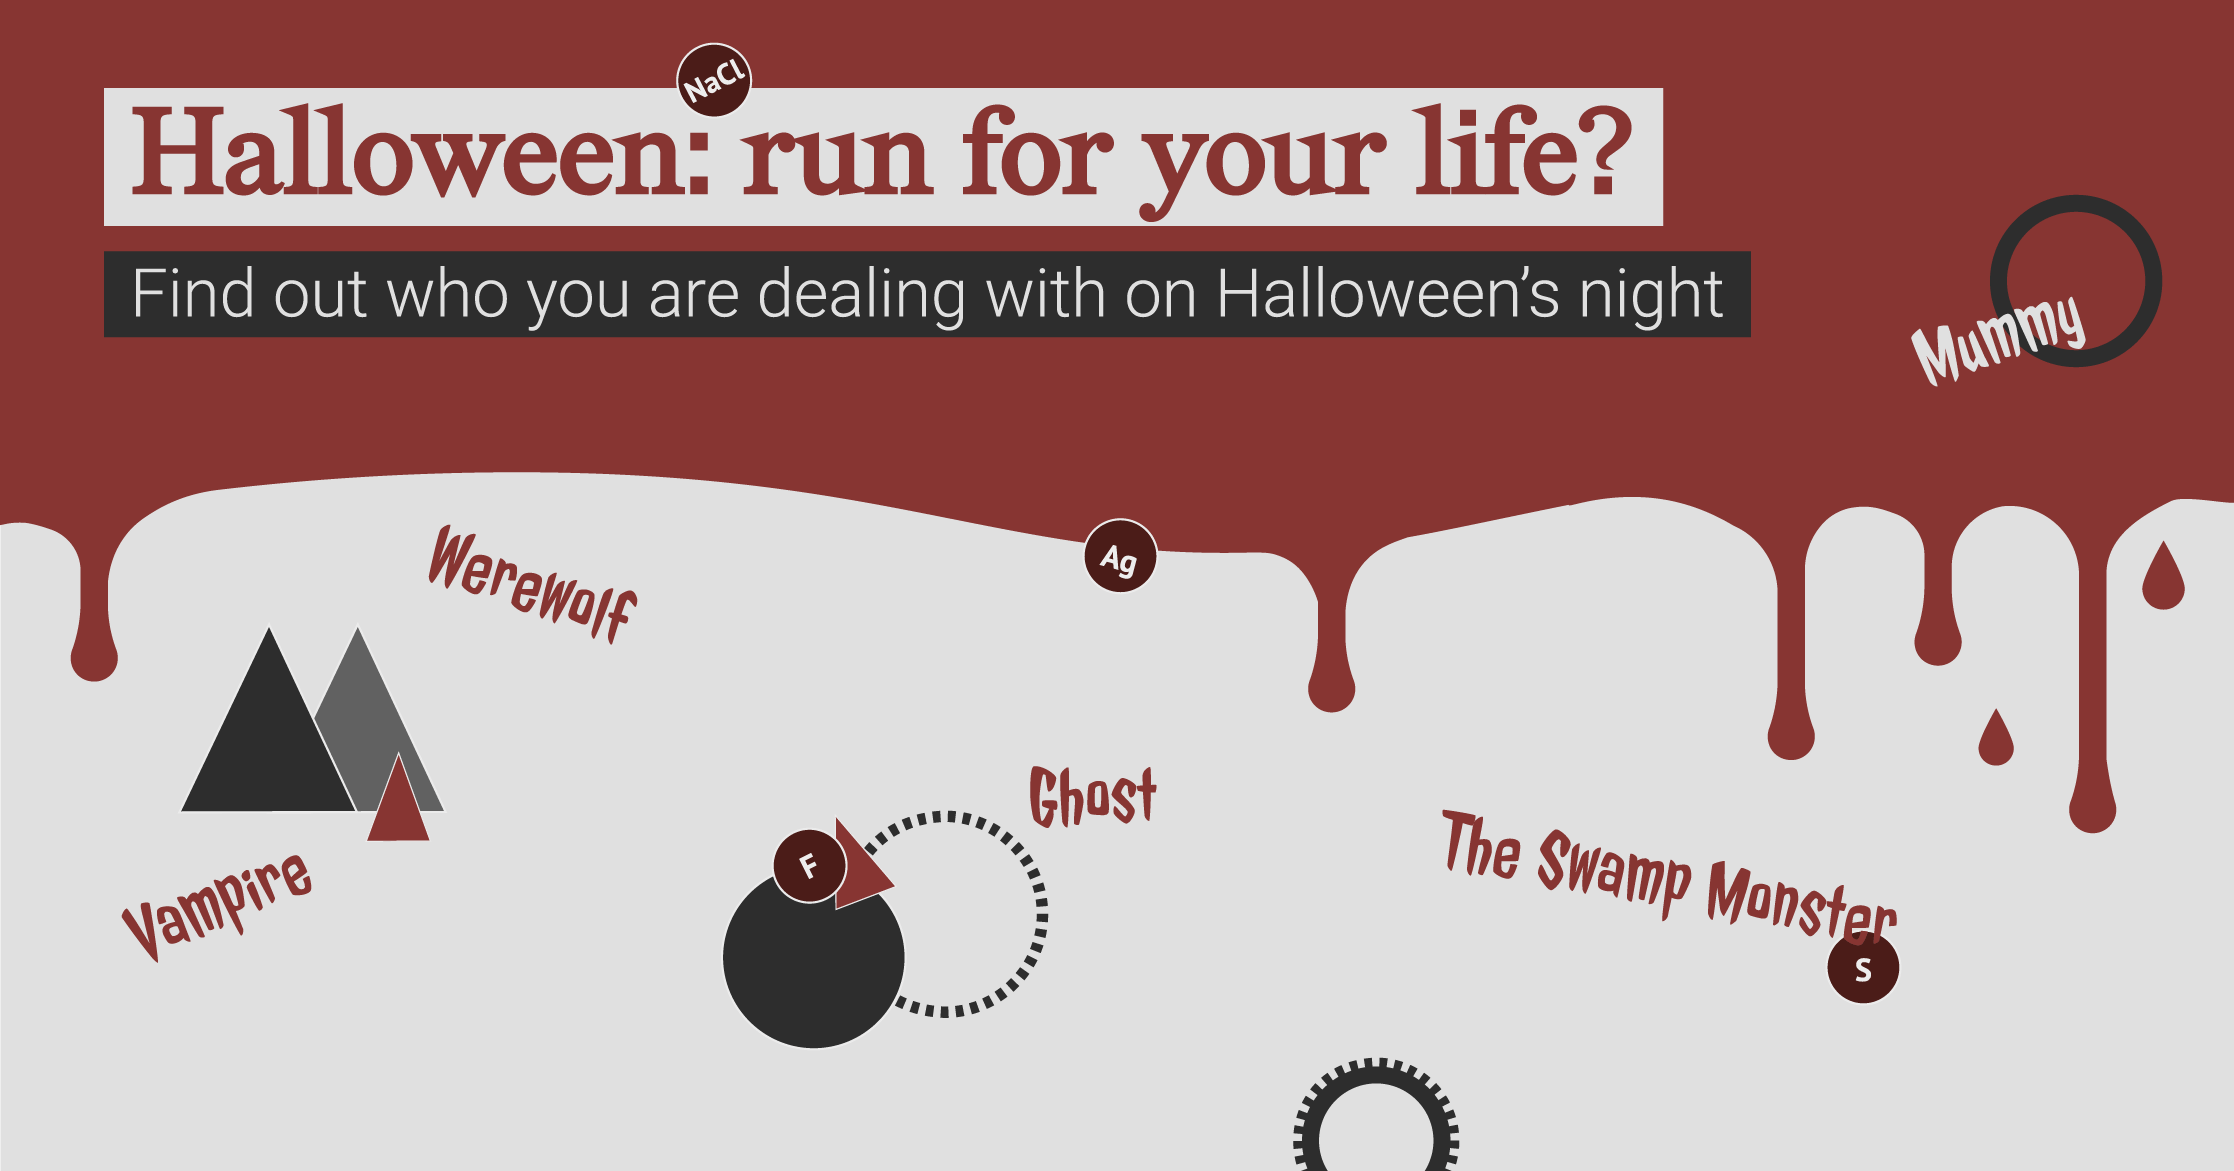
Halloween: run for your life?
It’s that time of the year again when you shouldn’t be surprised if you bump into...

DataViz Best Practices
A deep dive into... stream graphs
As a design enthusiast, stream graphs truly speak to my mind. With their elegant and captivating...
Report Design, Reporting
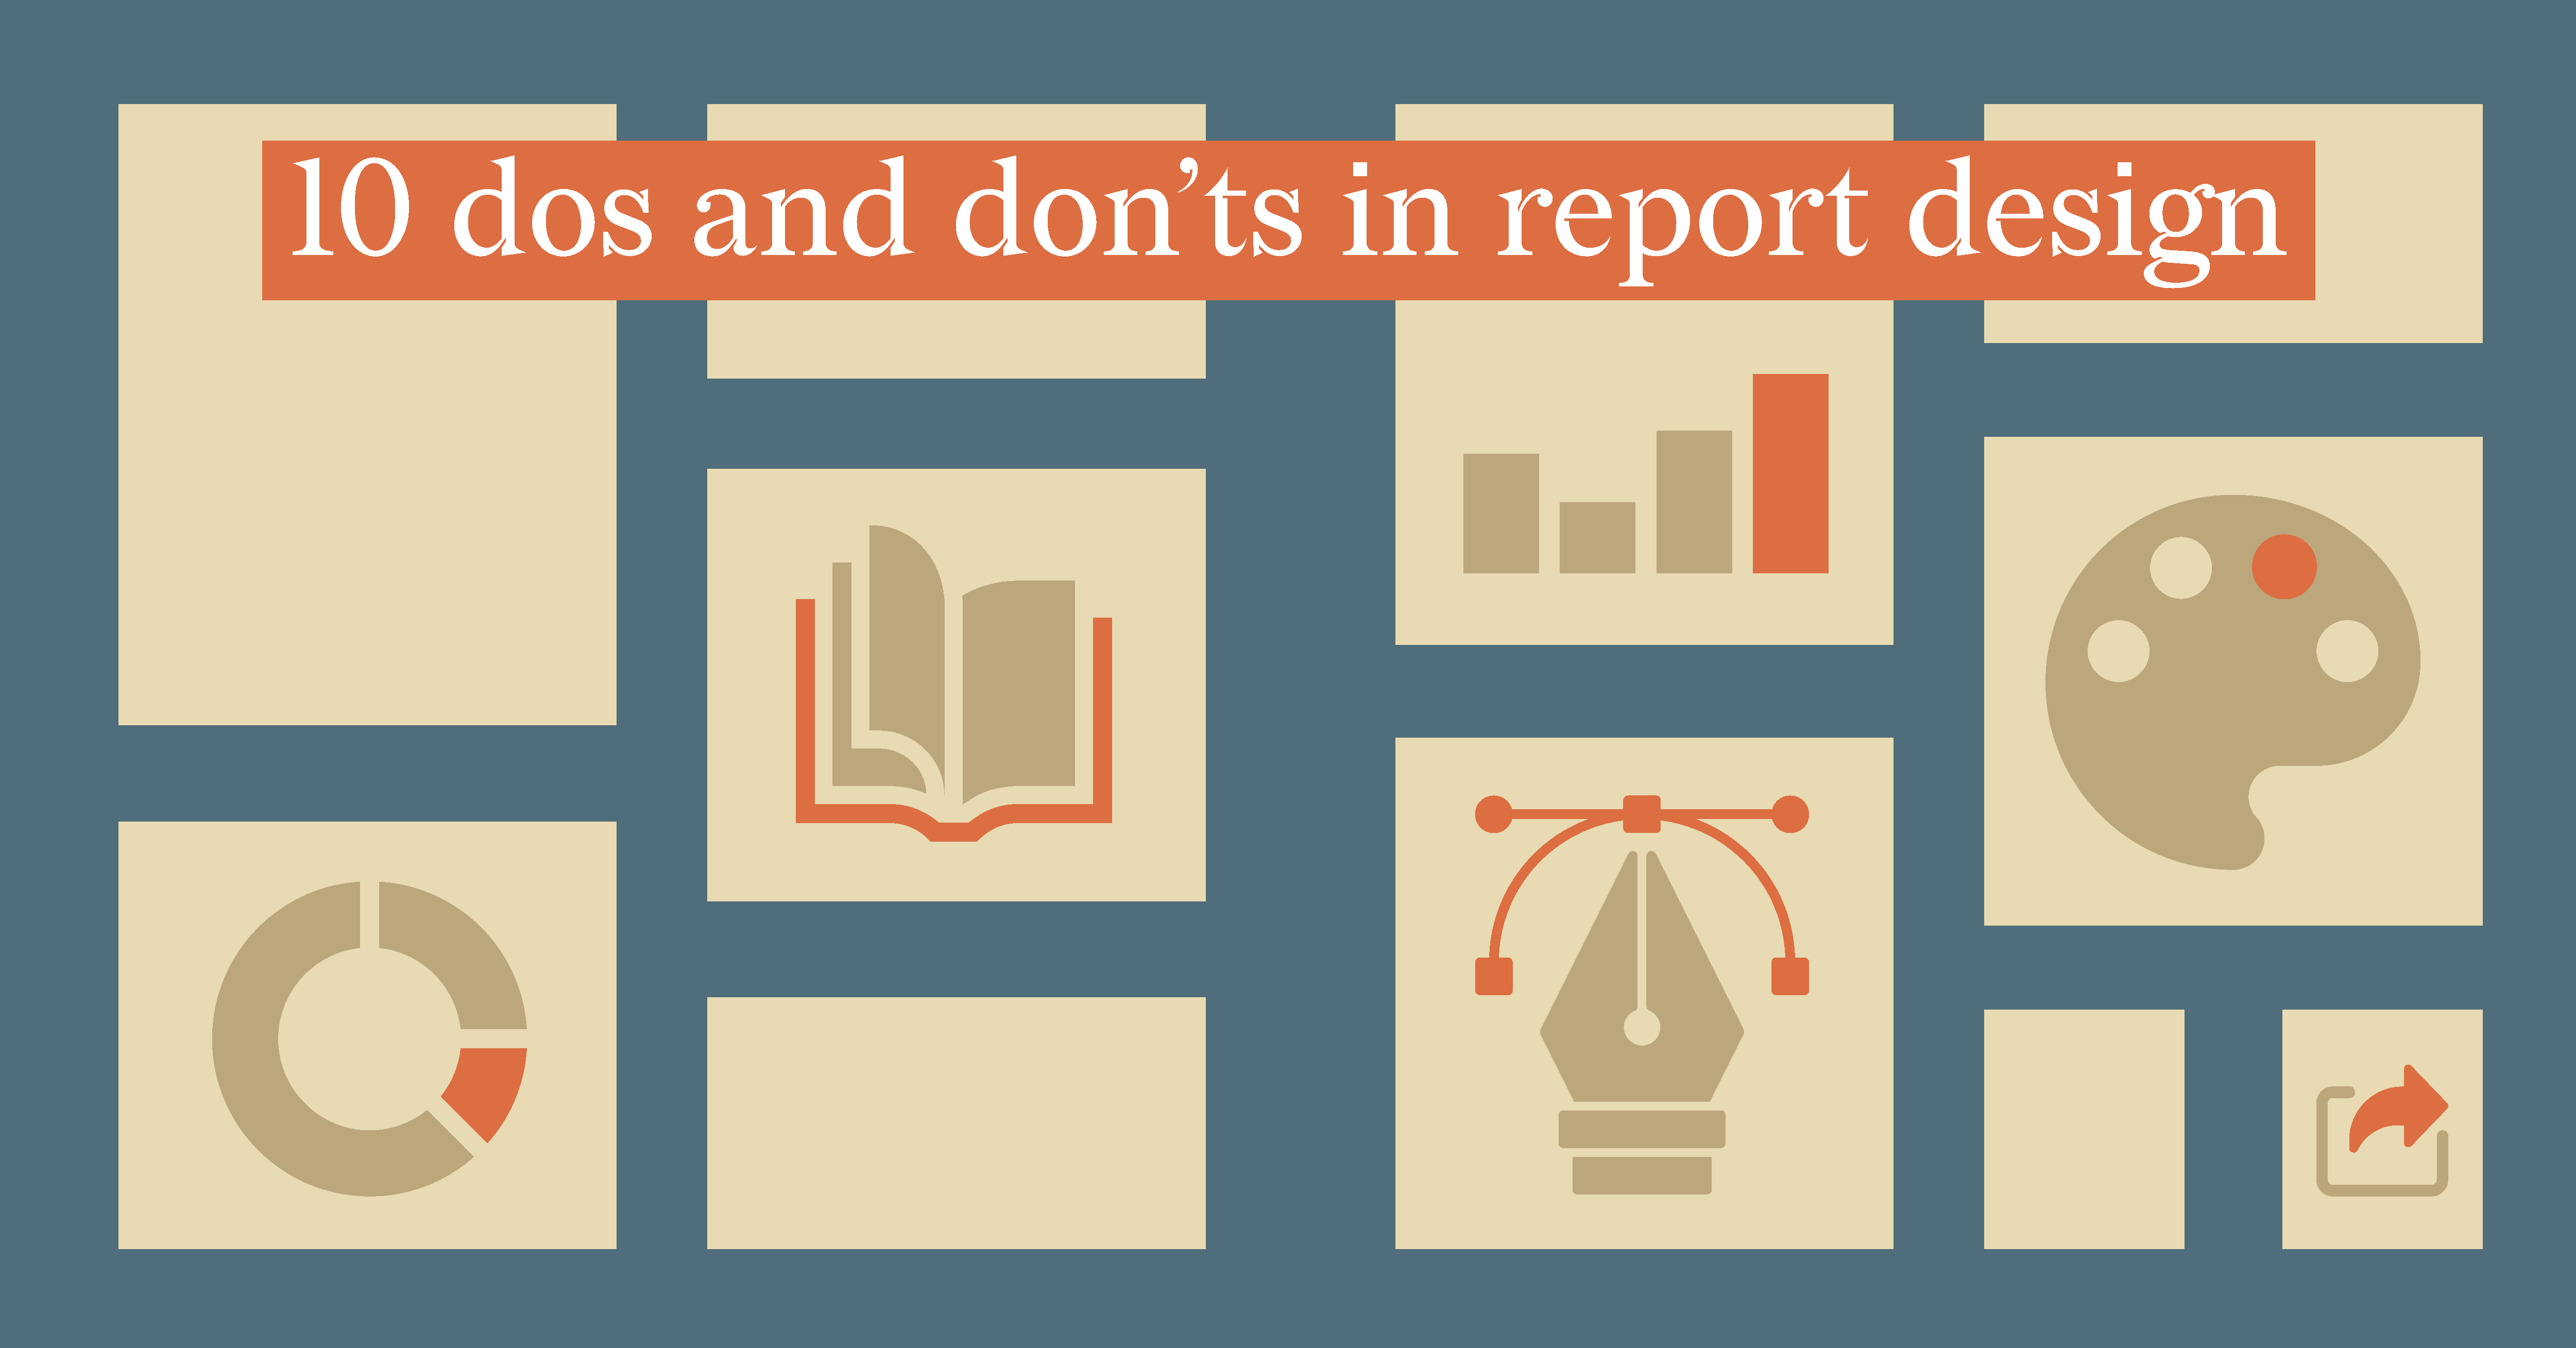
10 dos and don’ts in report design

Dataviz Resources
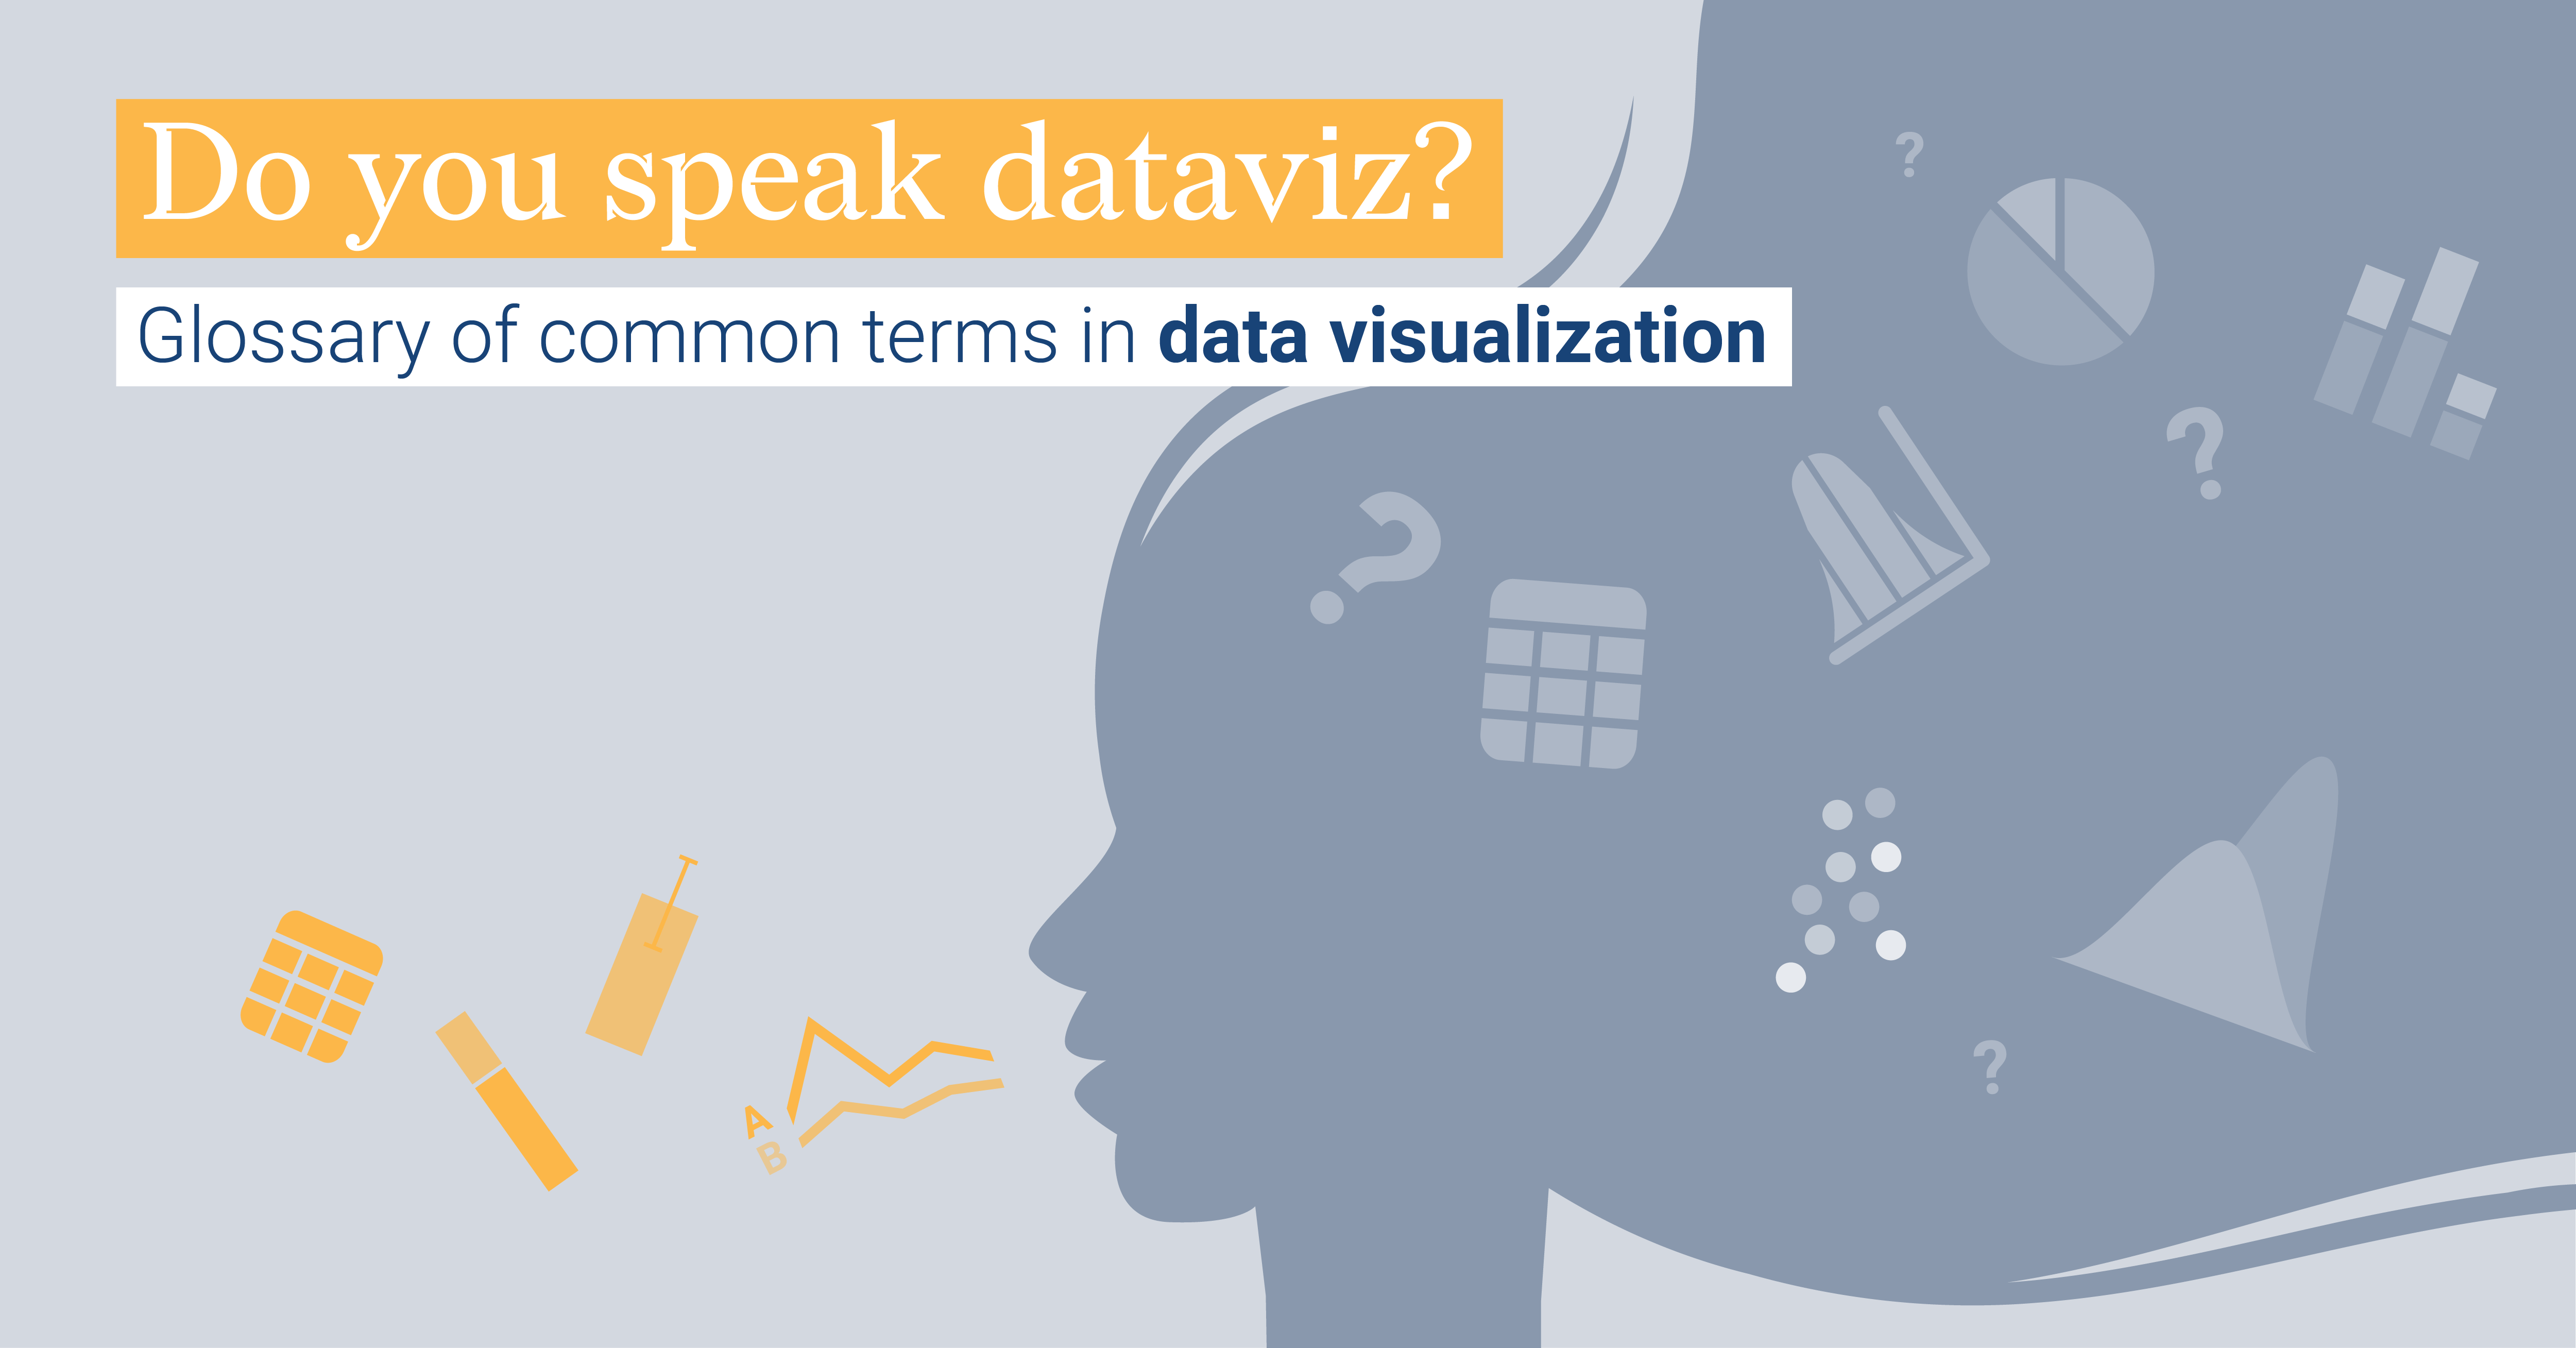
Do you speak dataviz?
Are you a newcomer to the data visualization world? Or are you struggling with some terms in data...