Report Design,Report Server,Reporting,Automated Reporting
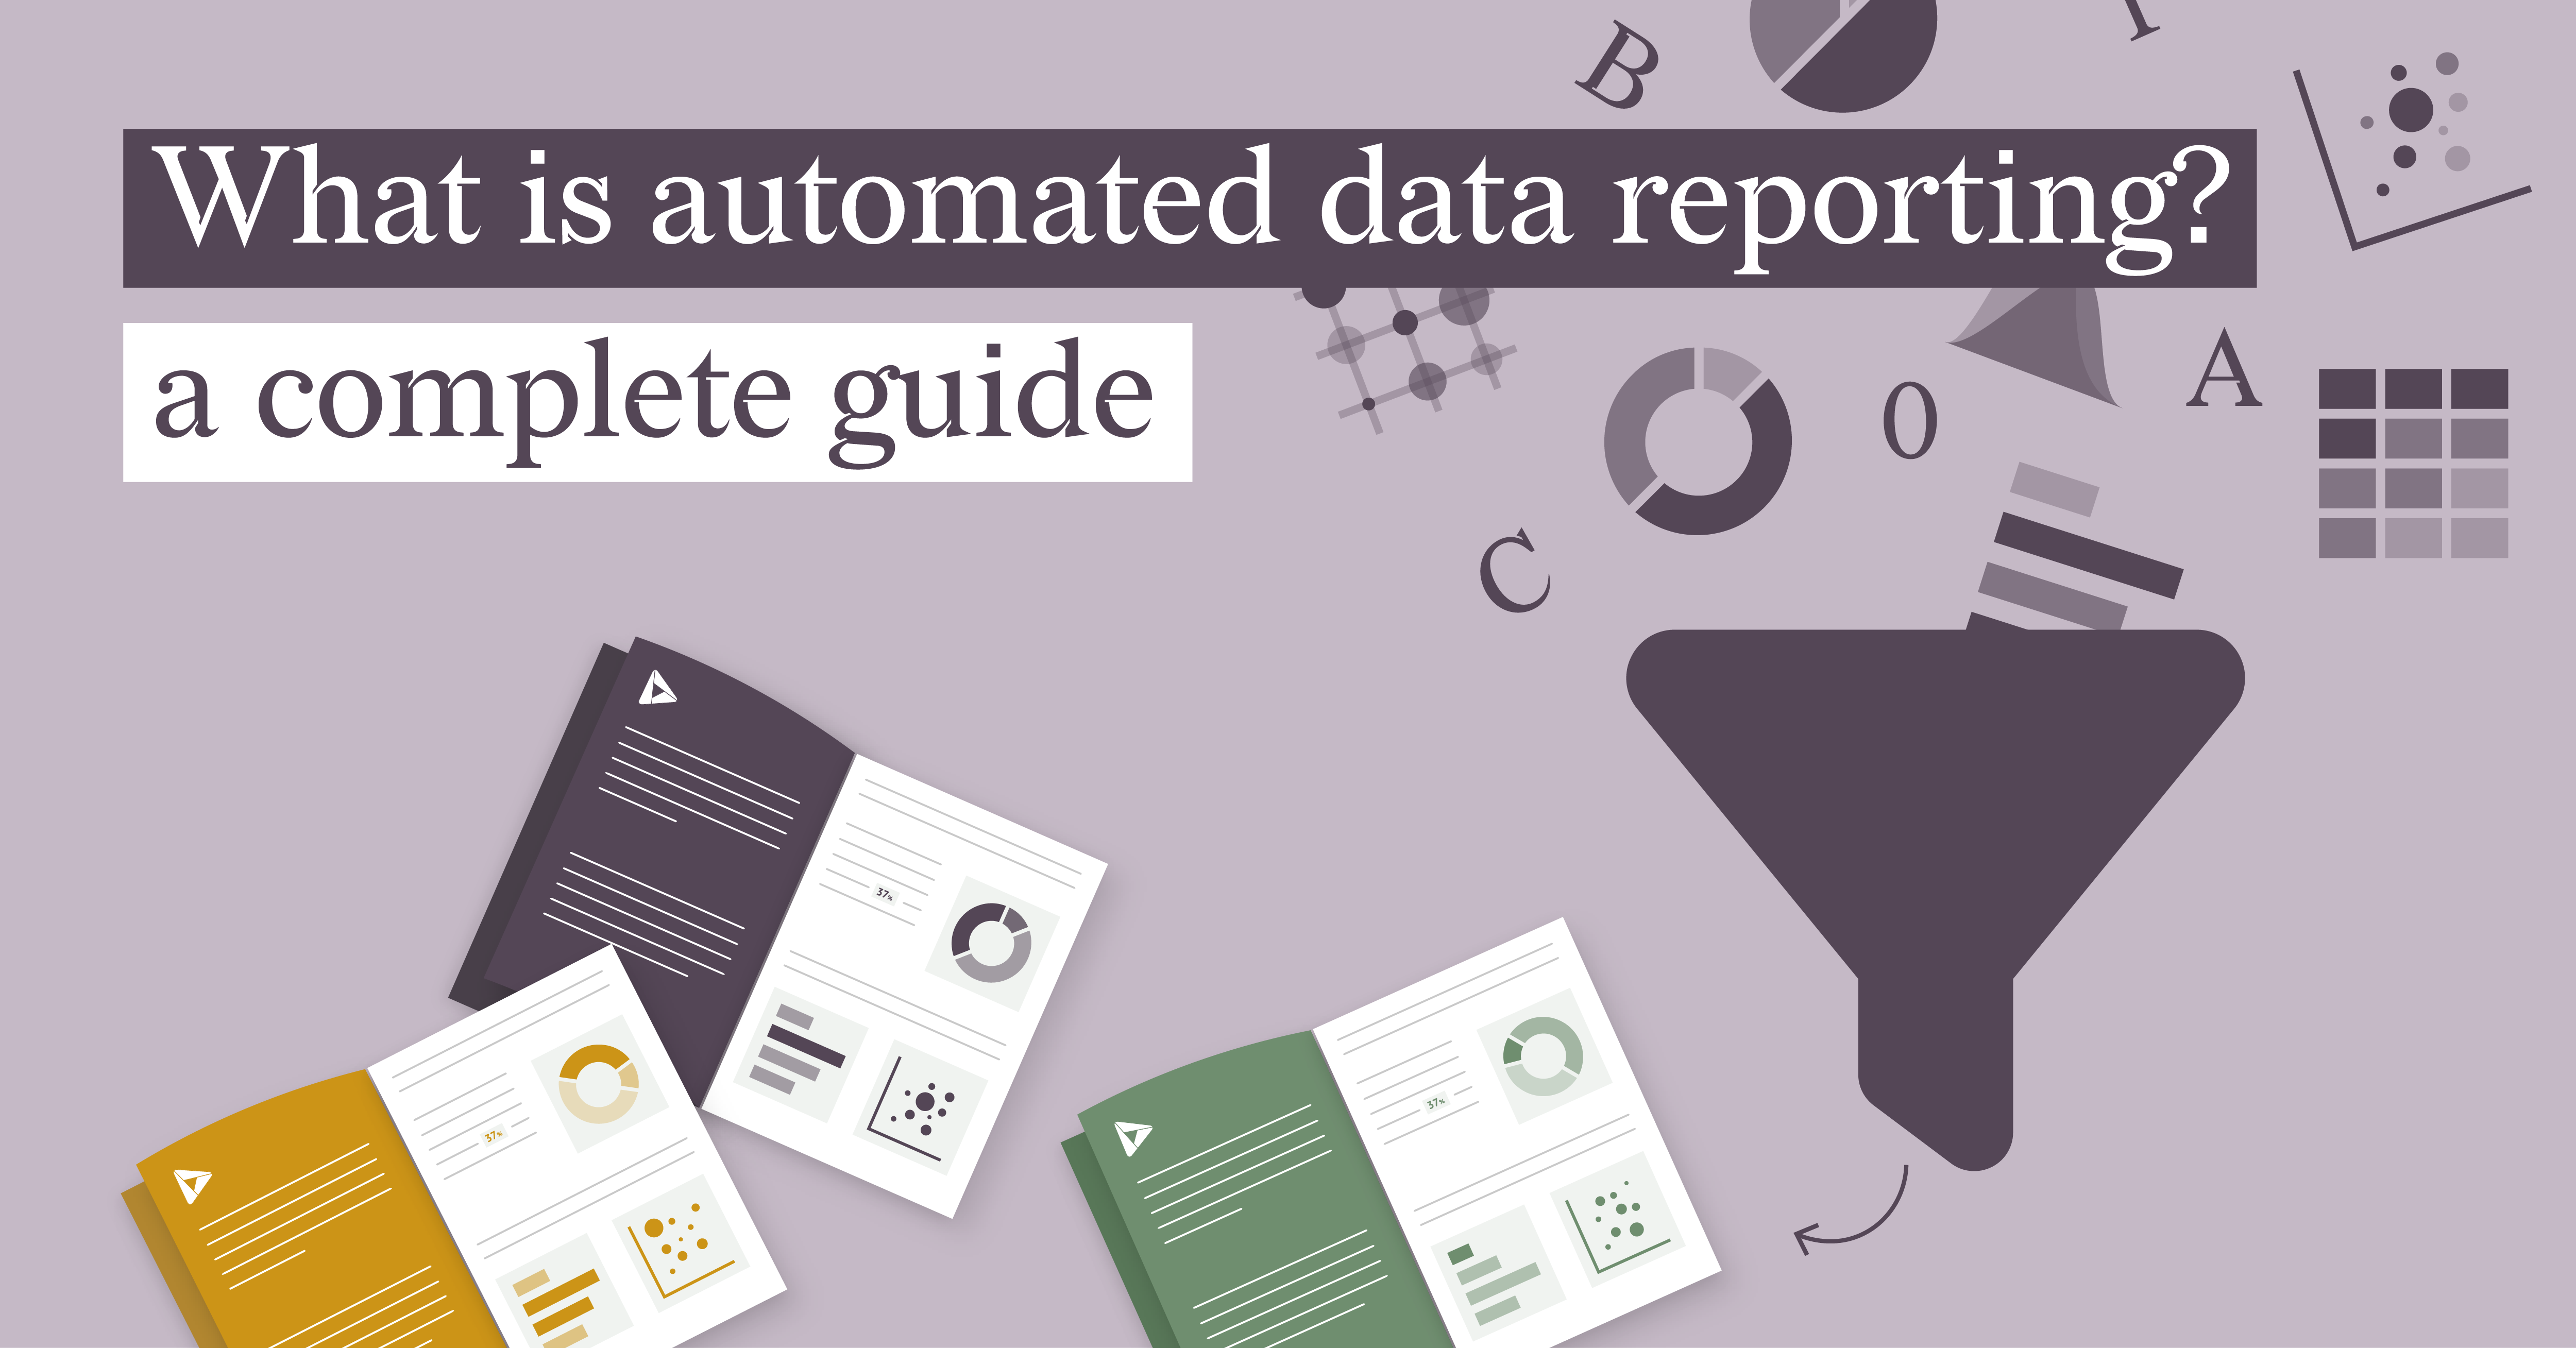
What is automated data reporting? A complete guide
Reporting doesn’t have to be a headache. Still, for many teams, it often is. Data gets pulled from different sources, ...
Read more