DataViz Best Practices, Dataviz Resources, Chart Design, Chart Types
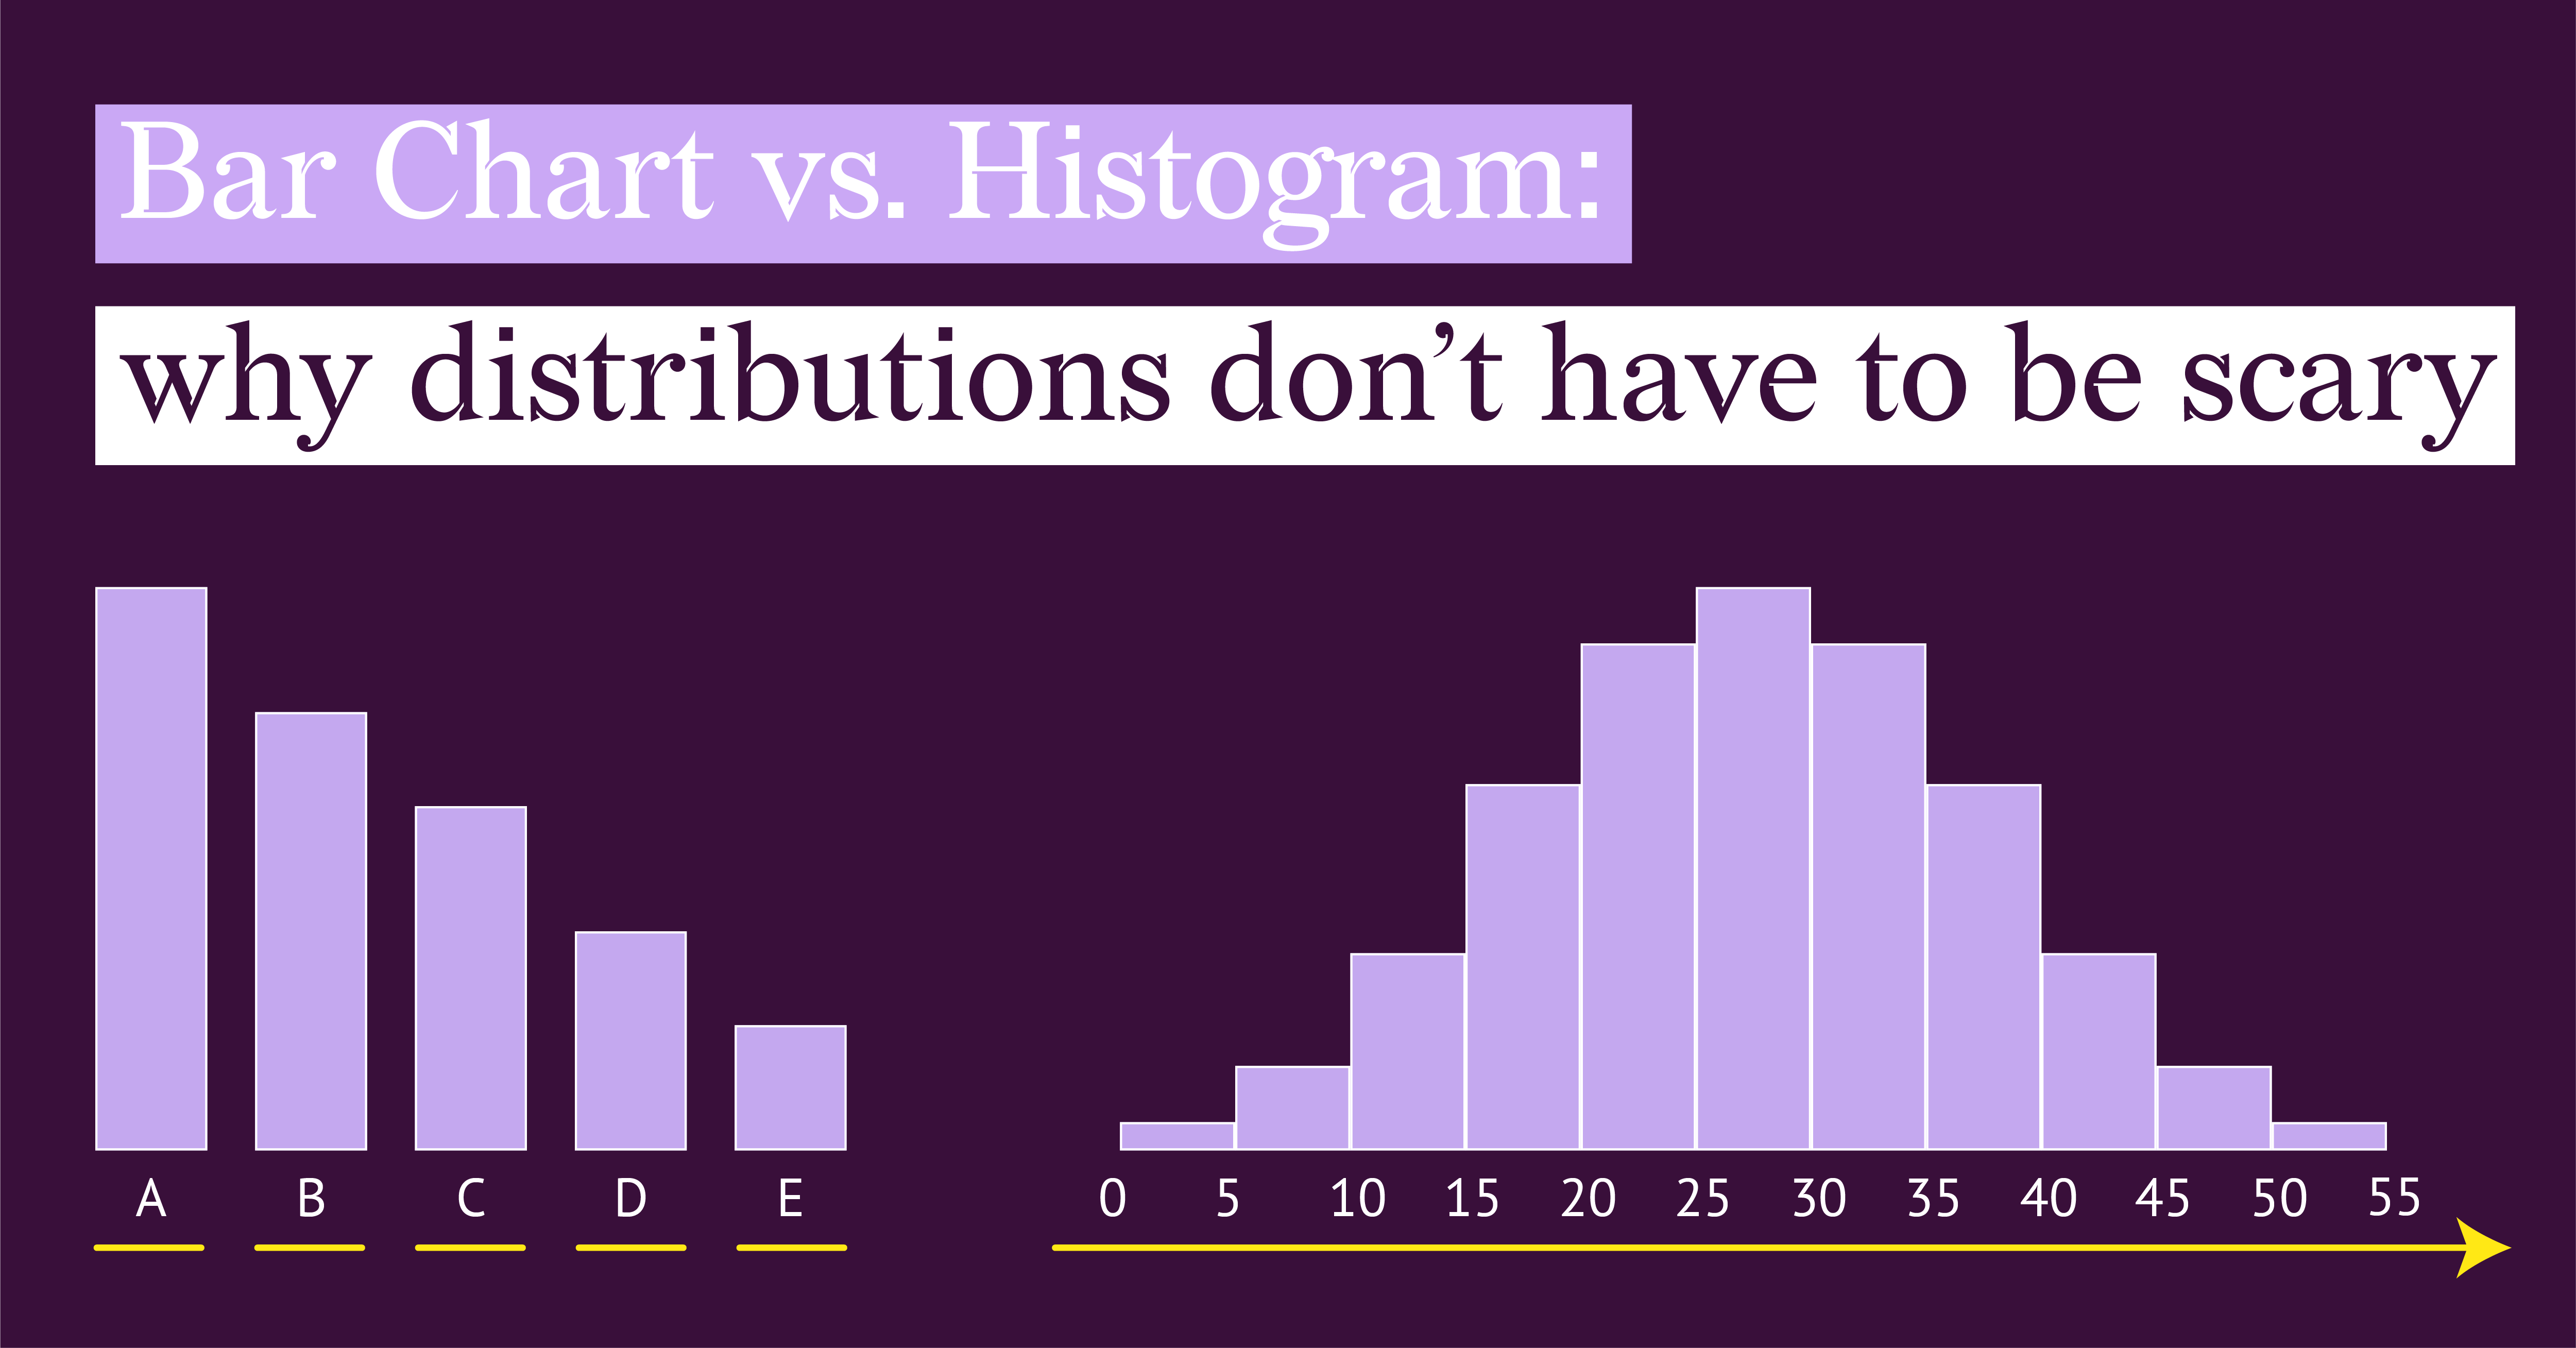
Bar Chart vs. Histogram: Why Distributions Don't Have to Be Scary
Histograms and bar charts look almost identical. If you have ever stared at your data trying to...
Dataviz Resources
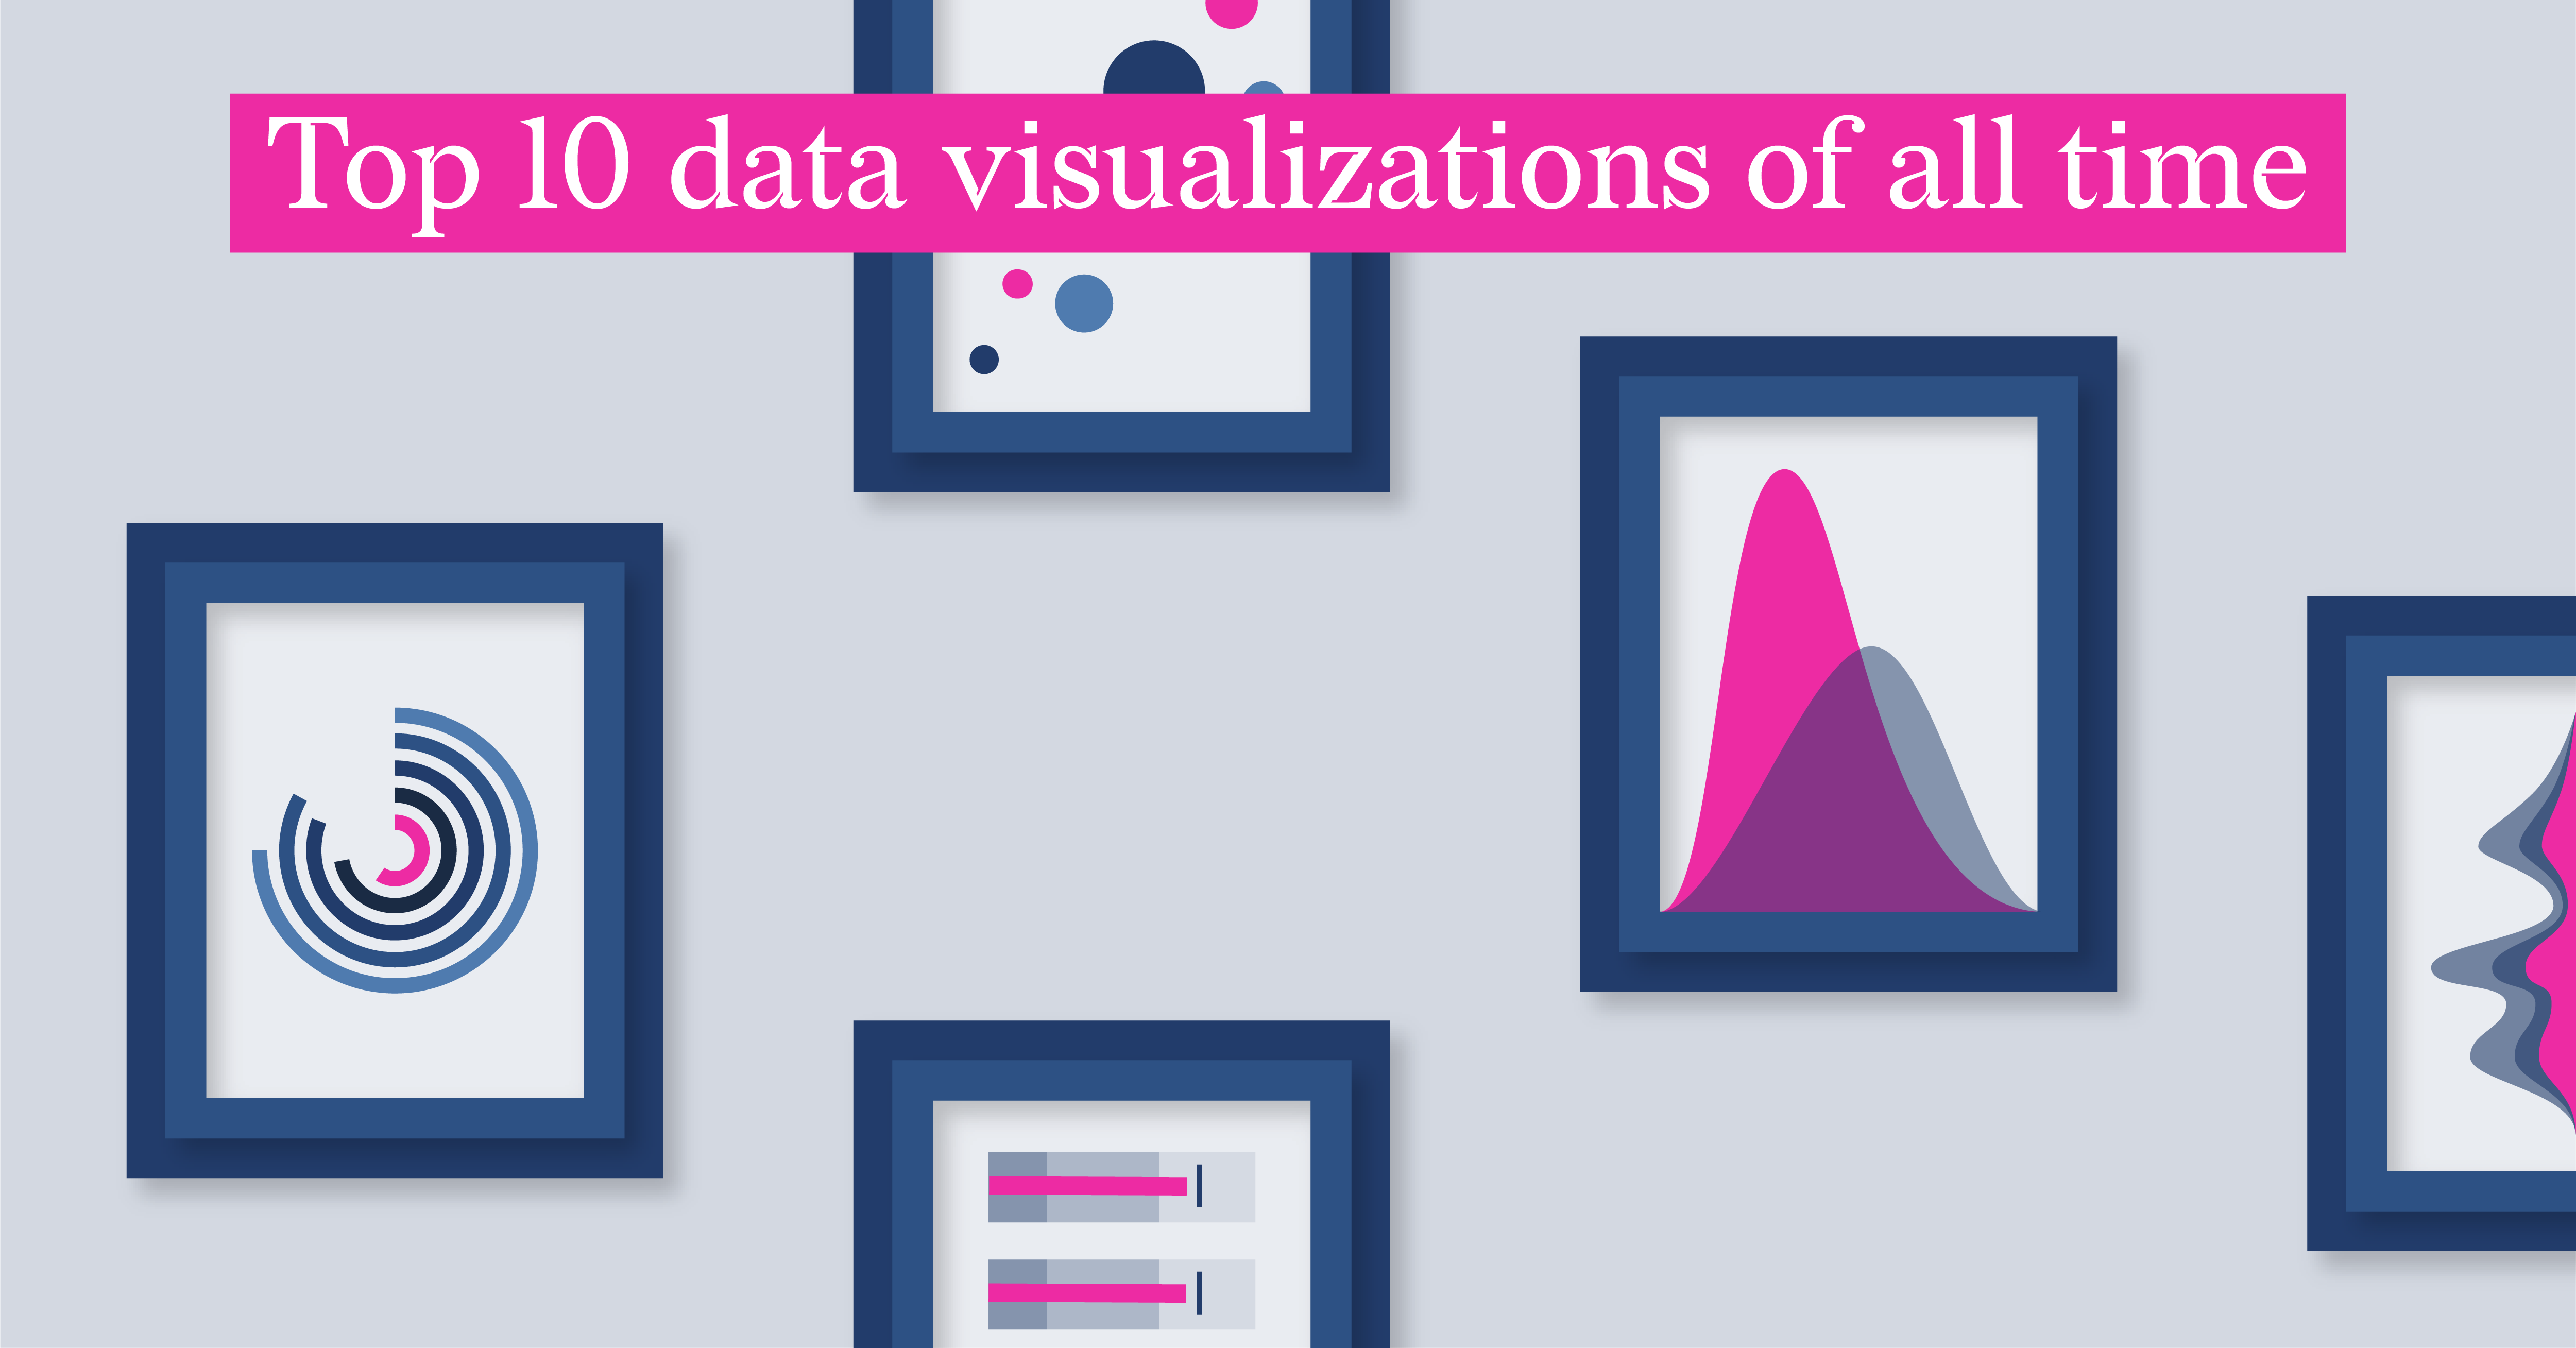
Top 10 data visualizations of all time
You know that spark when a chart tells you more than words ever could? I’ve gathered ten standout...
Report Design, Food For Thought, ESG Reporting
The Ultimate Guide to ESG Reporting
You may agree that environmental, social, and governance (ESG) reporting can feel complicated. You...
DataViz Best Practices, Dataviz Resources, ESG Reporting
CSRD Reporting: Visualizing Long-Term Corporate Sustainability Targets (with examples from practice)
In this blog, we’ll explore the best ways to visualize long-term sustainability goals in CSRD...
DataViz Best Practices, Dataviz Resources, ESG Reporting
The Ultimate Double Materiality Chart
In Part 2 of this educational guide, we identified key best practices for designing an effective...
DataViz Best Practices, Dataviz Resources, ESG Reporting
Real-world Double Materiality Chart Examples
DataViz Best Practices, Dataviz Resources, ESG Reporting
Understanding Double Materiality with Impactful Charts
Reporting, Automated Reporting
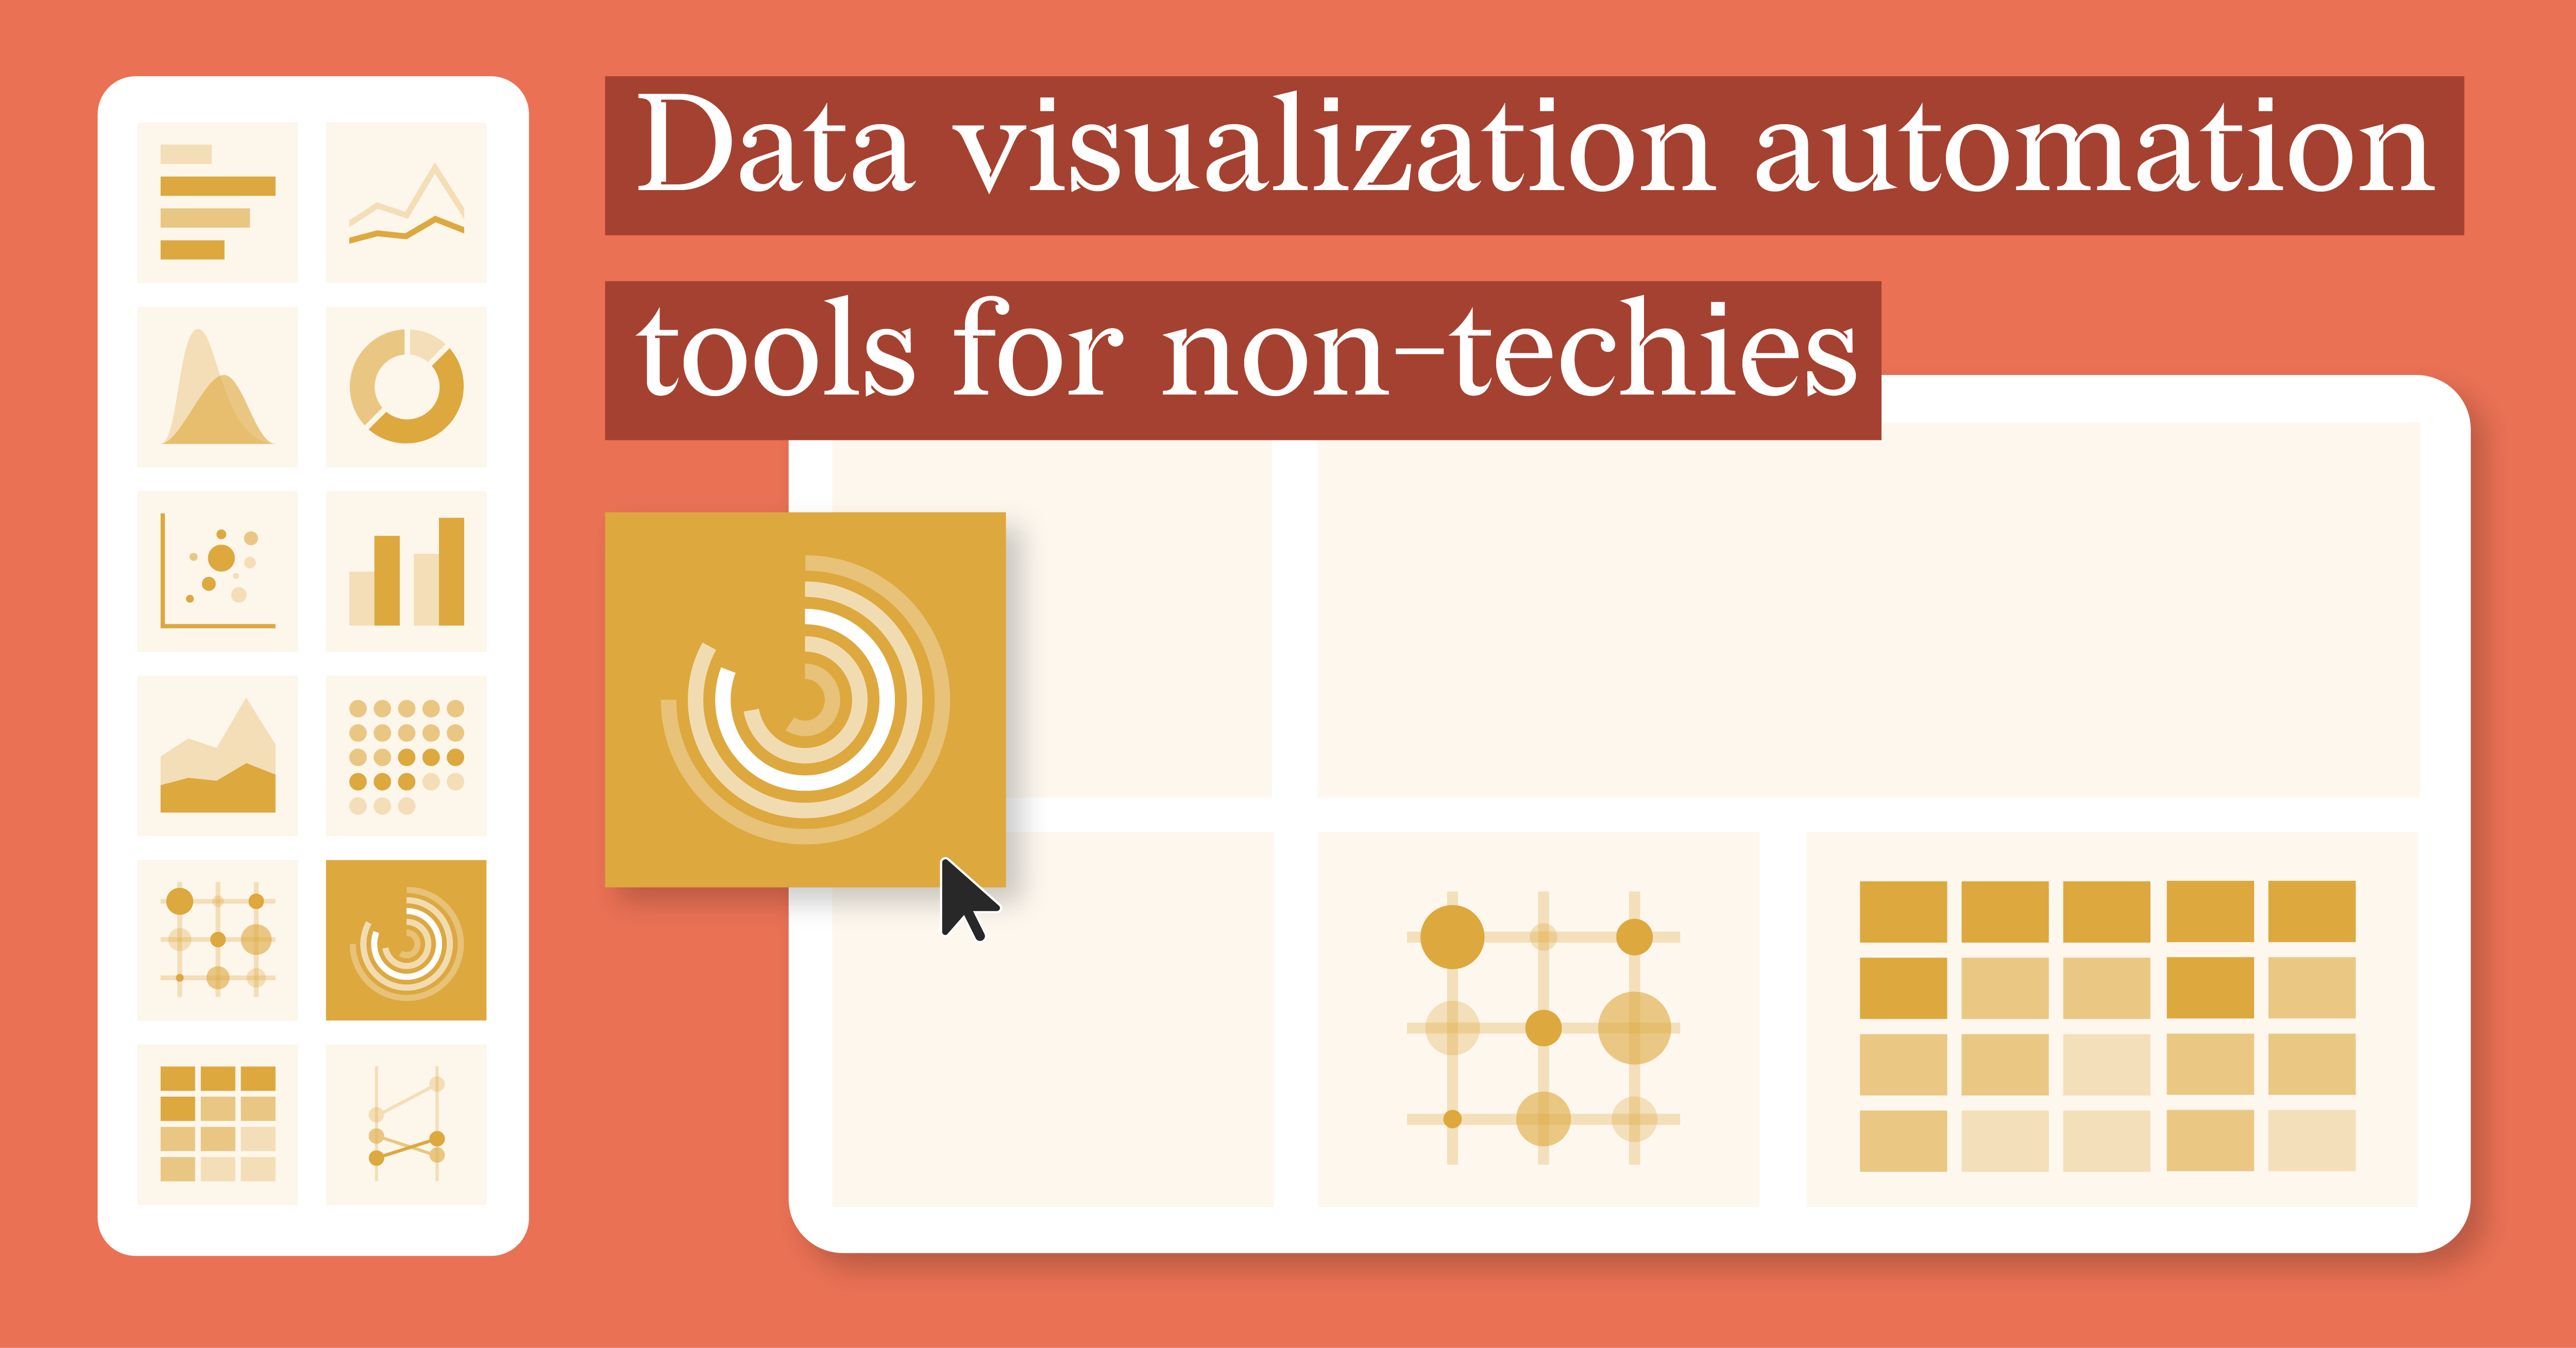
Data Visualization Automation Tools for Non-Techies
In today’s data-driven world, the ability to turn raw data into visually engaging insights is...
Reporting, Automated Reporting
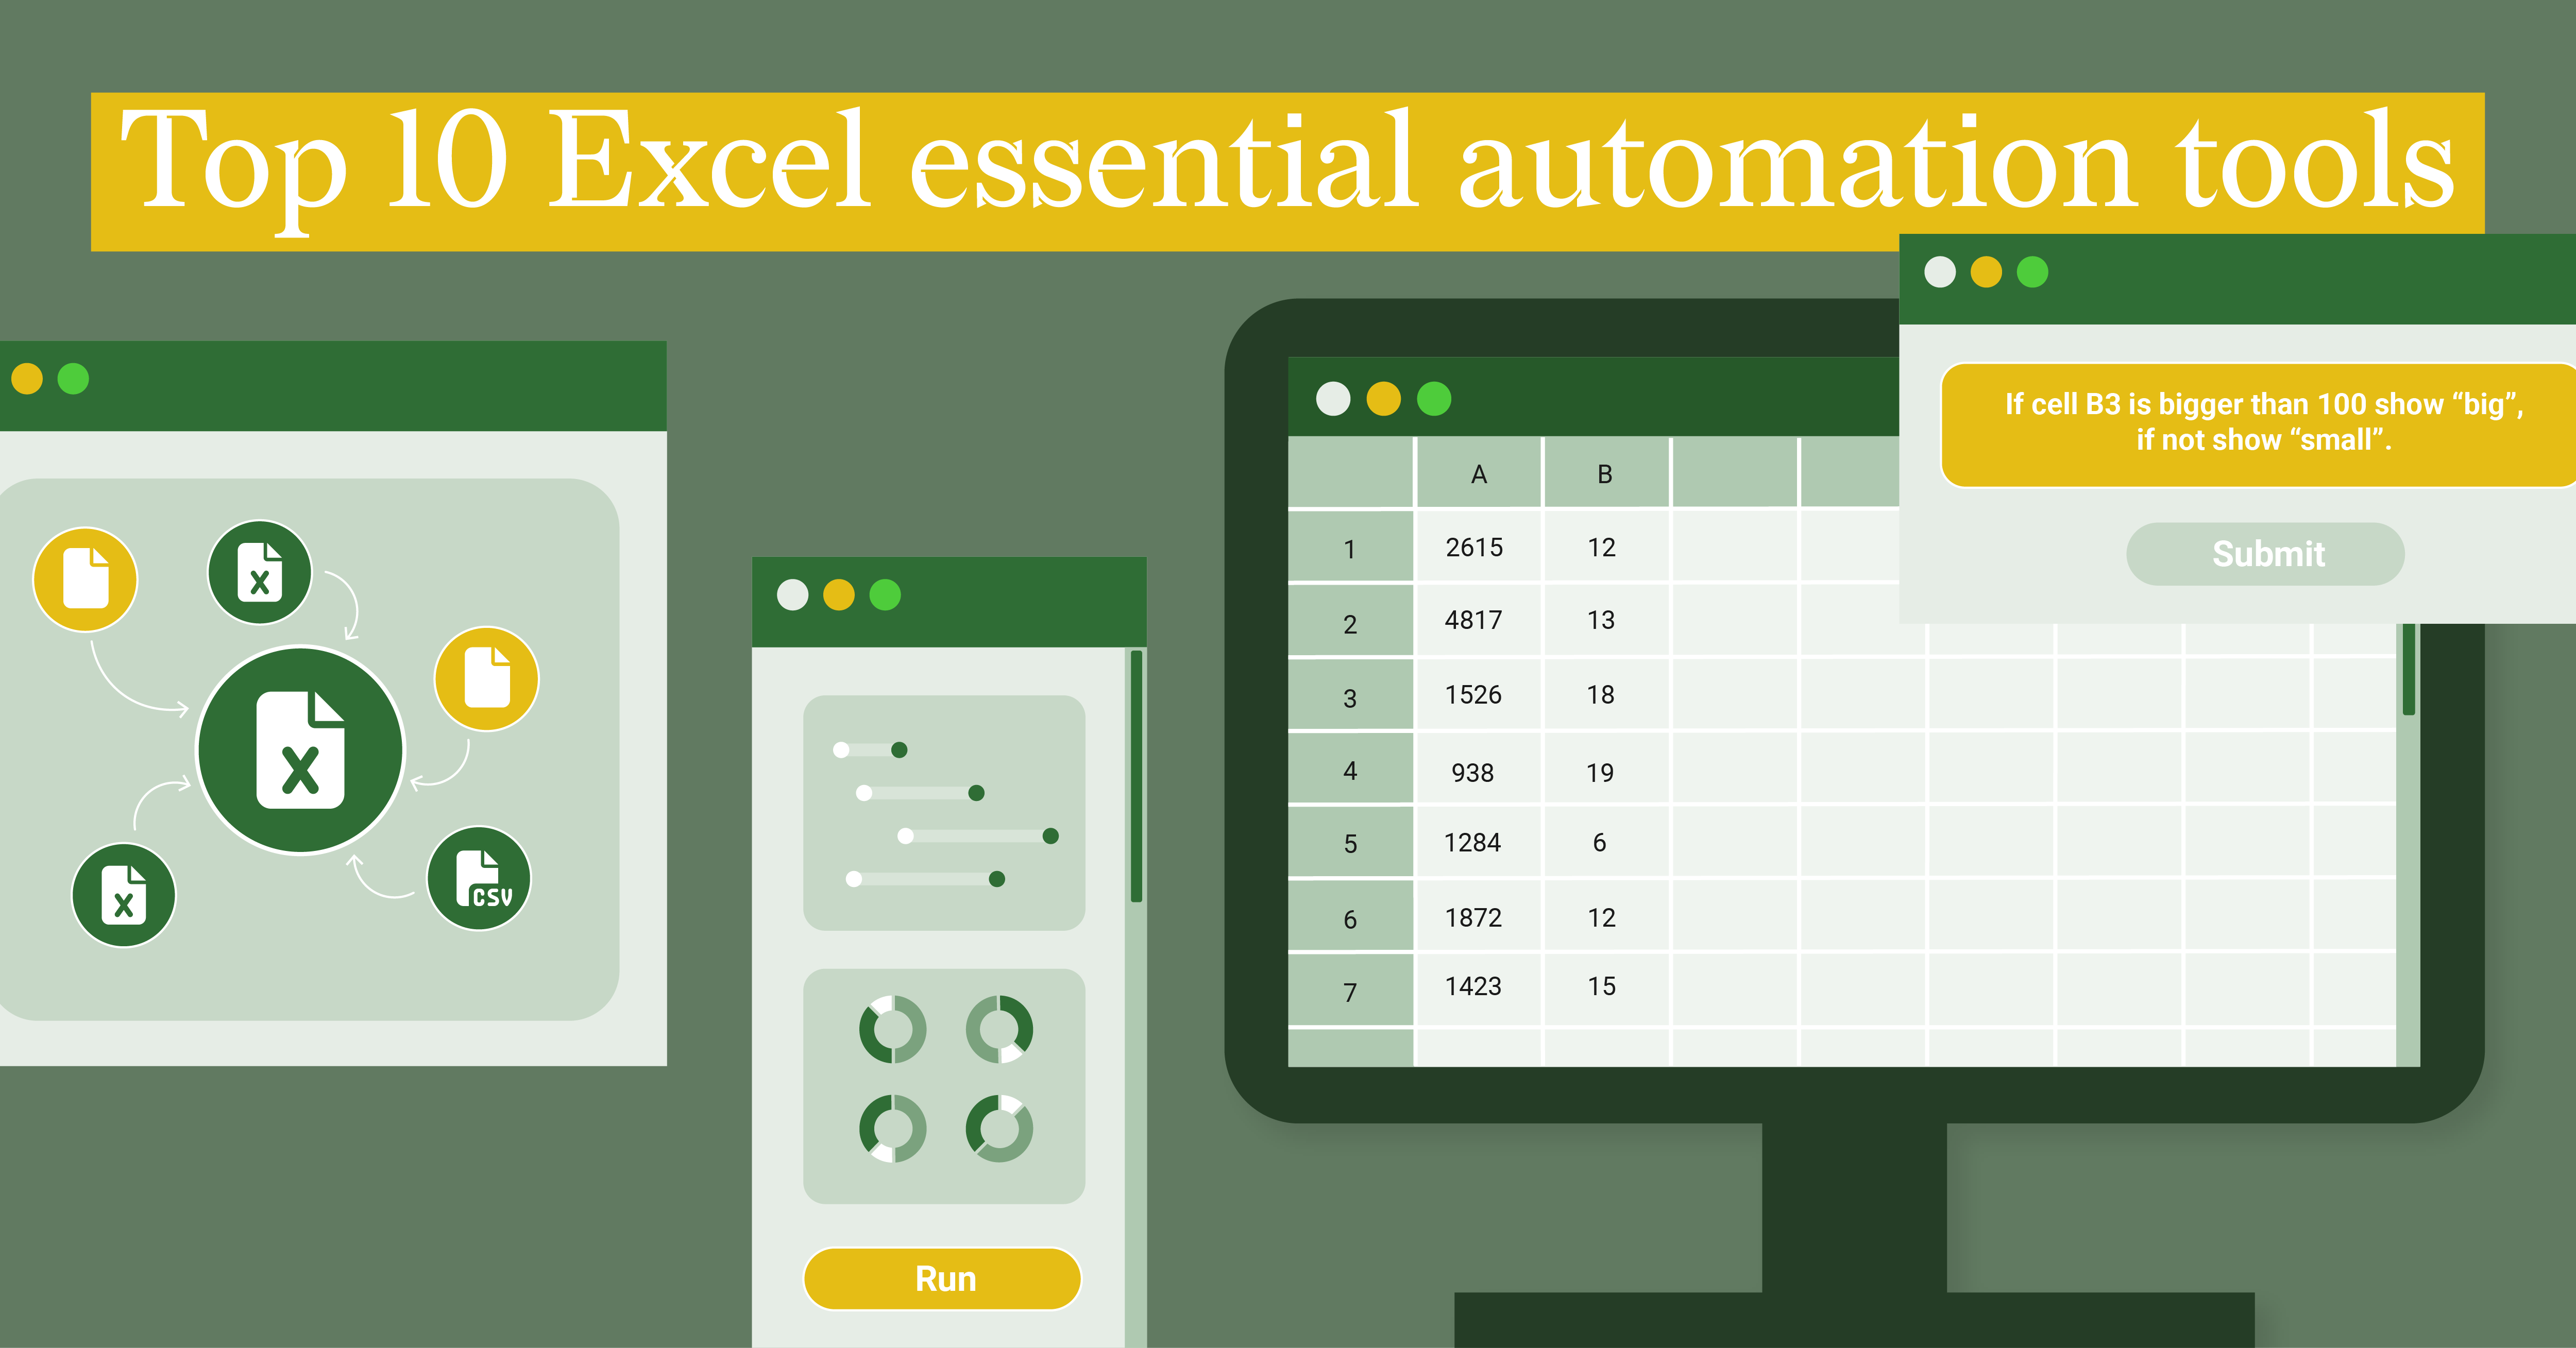
Top Excel Essential Automation Tools
Excel is a staple in the world of data analysis, offering an impressive array of features to...
Report Design, Reporting
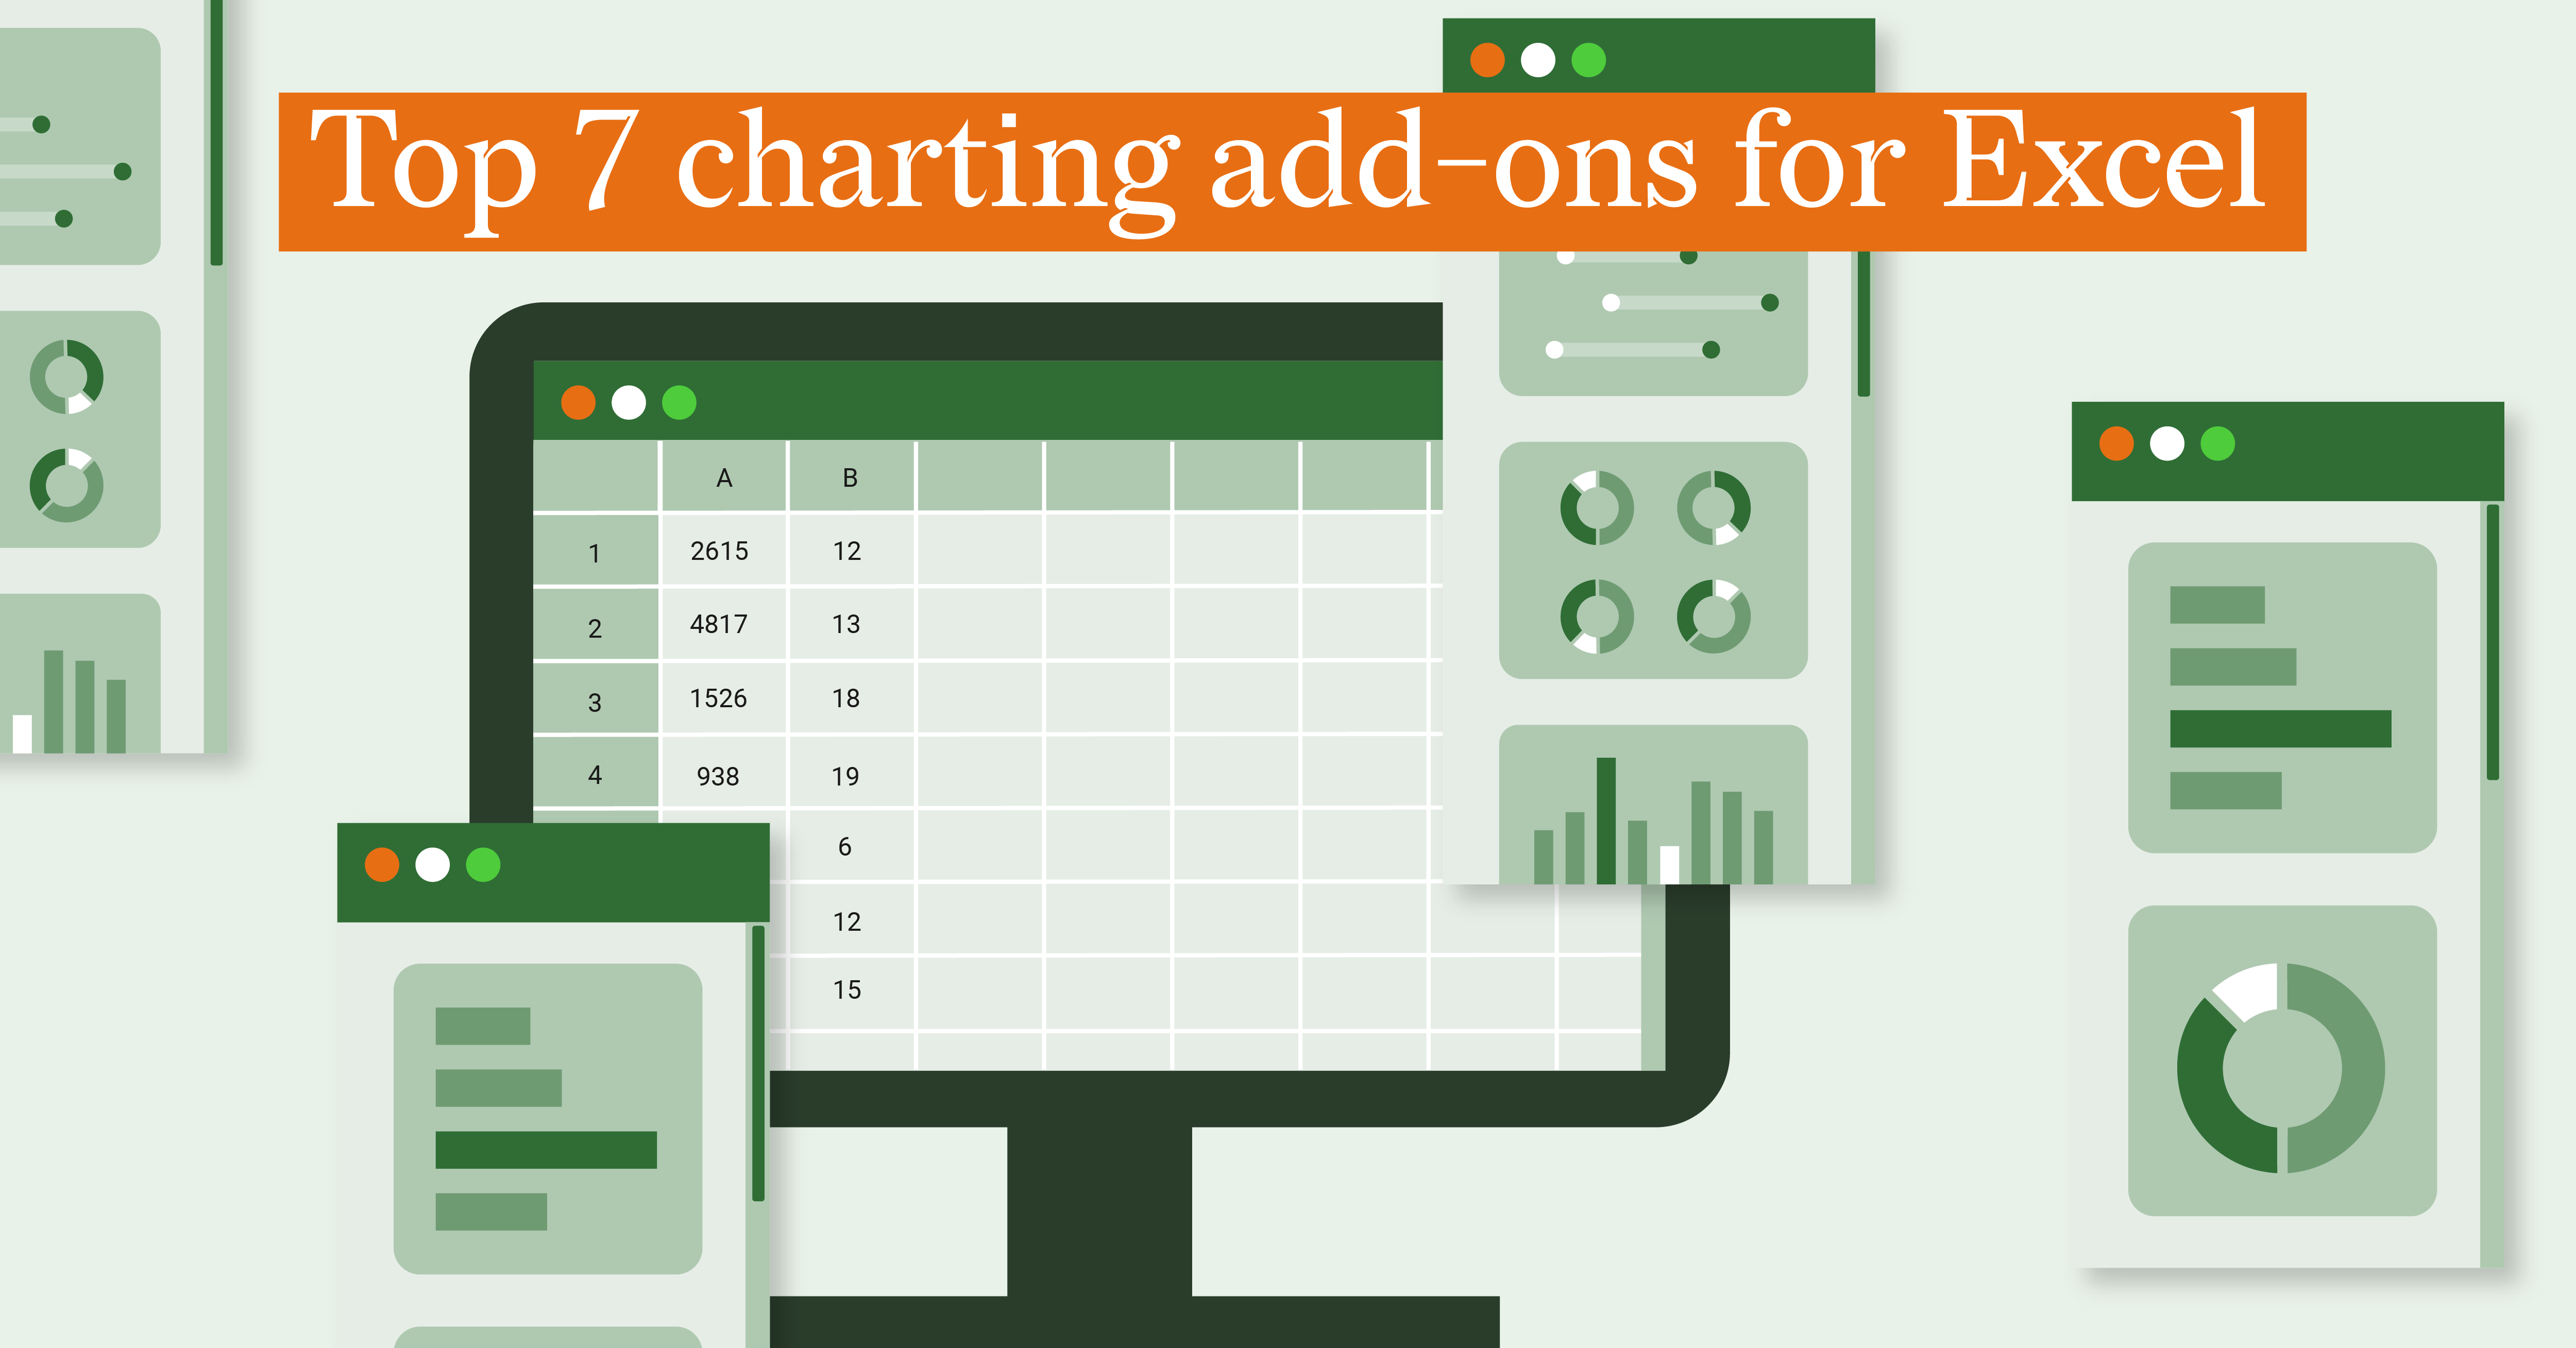
Top 7 charting add-ons for Excel
For professionals working with Excel, the need for advanced charting and visualization...
/datylon-blog-Clear-Compelling-Compliant-%20How-to-Present-Long-Term-Sustainability-Goals-in-CSRD-Reporting-featured-image-2.png)


