Government,Report Design,Report Server,Reporting,Automated Reporting
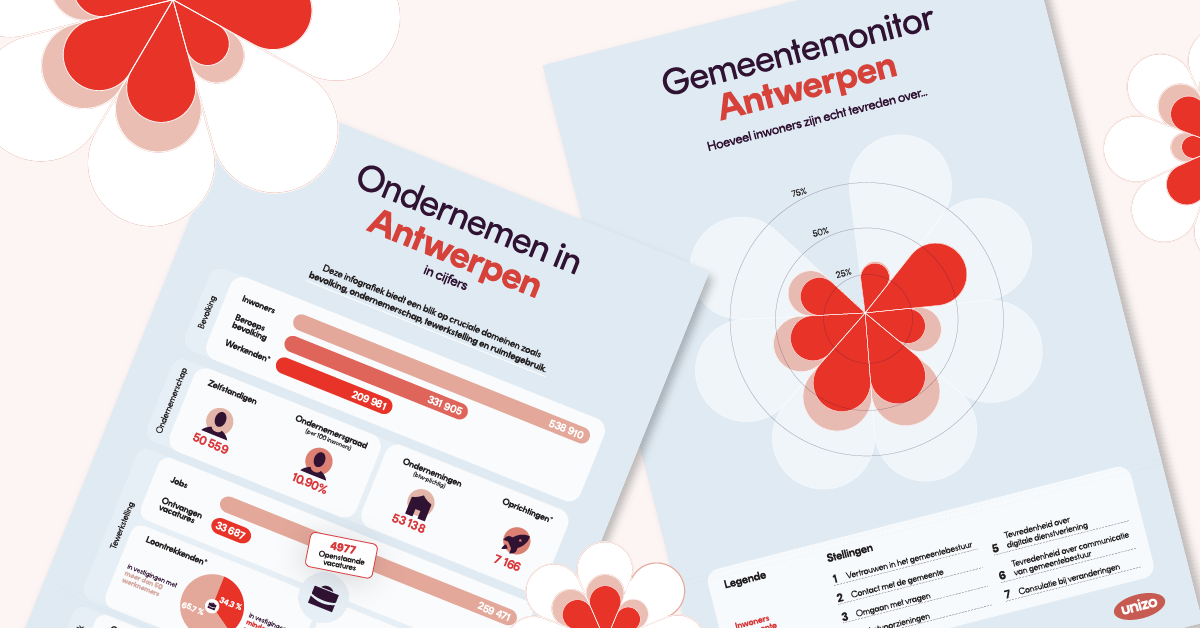
Targeted Reports to Empower Municipalities
Unizo is the largest Flemish employers’ organization in Belgium, representing over 80,000 small and medium-sized enterprises ...
Read More